저작자표시-비영리-변경금지 2.0 대한민국 이용자는 아래의 조건을 따르는 경우에 한하여 자유롭게 l 이 저작물을 복제, 배포, 전송, 전시, 공연 및 방송할 수 있습니다. 다음과 같은 조건을 따라야 합니다: l 귀하는, 이 저작물의 재이용이나 배포의 경우, 이 저작물에 적용된 이용허락조건 을 명확하게 나타내어야 합니다. l 저작권자로부터 별도의 허가를 받으면 이러한 조건들은 적용되지 않습니다. 저작권법에 따른 이용자의 권리는 위의 내용에 의하여 영향을 받지 않습니다. 이것은 이용허락규약(Legal Code)을 이해하기 쉽게 요약한 것입니다. Disclaimer 저작자표시. 귀하는 원저작자를 표시하여야 합니다. 비영리. 귀하는 이 저작물을 영리 목적으로 이용할 수 없습니다. 변경금지. 귀하는 이 저작물을 개작, 변형 또는 가공할 수 없습니다.
Glioma – produced periostin attracts human neural
stem cells
by
Jeong Yong Jeon
Major in Neuroscience
Department of Biomedical Sciences
The Graduate School, Ajou University
Glioma - produced periostin attracts human neural
stem cells
by
Jeong Yong Jeon
A
Dissertation
Submitted
to
The
Graduate
School
of
Ajou University
in Partial Fulfillment of the Requirements for the Degree of
Ph. D. in NeuroSciences
Supervised by
Myung Ae Lee Ph.D.
Major in Neuroscience
Department of Biomedical Sciences
The Graduate School, Ajou University
This certifies that the dissertation
of Jeong Yong Jeon is approved.
SUPERVISORY COMMITTEE
(Sign)
Hae Young Suh-Kim
(Sign)
Eun Hye Joe
(Sign)
Gwang Lee
(Sign)
Myung Ae Lee
(Sign)
Do Hyun Nam
The Graduate School, Ajou University
June, 25nd, 2010
i
- ABSTRACT -
Glioma – produced periostin attracts human neural stem cells
Stem cells from various lineages have been well known for their migration tendency
toward glioma and become attractive vehicles to deliver therapeutic genes to brain
tumors.
However, which factors and mechanisms in these processes are not yet
known.
In the present study, I aimed at identifying the chemoattractant molecules which induce the tropism of human neural stem cell (hNSC) for brain tumor and characterizingtheir mode of mechanisms. For this, I performed microarray analyses of different type of
brain tumors and identified 14 secretory proteins that were highly and specifically expressed
in brain tumors. Real-time PCR assay and immunohistochemistry with various brain tumor
samples showed that periostin (POSTN) among these factors, known for its role in
angiogenesis and invasion during tumor development, was specifically expressed only in
glioblastoma multiforms, malignancty tumors. We are also found that a recombinant human
POSTN promoted migration of hNSCs in vitro with 3 times higher potency than VEGF.
Transplantation of NIH3T3 cells in a rat brain expressing a secretable POSTN in one
cerebral hemisphere induced migration of NSCs that were inoculated in the contralateral of
hemisphere. We found that POSTN bound to integrin aVb5 complex in NSCs promoted phosphorylation of focal adhesion kinase (FAK) and protein kinase B (AKT) through
ii
ERK suppress that signaling dramatically impaired the migration of hNSCs toward POSTN.
NSC use similar signaling pathway during CNS development and glioma invasion
Previous study demonstrated that hNSCs (F3.CD) that were retrovirally transduced with
cytosine deaminase (CD) gene showed remarkable bystander effects on the glioma cells after
application of the prodrug, 5-fluorocytosine (5-FC). To harness the chemotactic ability of
POSTN as a tool to induce a strong bystander killer effect of brain tumors, we established
the brain tumor animal model which was implanted with C6 cells and the increasing number
of POSTN-overexpressing cells, and F3.CD cells were injected into the contralateral
hemisphere followed by systemic 5-FC administration. Interestingly, increasing number of
POSTN-overexpressing cells resulted in significant reduced tumor volumes, but not tumor
cell numbers. While many tumor cells scattered around the original transplantation site in
control tumor group, scattered cells became disappeared with increasing number of
POSTN-releasing cells. This result demonstrated that the more POSTN was released, the faster hNSC
migrated, which resulted in much NSCs at tumor site and more clearance of tumor cells.
Taken together, POSTN treatment combined with bystander killer effect of NSCs might have
strong therapeutic potential against aggressively invasive gliomas.
iii
TABLE OF CONTENTS
ABSTRACT ··· ⅰ TABLE OF CONTENTS ··· ⅲ LIST OF FITURES ··· Ⅴ LIST OF TABLES ··· ⅶ ABBREVIATION ··· ⅷ Ⅰ. INTRODUCTION ··· 1Ⅱ. MATERIAL AND METHODS ··· 7
1. Cell culture··· 7
2. In vitro migration ··· 7
3. Collection of normal brain and brain tumor tissue··· 8
4. RNA isolation and application to Affymetrix GeneChip··· 8
5. Real-time quantitative RT–PCR··· 9
6. Western Blotting Analysis ··· 9
7. Reveres Transcription - PCR ··· 10
8. Immunohistochemistry ··· 11
9. Construction of Periostin overexpressing cell line··· 12
10. In vivo migration··· 13
11. Analysis of CD enzyme activity··· 14
12. In vitro bystander effect assay··· 14
iv
13. Statistical analysis ··· 15
Ⅲ. RESULTS ··· 16
1. Expression profiling of secreted genes from human brain tumor tissues ··· 16
2. Differential expression of 14 Candidate genes in several human brain tumor tissues ···23
3. Periostin more intensely expressed in human brain tumor tissues than normal brain ···26
4. Periostin strongly attracted neural stem cell than VEGF··· 29
5. Neural stem cell has motility to Periostin-expressing NIH3T3 in vivo condition 34 6. Peirostin Receptor expression in neural stem cell lines··· 42
7. FAK and CDK5 signal pathway was included in the neural stem cell migration 44 8. The neural stem cell migration regulated by DCX signal pathway··· 46
9. Cytotoxic effect of F3-CD cell to p-NIH3T3 cell ··· 50
10. The therapeutic effect of F3-CD cells in rat glioma model··· 56
Ⅳ. DISCUSSION ··· 62
Ⅴ. CONCLUSION ··· 69
REFERENCES ··· 70
v
LIST OF FIGURES
Fig.1. Gene expression profiling of secretory proteins over-expressed in brain tumor
tissues ··· 19
Fig.2. Comparison of genes encoding secretory proteins in three brain tumor samples 21 Fig.3. Real-time RT-PCR validation of differential expression of selected genes in 11 different human brain tumor tissues ··· 25
Fig.4. GBM tumors have high periostin expression. Periostin was hardly detected in normal brain ··· 27
Fig.5 Periostin significantly promote NSC migration ability compare with VEGF ··· 31
Fig.6 Periostin specifically orients migration of two human NSC lines ··· 33
Fig.7 Construction of periostin over expressing NIH3T3 cell line ··· 36
Fig.8. Ipsi-laterally transplanted NSCs have tropism for periostin overexpressing··· 38
Fig.9. Contra-laterally transplanted NSCs reached to p-NIH3T3 cell ··· 41
Fig.10. NSCs express integrin alpha V and beta 5···43
Fig.11. Activation of FAK and CDK5 signal pathway in NSC migration ···45
Fig.12. Periostin promoted NSC migration controlled by CDK5 signal pathway··· 48
Fig.13. Expression of CD gene and enzymatic activity of CD in F3 and F3-CD cells · 52 Fig.14. Suicide gene (cytosine deaminase) encoding NSCs induced neighborhood cell death ··· 53
Fig.15. In vivo bystander effect of F3-CD cells to p-NIH3T3 cell··· 54
vi
Fig.17. C6 rat glioma cell invasion was inhibited by systemic treated 5-FC with F3-CD
vii
LIST OF TABLES
Table.1. Three tumors samples used for microarray assays ··· 18
Table.2. Function of secretory proteins over-expressed in brain tumors ··· 20
viii
ABBREVIATION
5-FC : 5-fluorocytosine
5-FU : 5-fluorouracil
AKT : protein kinase B
CD : cytosine deaminase
CDK : cyclin dependent kinase
DCX : doublecortin
ERK : extracellular signal regulated kinase
FAK: focal adhesion kinase
GBM : gliobalstoma multiforme
hNSC : human neural stem cell
MTT : 3-(4,5-Dimethylthiazol-2-yl)-2,5-diphenyltetrazolium bromide
PAK1 : serine/threonine p21 activating kinase 1
PI3K : phosphoinoside 3-kinase
POSTN : periostin
1
Ⅰ
. INTRODUCTION
Stem cells are defined that divides to generate on daughter cell that is a stem cell and
another daughter cell that produces differentiated descendants (Weissman et al, 2001). It
termed as self renewal and differentiation. Self renewal can be defined as making a complete
phenotype of stem cells through symmetric division like mitosis and unlimitedly divided.
Most somatic cells cultured in vitro display a finite number of population doublings and this
can be contrasted with the seemingly unlimited proliferation capacity of stem cells in culture
(Schofield, 1983). Differentiation is defined by acquisition of cell type specific
morphological, phenotypic and functional features (Conley et al, 2004; Cryz et al, 2001,
Baksh et al, 2004). In process of development, fertilized egg divided to multiple cells and
became blastocyst that will be embryo consisted with multicellular organism. Differentiation
means that development of zygote. In this procedure, some cells have the potential to form
most or all type of specialized cells and this phenomenon called pluripotency (Mitalipov et al,
2009). Stem cells broadly consist with embryonic stem cell and adult stem cell. Embryonic
stem cells (ESCs) isolated from the inner cell mass of blastocyst and have self renewal and
pluripotency (Conley et al, 2004). Adult stem cells (ASCs) isolated from various adult
tissues and have self renewal ability (Clarke et al, 2000). Discriminated with ESCs, ASCs
have multipotency that differentiates into a number of cells, but only those of a closely
related family of cells. Neural stem cells (NSCs) are one of ASCs. NSCs have the capacity to
2
and oligodendrocyte) (Mckay et al, 1997). NSCs isolated from the striatal tissues including
the subventricular zone and hippocampus (Reynolds et al, 2005). In addition, NSCs have
migration ability to damaged tissues such ac Parkinson’s disease, stroke and spinal cord.
Many previous experiments reported that NSC migrates to abnormal tissues and recovery. In
Parkinson’s disease model, caused by selective doparminergic neuron cell death in substantia
nigra (SN), transplanted NSCs recovered MPTP induced neuronal cell death in SN region
(Imitora et al, 2004). In ischemic stroke model and spinal cord injury model, injected NSCs
moved to damage region and differentiated to brain component cells such as astrocyte or
oligodenrocyte (Keirstead et al, 2001). Additionally, NSC transplanted animals showed
behavior improvement and damaged tissues size reduction (Daadi et al, 2010; Teng et al,
2002). NSCs migration ability observed in animal brain tumor model. Transplantation of
NSC into the animal cerebral hemisphere contralateral to the hemisphere containing an
implanted glioma, lead to migration of those transplanted cells over long distance to the
tumor and infiltrating tumor cell. Gliomas rise by various origins included genomic
instability, oncogene expression, abnormal cell cycle regulation and unknown factors (Reuss
et al, 2009; Moor et al, 2009). Malignant tumors have very aggressive infiltration behavior to
near normal brain parenchyma and caused reduce patients survival period (Fine et al,1993;
Surawicz et al, 1998). Despite cancer therapeutic methods, surgery, chemotherapy,
radiotherapy, was improved, the results was not satisfied. Because of tumor surrounding
brain structure, effecting complete resection is difficult. So, necessitate the use of
radiochemotherapy for effective tumor control. The use of chemotherapy is limited by
3
radiotherapy is restricted by its own toxicity on normal brain tissue. Overcome to these
restriction, idea of using stem cell for cancer therapy as therapeutic reagents deliver with
stem cell tropism property for tumor was stared from Aboody et al that showed transplanted
neural stem cell into glioma bearing animals migrated to main tumor mass and invading
gliomacell into near normal parenchyma (Aboody et al, 2000). After this report, many
groups tried to find more efficient factor for cancer therapy using genetically modified gene
bearing stem cells, PEX (Kim et al, 2005), IFN-b(Ito et al, 2009), S-TRAIL (Menon et al, 2009) CD with 5FC (Shimato et al, 2007) which have cancer growth inhibit factor. Those
anticancer factors efficiently reduced tumor size in animal glioma model. Each gene
encoding NSCs transplanted to contralaterally glioma cell bearing animal models. Few days
later, transplanted NSCs present their anticancer effect and significantly reduced tumor size
with expanding animal life span. It is mean that NSC could be efficient deliver vehicle of
anticancer factors. Even though above trials have therapeutic effect in animal model, brain
tumor, stroke and various brain diseases (Aboody, 2008; Miljan, 2009; Nandoe, 2009; Salehi,
2009 Hwang, 2010), some is known about signal transduction mechanisms of NSC tropism.
Stromal cell derived factor-1(SDF-1)/CXCR4 and vascular endothelial growth factor
(VEGF)/ VEGFR systems were famous for stem cell migration induced factor (Bao, 2006;
Horvath, 2004). Increased NSC migration rate by SDF-1 or tumor cultured media compare
normal condition was reduced in SDF-1 monoclonal antibody or CXCR4 blocking antibody
treated condition (Imitola et al, 2004; Ehtesham et al, 2004). Different type of stem cell,
mesenchymal stem cells, has same result (Son et al, 2006). In VEGF treated condition, NSC
4
transplanted NSC to counterpart cortex migrated to VEFG infusion site (Schmidt et al, 2005).
Additionally, Neuroinflammation derived chemokines can role as NSC attract molecule. In
hippocampal slice culture, neural progenitor cells move from transplanted site to
inflammatory stimulus mediated inflammation site that increased the chemokines and
cytokines expression. Inflammation induced NSCs migration was inhibited by monocyte
chemoattractant protein-1 (MCP-1) neutralizing antibody (Belmadani et al, 2006). In
addition, HGF, TGF, PTN and PDGF induced NSC chemotactic migration (Heese et al,
2005).
Mentioned factors of above is activate intracellular signaling pathway integrate to each
receptor. Most broadly used factor is FAK, cytoplasmic kinase, which involved in
extracellular matrix and integrin mediating signaling pathway (Kornberg et al, 1998). FAK
signaling pathway have important role in tumor invasion through regulation of cell migration
(Meng et al, 2009). Actually, FAK kinase activation was upregulated in glioma cell line and
tissues. Activated FAK transmit signals through PI3K that promote phosphorylation of
downstream targets such as AKT in many kinds of glioma cells (Zheng et al, 2000). The
migration character of glioma cells and NSCs has similar behavior properties. Glioma
secreted various chemokines and growth factors that induce NSC tropism for glioma
microenvironment. VEGF, highly expressed in glioma and crucial role in angiogenesis for
tumor growth, bind to VEGFR that controlled FAK and PI3K activation. Both kinase
regulated cell migration through distinct pathway by promoting the dynamic regulation of
focal adhesion and actin structures (Giles, 2001). Some of reports elucidate that the
5
2006) play important role in stem cell migration (Kendall et al, 2008; Zheng et al, 2007).
Originally, neural migration critically controlled for positioning of neurons during brain
cortex development (Kawauchi et al, 2008). Process of neuronal migration was consisted
with neurite outgrowth and translocation of nucleus (Tasi et al, 2005). At the first, leading
process is extended to want direction followed nucleus and cell body are moved using
cytoplasmic dynein and microtubule rearrangement. In this procedure, specifically nucleus
translocation, DCX and Lis1 with Nudle1 was crucially play role for nucleus and
centrosomal coupling (Neithammer et al, 2000). These proteins disruptions lead to break of
microtubules bridging between centrosome and nucleus and controlled by CDK5 signaling
pathway. Abnormality of CDK5 and downstream targets is related with neurodegeneration.
This neuronal migration regulated the affect of chemoattractive and chemorepellent cues for
properly neurogenesis.
Endogenous NSCs in the adult brain, it is known that their self recovery activity for the
various injuries is inadequate or ineffective. Decreasing of proliferation ability, particularly
in the adult brain, may because of the limited number and restricted location of endogenous
NSC. NSCs expanded in vitro culture and transplanted into diverse damaged regions for
overcome those limitations such as inadequate number and regions. Exogenous NSC may be
inhibited in surviving or repair behavior by endogenous microenvironment. However, in
above experiments, expanded NSC in vitro was well survived and showed tropism for
damaged tissues when they introduced to abnormality having animals. Migrated NSC
present several therapeutic effect include improvement of behavior. For these good effective
6
with minimum number of NSCs. NSCs necessary critical controlled. However, the
information about NSC migration mechanism is little known and not clears.
Many previous reports said that tumor or damaged tissues derived factors regulate NSC
migration that could be used delivery vehicle or therapeutic factors through various signal
transduction mechanisms. However, there are not believable key molecules and mechanisms
that specialized cancer therapeutic strategy using optimized stem cells.
I hypothesize that commonly expressed molecules in different kind of tumors, especially
malignant tumors were existed. It could main key-molecule that induces NSC tropism for
tumor powerfully with unique signal transduction pathway. Beside, these molecules give
positive effect, suggest the direction and promote motility, to cancer curable gene carrying
NSC for antitumor function.
For investigate these ideas, I indentified tumor specific expressed gene using microarray
in three different tumors and confirmed existence of malignant tumor specific gene with real
time PCR in many kinds of tumors that classified as WHO grades. Because of most tumor
produced factors involved in NSC migration, identified gene tested chmoattractive ability to
NSCs. Whether this gene became key molecule in NSC tropism for tumor, it compared with
well known factor of NSC migration inducer using in vitro assay. Additionally,
chemoattractive property of this gene was double check in vivo condition. In tropism
procedure of NSC, whether the signaling pathway of glioma cell migration and neuronal
migration were activated, I checked. Finally, could identified gene increase stem cell based
cancer therapy, apply of anticancer gene encoding NSC with systemic treated prodrug, in
7
Ⅱ. Materials and Methods
1. Cell culture and establishment of stable cell lines
Rat glioma cells, C6, and human neural stem cells, F3 and mouse fibroblast cell line,
NIH3T3, were grown in Dulbecco’s modified Eagle’s medium (DMEM) with 10% fetal
bovine serum(FBS), 10ug/ml penicillin-streptomycin (Gibco, NY, USA) and incubated at
37oC in an incubator of 5% CO2/95% air.
2. In vitro migration
Cultured human neural stem cells were detached with 0.05% trypsin, washed in DMEM
medium, resuspended in DMEM medium, and 5 x 10⁴ cells seeded into the upper chambers
(Costar Transwell) in 200μl DMEM with 10%FBS. 1day later, The lower chamber was filled
with POSTN 20㎍/㎖or VEGF 20 ng/㎖ contained DMEM and the 10%FBS-DMEM
medium was used as a negative control. To measure protein inhibitor effect, the lower
chamber was filled with combined solution that composite with POSTN (R&D), VEGF,
20nM PD98059 and 20nM Roscovitine (Calbiochem). After 12h the insert was removed
from the transwell. Remained Cells in the upper chamber were scraped off with cotton wool
and stained with hematoxylin and count stained with eosin. And count number of directly
8
To investigated ERK and DCX affection to migrating cell, we performed transwell
membrane immunostain with ERK and DCX antibodies (Cell signaling technology. Danver,
MA). Membrane were washed with PBS and then blocked with 0.5% triton X-100 and 5%
bovine serum albumin (BSA) in phosphate buffered saline (PBS) for 30 min followed two
times washed with 0.5%BSA in PBS for 15min each. And membrane incubated with goat
polyclonal human DCX antibody at a 1:500 and rabbit polyclonal human ERK antibody at a
1:1000 dilution overnight at 4℃. Then membrane washed with PBS for 15min 2 times.
Subsequent membrane incubated with biotin conjugated anti-rabbit antibody for 1 hour at
room temperature followed wash 2times with PBS and complexes with avidin-biotin (Vector
laboratories, Burlingame, CA). Then 3 times washed with PBS and detected using a
diaminbenzidine peroxidase (DAB) kit (Vector laboratories, CA).
3. Collection of normal brain and brain tumor tissue
Patient tumor and normal brain samples were give from M.D. Cho in Ajou university
hospita. Specimens were snap soak in RNAlater and stored -70 oC until use. All of the
patients signed consent for collection and analysis of samples.
4. RNA isolation and application to Affymetrix GeneChip
Total RNA samples were prepared from 12 human brain tumors and 5 normal brains with
9
and hybridization of human U 133 Plus 2.0 GeneChip Oligo Microarrays (Affymdetrix,
Santa Clara, CA, USA) were performed in accordance with the manufacture instructions.
Gene expression data (CHP file of Affymetrix Microarray Suite 5.0 software) were
normalized to global target intensity.
5. Real-time quantitative RT–PCR
Total RNA (50ng) was used to generate cDNA using the Taqman Reverse Reagents
(Applied Biosystems, Foster City, CA, USA). Taqman Universal PCR Master Mix and
Taqman Gene Expression Assays, which contain the primers for candidate genes (CCL4,
CXCL10,CYR61, FN1, GLIPR1, GPX3, HLA-DQB1, POSTN, PROS1, SFRP4, TIMP1,
TIMP2, TNC, TNFRSF1A, TNFSF13B and GAPDH as internal control, Applied
Biosystems, Foster City, California), were performed for detecting RT–PCR products. The
PCR cycling conditions were performed for all of the samples, as follows: 2 min at 501C for
incubation; 10 min at 95 oC for AmpliTaq amplification and 40 cycles for the melting (95 oC
for 15sec) and annealing/extension (60 oC for 1 min) steps. PCR reactions for each template
were performed in triplicate in one 96-well dish per gene-specific primer pair tested. The
comparative CT method was used to quantification of the gene expression.
6. Western Blotting Analysis.
10
buffer (0.5% sodiumdeoxycholate, 0.1% sodiumdodecyl sulfate, 1% NP-40 and PBS) with
PMSF and proteases inhibitors. Protein concentration was determined by Bio-Rad DC assay
(Bio-Rad, Hercules, CA, USA). The samples were adjusted to equal protein concentrations,
30㎍ of each protein sample was separated on an SDS-PAGE gel. The protein samples were
transferred to immobilon-P membrane (Millipore Corporation, MA, USA). For protein
detection, the membrane was incubated in 5% skim milk in TBS-T for 30min at room
temperature followed washed three times with TBS-T for 5 min each. The membrane was
then incubated with ERK, pERK, DCX (1:1000 dilution, Cell signaling Technology), pDCX
(1:500 dilution, Cell signaling Technology), FAK, pFAK, PAK and pPAK (1:1000 dilution,
Epitomics) primary antibody in 5% BSA-TBS-T at 4 oC for overnight. The membrane was
then washed three times in TBS-T, 15 min each, and incubated with the secondary
anti-rabbit antibody, 1:2000 dilutions (Zymed, CA, USA) for 1 h at room temperature. The
membrane was washed three times in TBS-T, and antibody-bound protein was detected by
adding ECL Western Blotting Detection reagent (Amersham Pharmacia Biotechnology,
buckinghamahire, UK) for 1 min and exposing the membrane to Kodak X-ray film.
7. Reverse transcription - PCR
First-strand cDNA was generated by SuperscriptⅡ(Invitrogen, carlsbad, CA) and
12-18mer oligo dT with 2mg of total RNA that was isolated using TRIzol reagent (Invitrogen) in F3 neural stem cell. The reaction mixture was incubated at 42℃ for 50min followed by
11
containing 5ml 10X PCR buffer, 1.5mM MgCl2, 0.2mM deoxyribonucleoside-triphosphate, 50pmol primer and 1U of Tag DAN polymerase (Invirogen). The PCR conditions were as
follows: 25~30 cycles at 94℃ for 45 seconds, 55℃ for 45 seconds, 72℃ 45 seconds (CD:
60℃ for 60 seconds, 72℃ 90 seconds) and a final extension for 10minutes at 72℃. The
primer sequences for integrin genes were as follows: for human integrin alpha V, 5’-ACT
GGG AGC ACA AGG AGA ACC-3’ and 5’-CCG CTT AGT GAT GAG ATG GTC-3’; and
for human integrin beta1, 5’-CTG CAA GAA CGG GGT GAA TG-3’ and 5’-CAC AAT
GTC TAC CAA GCC C-3’; and for integrin beat 2, 5’-CAA GCT GGC TGA AAA CAA
CA-3’ and 5’-ACT GCT CCT GGA TGC ACT CT-3’; and for integrin beta3, 5’-AGA TGC
GAA AGC TCA CCA GT-3’ and 5’-CCG TCA TTA GGC TGG ACA AT-3’; and for
integrin beta4 5’-GCC TTC ACT TTG AGC ACT CC-3’ and 5’-CTG CTG TAC TCG CTT
TGC AG-3’; and for integrin beta5, 5’-AGC AGC TTC CAT GTC CTG AG-3’ and 5’-GAA
GTT GCT GGT GAG CTT CC-3’; and for integrin beta6, 5’-GAC TCC GGA AAC ATT
CTC CA-3’ and 5’ CTG ACA GTC GCA GTT GCA TT-3’; and for integrin beta 7, 5’-AGC
AAT GGC CTC TAC AGT CGC AGC-3’ and 5’-GCT TGG AGA GAA ACC CAG AAA
GTC-3’; and for integrin beta 8, TTC ATC ATT TTC ATA GTT ACA TTC-3’ and
CAT TAA GTG TTT AAA AAT CTT TTT-3’, and for cytosine diaminase (CD),
5’-GAGTCACCGCCAGCCACACCACGGC-3’ AND 5’-GTTTGTAATCGATGGCTTCT
GGCTGC-3’
12
Human brain tumor and normal brain tissues were fixed with ice-cold 4%
paraformaldehyde in 0.1M phosphate buffer. After 4hr, the tissue transfer to 30 % sucrose in
0.1 M phosphate buffer at 4°C for overnight. Then tissue were frozen with OCT compound and sectioned at 30mm on a cryostat. The slides were washed with PBS 3 times and blocked with 0.5% triton X-100 and 5% bovine serum albumin (BSA) in phosphate buffered saline
(PBS) for 30 minute. After then, slices washed with 0.5% BSA in PBS for 15min each
followed incubated with rabbit polyclonal human Periostin antibody (1:500, abcam,
Cambridge, UK) for overnight at 4℃. Slices were washed three times with PBS, 15 min
each, and incubated in the secondary anti rabbit antibody (1:1000 dilutions (Vector
laboratories, CA, USA) contained PBS for 1h at room temperature. After that, periostin was
detected with diaminbenzidine peroxidase (DAB) kit (Vector laboratories, CA) and
counterstained with hematoxylin.
9. Construct of Periostin overexpressing cell line
pCXbsr and pCL Ampho vector, kindly provide by Dr Inoue in Shiga university of
medical science of japan, were transfected to 293T cells using the lipofectamin and plus
agent according to the manufacture’s protocol (invitrogen, Carlsbad, CA). 2 days later,
blasticidin S 5g/ml (invitrogen, Japan) treated to transfected 293T cells for a week and
changed new media except for blasticidin S. 3 days after, cultured 293T cell media were
13
was added and selected for 1-2 week. Formed colonies were cultured to 96well plate as one
cell to one well and each cells used as periostin overexpressed cell lines (p-NIH3T3).
10. In vivo migration
Three micro-liter Hanks’ balanced salt solution (HBSS) or Dycycle green labeled
p-NIH3T3 cells (1x10⁶ cells) had stereotaxically injected into the right striatum. The
coordinates, anterior-posterior (AP) measured from bregma, lateral (ML) from the midline,
and depth (DV) from dura, were as follow (in ㎜): AP +0.4; ML -2.3; DV -4.5. Five day
after, each group was stereotaxically injected with DiI labeled 1x10⁶ NSCs into same
hemisphere cortex that coordinates, anterior-posterior (AP) measured from bregma, lateral
(ML) from the midline, and depth (DV) from dura, were as follow (in ㎜): AP +0.4; ML
-2.3; DV -2.0. Cells and HBSS injected at a rate of 0.2ul/min using 26-gauge Hamilton
syringe (Hamilton, Nevada, USA) attached to an automated microinjector (KD scientific
INC, MA, USA). After transplantation, the needle was left in place for an additional 15min
before being slowly retracted. 2-4weeks later, rats were sacrificed and collected rat brain
fixed with ice-cold 4 % paraformaldehyde in 0.1M phosphate buffer. After 4hr, brains sink
with 30 % sucrose in 0.1 M phosphate buffer at 4°C for overnight. Then brains frozen with OCT compound and sectioned at 30mm with cryostat. Slices were mounted with Vectashield® Hard Set™ mounting medium (Vector, CA, USA), and were observed with an
14
11. Analysis of CD enzyme activity
F3-CD Cells (2X10⁵ cells) were inoculated each well in 12-well plate and incubated for 48
hours with 1 mM 5-FC in 1ml medium. Incubated medium (50ml) was extracted with 500µl ethyl acetate:isopropanol:acetic acid (84:15:1 [v/v/v]), and the organic fraction was resuspended with 500µl H2O:methanol (4:1 [v/v]). HPLC carried out using a Kromasil
100-5C-18 column (Kromasil, Bohus, Sweden) and detected at UV 270nm. 5-FC and 5-FU were eluted isocratically at a flow rate of 1 ml/min with an isocratic mobile phase consisting of 40mM KH2PO4, adjusted to pH 7.0 with 10 % KOH. Retention times were 3.4 minutes for
5-FC, 3.9 minutes for 5-FU and 8.9 minutes for 5-bromouracil (Sigma), an internal standard. Quantification of 5-FC and 5-FU was normalized with 5-bromouracil.
Fifty micrograms proteins of cell lysates were incubated in the presence of 1mM 5-FC at
37℃ for 8 hours for enzyme activity. The mixtures were extracted and analyzed by HPLC as
described above.
12. In vitro bystander effect assay
To observe bystander effect of p-NIH3T3 cell by 5-FC treated F3-CD, Total 1x10⁴
p-NIH3T3 cells or mixed with F3.CD cells seeded in 96well plate (p-p-NIH3T3:F3.CD =
100:5~200). One day after, Culture medium was changed with 5-FC contained medium
(100ug/ml, Sigma) and incubated for 3 day. Each cell washed with PBS and added MTT
15
incubated for 1 hour. Each well supernatant collect and transfer to new 96 well plate and
measured with microplate spectrophotometer (Bio Tek instrument Inc) at 550nm and 630nm
as reference filter.
13. In vivo bystander efficacy
Dycycle green labeled p-NIH3T3 cells (0.5 - 2x10⁶ cells) mixed with C6 rat glioma cells
had stereotaxically injected into the rat right striatum. Five days after, each group was
injected with DiI labeled 1x10⁶ NSCs into left hemisphere cortex. After transplantation, the
needle was left in place for an additional 15min before being slowly retracted. Seven or ten
days later, Animals were injected with 5-FC (500mg/kg/day) through intraperitoneal
injection daily for 2 weeks. After that, animals sacrificed and collected rat brain fixed with
ice-cold 4 % paraformaldehyde in 0.1M phosphate buffer. After 4hr, brains sink with 30 %
sucrose in 0.1 M phosphate buffer at 4°C for overnight. Then brains frozen with OCT compound and sectioned at 30mm with cryostat. Slices were mounted with Gel mount (Biomeda corp, Foster city, CA). Tumor cells and size was measured using BMF stereo
investigator program (MicroBrightField inc, Williston, USA).
14. Statistical analysis
Results are expressed as mean ± SD. Student’s t-tests were performed to determine
16
Ⅲ
. RESULTS
1. Expression profiling of secreted genes from human brain tumor tissues
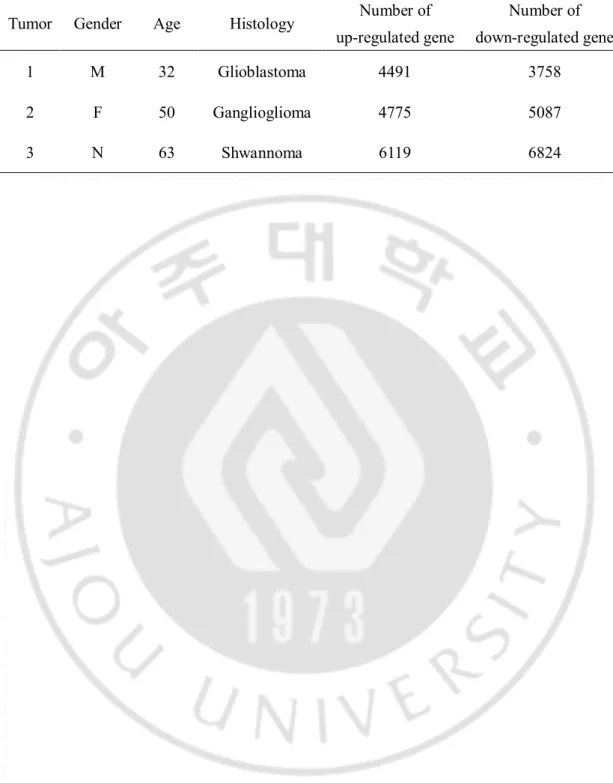
To search which genes were changed their expression pattern in human brain tumors, I
performed microarray analysis using 3 different brain tumor sample RNA. 4000~6000 genes
were over expressed in each tumor sample (Table. 1). Using microarray data, I analyzed
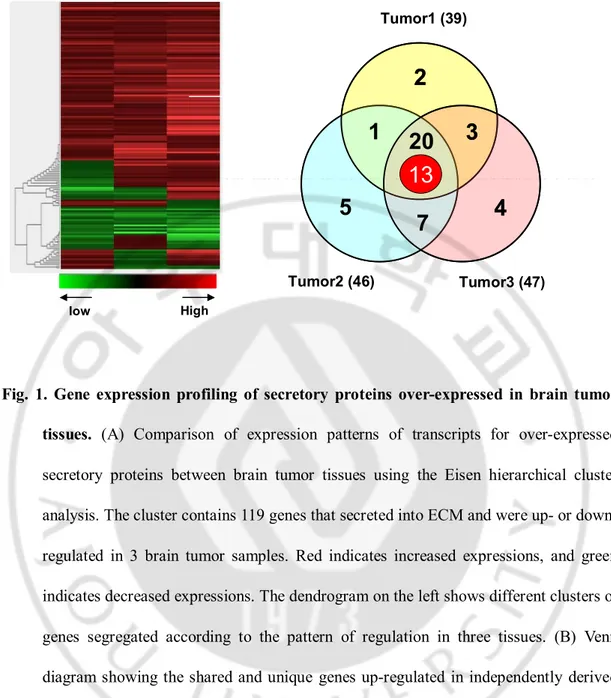
over-expressed or down-expressed 119 secrete or extracellular region located genes in each
tumor samples (Fig. 1A). Among of 119 genes, I choose secreted and up regulated gene and
except extracellular region or down regulated gene. This study focus on identify of
chemoattracters to stem migration. So, chemoattract molecules should be secreted to out of
membrane. In each tumor, I found 39, 46 and 47 genes that satisfy above conditions.
Specially, 33genes were commonly up regulated in all tumors and included 13 genes that
more than 2 fold up regulated (Fig. 1B).
I selected 12 commonly over expressed genes that expressed more than 2 fold compare
normal brain tissue and 2 genes assumed related with tumor formation and development.
Cysteine rich 61 (CYR61), GLI pathogenesis related 1 (GLIPR1), Fibronectin (FN1),
Periostin (POSTN) and Tenascin C (TNC) play a important role of tumor growth inducer
and angiogenesis inducing factor. Additionally, it promote tumor cell invasion from tumor
raised position to near normal tissues. Chemokine (C-X-C motif) ligand 10(CXCL10),
glutathione peroxidase 3 (GPX3), Major histocompatibility complex, class II, DQ beta 1
17 immune response by attract lymphocytes (Table. 2).
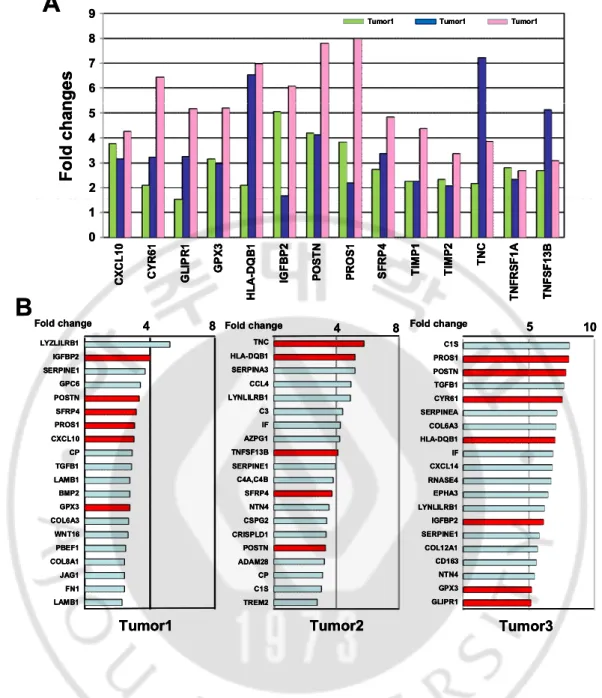
Selected 14 genes highly expressed in all tumors over 2 fold and many genes (5~7/14) were
ranked upper position of highly over-expressed 20 genes list in each tumor sample. It
assumed that chose genes were authentic date for use further in this study. Specially, POSTN
expressed in all tumors by more 4 folds and posited in all highly expressed 20 gene list of
each brain tumor (Fig. 2B). Microarray result showed that some of these genes participated
in antitumor action but many genes acted to help tumor growth and invasion. Specially,
periostin expressed intensely in all tumors and play role cancer cell infiltration and
18
Table 1. Three tumors samples used for microarray assays
Tumor Gender Age Histology Number of up-regulated gene Number of down-regulated gene 1 M 32 Glioblastoma 4491 3758 2 F 50 Ganglioglioma 4775 5087 3 N 63 Shwannoma 6119 6824
19 Tumor1 Tumor2 Tumor3
low High A B Tumor1 (39) Tumor2 (46) Tumor3 (47)
1
4
5
3
7
2
20
13
1
4
5
3
7
2
20
13
Fig. 1. Gene expression profiling of secretory proteins over-expressed in brain tumor tissues. (A) Comparison of expression patterns of transcripts for over-expressed
secretory proteins between brain tumor tissues using the Eisen hierarchical cluster
analysis. The cluster contains 119 genes that secreted into ECM and were up- or
down-regulated in 3 brain tumor samples. Red indicates increased expressions, and green
indicates decreased expressions. The dendrogram on the left shows different clusters of
genes segregated according to the pattern of regulation in three tissues. (B) Venn
diagram showing the shared and unique genes up-regulated in independently derived
human brain tumors. 33 genes are commonly over-expressed in three tumors and 13
20
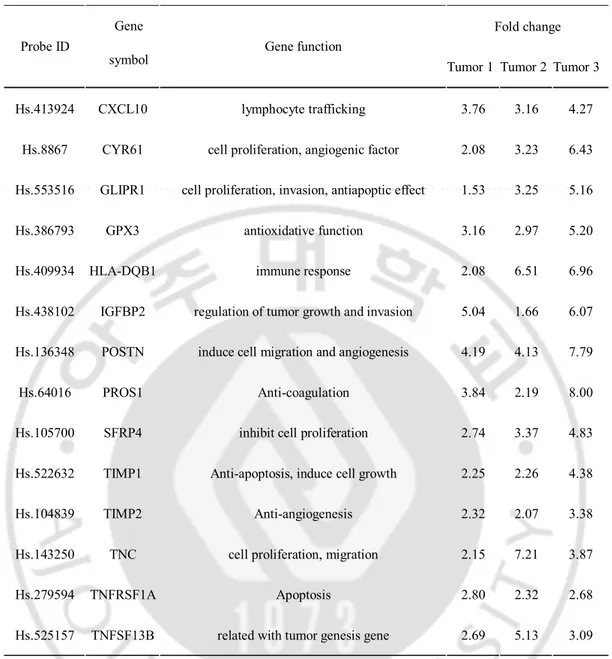
Table 2. Function of secretory proteins over-expressed in brain tumors
Fold change Probe ID
Gene
symbol Gene function Tumor 1 Tumor 2 Tumor 3
Hs.413924 CXCL10 lymphocyte trafficking 3.76 3.16 4.27 Hs.8867 CYR61 cell proliferation, angiogenic factor 2.08 3.23 6.43 Hs.553516 GLIPR1 cell proliferation, invasion, antiapoptic effect 1.53 3.25 5.16 Hs.386793 GPX3 antioxidative function 3.16 2.97 5.20
Hs.409934 HLA-DQB1 immune response 2.08 6.51 6.96
Hs.438102 IGFBP2 regulation of tumor growth and invasion 5.04 1.66 6.07 Hs.136348 POSTN induce cell migration and angiogenesis 4.19 4.13 7.79
Hs.64016 PROS1 Anti-coagulation 3.84 2.19 8.00
Hs.105700 SFRP4 inhibit cell proliferation 2.74 3.37 4.83 Hs.522632 TIMP1 Anti-apoptosis, induce cell growth 2.25 2.26 4.38
Hs.104839 TIMP2 Anti-angiogenesis 2.32 2.07 3.38
Hs.143250 TNC cell proliferation, migration 2.15 7.21 3.87
Hs.279594 TNFRSF1A Apoptosis 2.80 2.32 2.68
Hs.525157 TNFSF13B related with tumor genesis gene 2.69 5.13 3.09
Probe ID is used gene name in microarray assay that indicated unique each gene. Fold
change appeared that selected genes expression level in each tumor compare normal tissues
21
B
Fold change 4 8 LAMB1 FN1 JAG1 COL8A1 PBEF1 WNT16 GPX3 BMP2 LAMB1 TGFB1 CP CXCL10 PROS1 SFRP4 POSTN GPC6 SERPINE1 IGFBP2 LYZLILRB1 COL6A3 Tumor1 4 8 Fold change TREM2 C1S CP POSTN CRISPLD1 CSPG2 NTN4 SFRP4 C4A,C4B SERPINE1 TNFSF13B AZPG1 IF C3 LYNLILRB1 CCL4 SERPINA3 HLA-DQB1 TNC ADAM28 Tumor2 5 10 Fold change GLIPR1 GPX3 NTN4 COL12A1 SERPINE1 IGFBP2 LYNLILRB1 EPHA3 RNASE4 CXCL14 IF HLA-DQB1 COL6A3 SERPINEA CYR61 TGFB1 POSTN PROS1 C1S CD163 Tumor3B
Fold change 4 8 LAMB1 FN1 JAG1 COL8A1 PBEF1 WNT16 GPX3 BMP2 LAMB1 TGFB1 CP CXCL10 PROS1 SFRP4 POSTN GPC6 SERPINE1 IGFBP2 LYZLILRB1 COL6A3 Tumor1 Fold change 4 8 LAMB1 FN1 JAG1 COL8A1 PBEF1 WNT16 GPX3 BMP2 LAMB1 TGFB1 CP CXCL10 PROS1 SFRP4 POSTN GPC6 SERPINE1 IGFBP2 LYZLILRB1 COL6A3 Tumor1 4 8 Fold change TREM2 C1S CP POSTN CRISPLD1 CSPG2 NTN4 SFRP4 C4A,C4B SERPINE1 TNFSF13B AZPG1 IF C3 LYNLILRB1 CCL4 SERPINA3 HLA-DQB1 TNC ADAM28 Tumor2 4 8 Fold change TREM2 C1S CP POSTN CRISPLD1 CSPG2 NTN4 SFRP4 C4A,C4B SERPINE1 TNFSF13B AZPG1 IF C3 LYNLILRB1 CCL4 SERPINA3 HLA-DQB1 TNC ADAM28 Tumor2 5 10 Fold change GLIPR1 GPX3 NTN4 COL12A1 SERPINE1 IGFBP2 LYNLILRB1 EPHA3 RNASE4 CXCL14 IF HLA-DQB1 COL6A3 SERPINEA CYR61 TGFB1 POSTN PROS1 C1S CD163 Tumor3 5 10 Fold change GLIPR1 GPX3 NTN4 COL12A1 SERPINE1 IGFBP2 LYNLILRB1 EPHA3 RNASE4 CXCL14 IF HLA-DQB1 COL6A3 SERPINEA CYR61 TGFB1 POSTN PROS1 C1S CD163 Tumor3A
1 F o ld c h an g e s C X C L 10 C Y R 61 G L IP R 1 G P X 3 H L A -D Q B 1 IG F B P 2 P O S T N P R O S 1 S F R P 4 T IM P 1 T IM P 2 T N C T N F R S F 1 A T N F S F 13 B 9 2 8 7 6 5 4 3 0 Tumor1 Tumor1 Tumor1A
1 F o ld c h an g e s C X C L 10 C Y R 61 G L IP R 1 G P X 3 H L A -D Q B 1 IG F B P 2 P O S T N P R O S 1 S F R P 4 T IM P 1 T IM P 2 T N C T N F R S F 1 A T N F S F 13 B 9 2 8 7 6 5 4 3 0 Tumor1 Tumor1 Tumor1 1 F o ld c h an g e s C X C L 10 C Y R 61 G L IP R 1 G P X 3 H L A -D Q B 1 IG F B P 2 P O S T N P R O S 1 S F R P 4 T IM P 1 T IM P 2 T N C T N F R S F 1 A T N F S F 13 B C X C L 10 C Y R 61 G L IP R 1 G P X 3 H L A -D Q B 1 IG F B P 2 P O S T N P R O S 1 S F R P 4 T IM P 1 T IM P 2 T N C T N F R S F 1 A T N F S F 13 B 9 2 8 7 6 5 4 3 0 Tumor1 Tumor1 Tumor1Fig. 2. Comparison of genes encoding secretory proteins in three brain tumor samples.
(A) Expression pattern of the 14 shared genes up-regulated more than 2-fold in all
brain tumors as designated in Venn diagram of Fig. 1. (B) Genes exhibiting the
22
genes over-expressed in all tumors over 2-fold. All genes or ESTs were identified as
being statistically significant by the SAM algorithm. For all tumors, the false
23
2. Differential expression of 14 Candidate genes in several human brain tumor tissues
From microarray date, we selected 14 candidates that secreted from each tumor commonly
and related to tumor metastasis, growth and cell migration. To confirm the candidate genes
expression pattern, I examined real time PCR in 11 different kinds of tumor that classified
benign and malignant tumors (Table. 3). Those candidates showed very various expression
patterns. Most genes –CXCL10, FN1, GLIPR1, GPX3, PROS1, SFRP4, TIMP1, TIMP2,
TNFRSF1A, TNFSF13B - were commonly over-expressed in each tumor. Those genes may
play same role in most tumors that indistinct tumor group. TNC appeared any tumor specific
expression pattern. However, POSTN was showed very different expression pattern. It was
highly expressed in malignant tumors but not in benign tumors. It could be participated in
malignant tumor development mainly (Fig. 3). Additionally, POSTN gene expression manner
in real time PCR data matched with microarray data that presented commonly
over-expressed in 3 different brain tumors. Those tumors have malignancy character. This result
support that periostin could important factor in tumor development especially malignant
tumor. Its discrimination with other genes was important to choose candidate for malignant
24
Table. 3. Information of tumors used in real-time PCR assays
Sample Gender Age Histology
Tumor1 F 59 adenoma
Tumor2 F 56 adenoma
Tumor3 F 36 Choroid plexus papilloma
Tumor4 M 36 meningotheliomatous meningioma
Tumor5 F 48 meningioma
Tumor6 M 45 Fibroblastic meningioma
Tumor7 F 46 Fibroblastic meningioma
Tumor8 F 56 meningioma
Tumor9 M 63 schwannoma
Tumor10 M 45 Anaplastic oligodendroglioma
25 2 4 6 8 CX CL1 0 CY R61 GLI PR 1 GP X3 HLA -DQ B1 IGFB P2 PO STN PR OS 1 SFR P4 TIM P1 TIM P2 TN C TN FR SF1 A TN FSF1 3B 10 0 - 2 - 4 - 6 - 8 F o ld C h an g e i n E xp re s si o n ( 2 -Δ Δ C t) 2 4 6 8 CX CL1 0 CY R61 GLI PR 1 GP X3 HLA -DQ B1 IGFB P2 PO STN PR OS 1 SFR P4 TIM P1 TIM P2 TN C TN FR SF1 A TN FSF1 3B 10 0 - 2 - 4 - 6 - 8 F o ld C h an g e i n E xp re s si o n ( 2 -Δ Δ C t)
Fig. 3. Real-time RT-PCR validation of differential expression of selected genes in 11 different human brain tumor tissues. Expression of 14 genes was analyzed by
real-time RT-PCR, and fold changes in expression are expressed as the ratio of
GAPDH-normalized brain tumor tissue/normal brain tissue values. Asterisk indicates the
26
3. Periostin more intensely expressed human brain tumor tissues than normal brain
Periostin usually expressed in osteoblast cells and found to be overexpressed in various
types of human cancer, such as non-small-cell lung carcinoma, breastcancer, colon cancer,
head and neck cancer, ovarian cancer, and pancreatic ductal adenocarcinoma. Whether brain
tissues expressed periostin in protein level, i carried out immunohistochemistry with
periostin antibody in normal or tumor tissues. In normal brain tissues, periostin was very
weakly expressed compare tumor tissues intensely expressed (Fig. 4 C-E). Periostin was
expressed broadly in entire tumor tissues but not all tumor cells expressed it. Furthermore,
periostin expression manner was changed followed tumor. Low grade tumor (meningioma)
rarely expressed periostin but high grade malignancy tumors (Astrocytoma and
Glioblastoma) significantly expressed it (Fig. 4F). It expression pattern in tumor tissues
supported by real time PCR result that periostin highly expressed mainly malignant tumor. It
means that periostin could be important candidate for malignant tumor specific cancer
27
Normal
Tumor
B
C
C’
F
F’
D
D’
E
E’
A
A’
B’
28
Fig. 4. GBM tumors have high periostin expression. Periostin was hardly detected in normal brain. Human brain tumor (C-F) and normal brain tissues (A and B) were
fixed with 4% paraformaldehyde followed sectioned at 30mm on a cryostat. In each slices, periostin was detected using DAB staining method with periostin antibody
(1:500). Slices of normal brain (A-B) or low grade tumor (F) presented rarely
expressed periostin. However, Periostin intensely expressed only malignant tumors
29
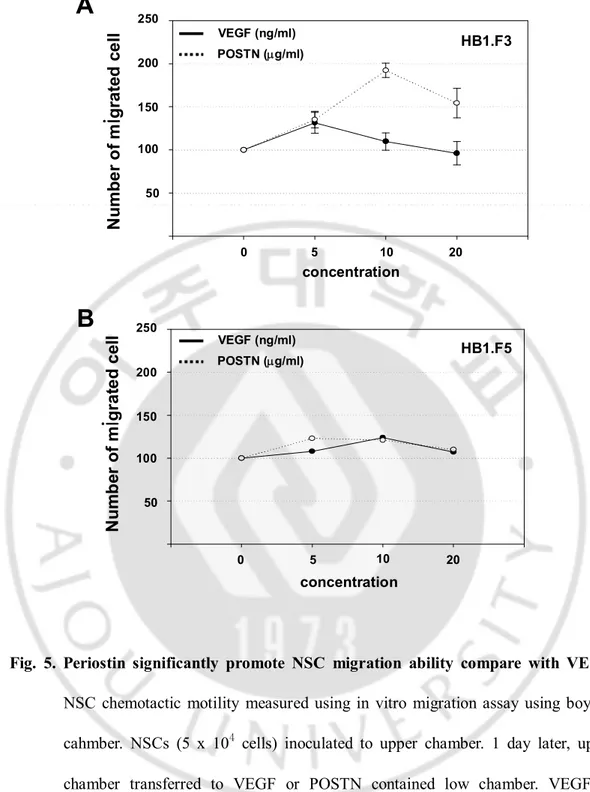
4. Periostin strongly attracted neural stem cell than VEGF
Whether periostin attract human neural stem cell, i checked migrated NSCs number with
boyden chamber assay. Cultured NSCs in transwell upper chambers transferred to periostin
treated lower chamber. 12 hours after, we counted migrated NSCs that passed boyden
chamber membrane from upper position of membrane to periostin contained low chamber.
NSCs motility was promoted by periostin dose dependently about 3 times than periostin no
treated condition. Also, periostin induced NSC attraction effect was picked at 10ug/ml
periostin concentration but higher concentration decreased its effect. (Fig. 5A spot line)
To confirm stem cell attraction capacity by periostin, i compared periostin to VEGF
which used as positive control. VEGF was highly expressed factor in cancer and have
angiogenesis ability. Besides, it was well known as cell attract molecule. Various stem cell
lines controlled by VEGF in migration procedure. VEGF induced NSC migration about 50%
compare VEGF no treated condition but periostin induced about 100%. Periostin has 2 times
NSC attraction ability than VEGF (Fig. 5A). Compared two factor results indicated that NSC
migration ability was strongly increased in periostin treated condition compare VEGF treated
it. Additionally, i experiment cell type motility discrimination between HB1.F3 and HB1.F5
that has strong tropism for tumor. In VEGF treated same condition, both cell lines showed
same migration rate in dose dependent manner. However, they showed difference of stem
cell attraction ability in comparison with VEGF and periostin. When both factors were
treated for same time, HB1.F3 cells migration ability was increased 92% by periostin and
VEGF increased 26%. Its discrimination rate is about 3 times. Even HB1.F5 has no
30
stem cell attraction molecule than others and very unique to HB1.F3.
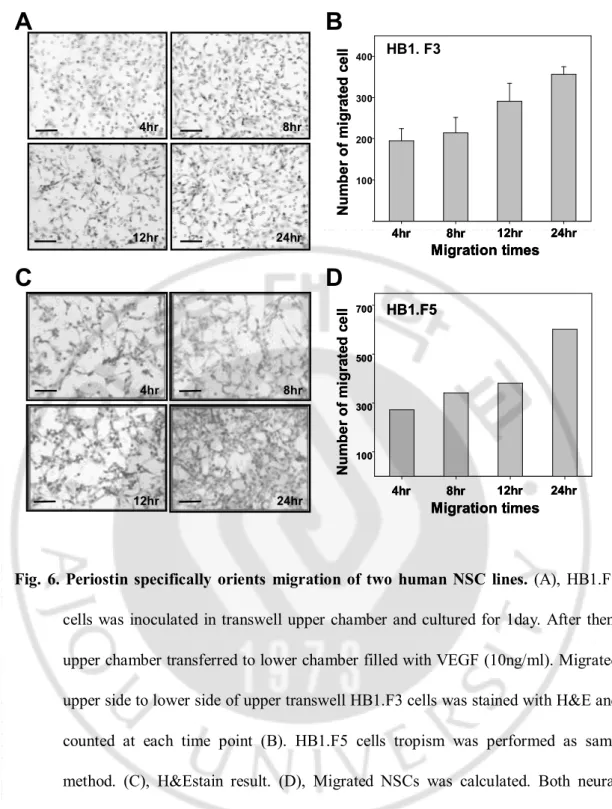
And i checked that NSC motility about periostin treated time. NSCs were cultured in
transwell upper chambers for 12hr followed transferred to periostin contained lower chamber.
In each time point (4-24hours), i counted migrated NSCs from upper chamber to periostin
contained low chamber. The number of migrated NSC was increased as time passes in
periostin treated condition (Fig. 6 A and B). Periostin treated 12 hour after, the number of
migrated NSC was noticeably increased and continued 24 hour time point. To confirm that
cell migration pattern by different cell type, i used two types of NSC (HB1.F3 and HB1.F5)
(Fig 6 C and D). Both cell lines showed not difference in cell migration by periostin. In
summary, periostin promote NSC migration as time and concentration dependent manner
31 50 100 150 200 250 50 100 150 200 250 0 5 10 20 0 5 10 20 N u m b er o f m
i
g ra te d c el l N u m b e r o f mi
g ra te d c e ll VEGF (ng/ml) POSTN (mg/ml) HB1.F3 VEGF (ng/ml) POSTN (mg/ml) HB1.F5 concentration concentrationA
B
Fig. 5. Periostin significantly promote NSC migration ability compare with VEGF.
NSC chemotactic motility measured using in vitro migration assay using boyden
cahmber. NSCs (5 x 10⁴
cells) inoculated to upper chamber. 1 day later, upper
chamber transferred to VEGF or POSTN contained low chamber. VEGF or
32
cells (B) as concentration rising pattern. 12 hours after, migrated NSCs were
stained with hematoxylin and counted. Black continues line indicated VEGF
induced NSC migration level and spot line indicated POSTN that. POSTN
promoted migration of F3 cells 3 times higher potency. However, F5 cells showed
33
A
B
HB1. F3 200 300 400 N u m b e r o f m ig ra te d c e ll 4hr 8hr 12hr 24hr Migration times 100 HB1. F3 200 300 400 N u m b e r o f m ig ra te d c e ll 4hr 8hr 12hr 24hr Migration times 4hr 8hr 12hr 24hr Migration times 100 12hr 24hr 8hr 4hrC
D
HB1.F5 N u m b e r o f m ig ra te d c e ll 4hr 8hr 12hr 24hr Migration times 300 500 700 100 HB1.F5 N u m b e r o f m ig ra te d c e ll 4hr 8hr 12hr 24hr Migration times 4hr 8hr 12hr 24hr Migration times 300 500 700 100 12hr 24hr 8hr 4hrFig. 6. Periostin specifically orients migration of two human NSC lines. (A), HB1.F3
cells was inoculated in transwell upper chamber and cultured for 1day. After then,
upper chamber transferred to lower chamber filled with VEGF (10ng/ml). Migrated
upper side to lower side of upper transwell HB1.F3 cells was stained with H&E and
counted at each time point (B). HB1.F5 cells tropism was performed as same
method. (C), H&Estain result. (D), Migrated NSCs was calculated. Both neural
stem cell lines showed same migration pattern that NSC migration capacity was
34
5. Neural stem cell has motility to Periostin expressing NIH3T3 in vivo condition
To check NSC migration activation by periostin in vivo condition, i constructed periostin
over expressing NIH3T3 cell line (p-NIH3T3) using retroviral vector system (Fig. 7 A and
B). Periostin gene and amphotropic envelop gene encoding were confirmed with enzymatic
gene restriction assay. Periostin gene transduce cells were selected by blastidine S contained
medium culture for 2 week. We confirmed periostin expression and release to culture
medium with ELISA method and western blotting (Fig. 7 C and D). The p-NIH3T3 cell line
(1-8) that most intensely expressed a periostin than others was chose for further studies.
Whether NSC has tropism for periostin over expressing NIH3T3 cells, i transplanted
p-NIH3T3 cells to rat right hemisphere and followed NSC transplantation to same rat
hemisphere cortex on 5 day. 2~4 weeks after, we removed rat brain and observed NSC
tropism for NIH3T3 cells in vivo condition. NSC migrated from transplanted site to
p-NIH3T3 injected position passed corpus callosum and infiltrated to p-p-NIH3T3 cell. It looks
like that p-NIH3T3 cells were raped by NSCs (Fig. 8 A and B). Indeed, many NSC cells
reached and posited near the p-NIH3T3 cells in injected original site (Fig. 8 C and D). This
situation was not raised in NIH3T3 cell transplanted environment. NSC migrated with any
direction or located in original transplanted site.
NSC mobile routes were similar to each cell inject needle track. In procedure of each cell
were injection, needle could madden tunnel in brain tissues that may be used by NSC for
their efficiency. Additionally, i observed that p-NIH3T3 expression was discontinued for
long time using immunohistochemistry assay with periostin antibody in the experiment of
35
and periostin discontinuously expression, i performed modified in vivo model experiment
that P-NIH3T3 cells were injected to right hemisphere and NSCs were transplanted to left
hemisphere cortex. 1~2 weeks later, rat brains were removed and observed. Like to NSC
migration pattern in ipsi-lateral transplantation condition, NSC chased to P-NIH3T3 cell
followed corpus callosum route that connect construct of right and left hemisphere and
attained original P-NIH3T3 injection site and near site of it (Fig 9.). Also, periostin
continuously expressed (Fig. 9 D and I).
These results suggest that periostin induced NSC tropism powerfully and give some cue
36
293T cell
pCXbsr (2455 bp) pCL-Ampho (4070bp)
1Kb DNA EcoR1 Sal1 EcoR1
Sal1 100 bp 1Kb DNA Cla1 Sal1 Cla1 Sal1 100 bp 3 Kb 10 Kb 2 Kb 3 Kb 10 Kb 2 Kb A B NIH3T3 cell 1-20 1-16 2-2 1-12 1-8 1-24 WB : POSTN 50 100 150 200 250 P O S T N le ve l in c u lt u re m e d iu m (% ) C D
37
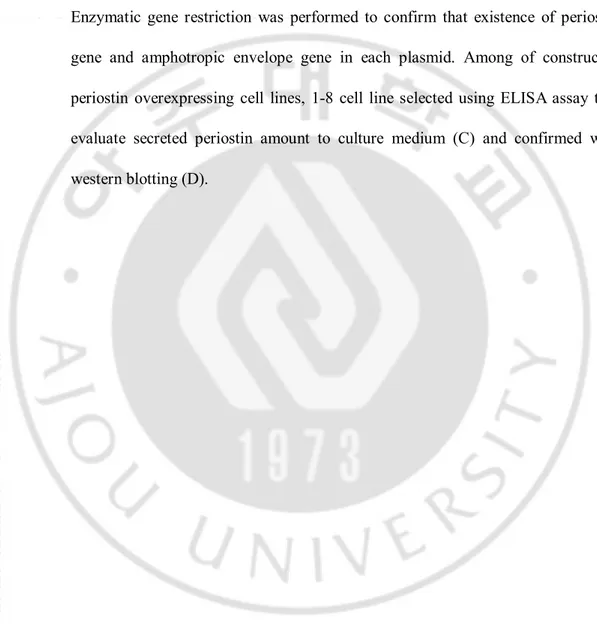
Fig. 7. Construction of periostin over expressing NIH3T3 cell line. 293T cell transfected
with periostin gene encoding pCXbsr vector, containing the blastcidine S resistant
gene, and pCL-Ampho vector which expresses an amphotropic envelope.
Transfection two days after, the culture medium collected and incubated with
NIH3T3 cells. After then, cells were selected with blasticidin S (5 mg/ml). (A, B), Enzymatic gene restriction was performed to confirm that existence of periostin
gene and amphotropic envelope gene in each plasmid. Among of constructed
periostin overexpressing cell lines, 1-8 cell line selected using ELISA assay that
evaluate secreted periostin amount to culture medium (C) and confirmed with
38
F3
POSTN
POSTN--NIH3T3NIH3T3
F3
POSTN
POSTN--NIH3T3NIH3T3
F3
POSTN
POSTN--NIH3T3NIH3T3
2 week 4 week
A
B C
D E
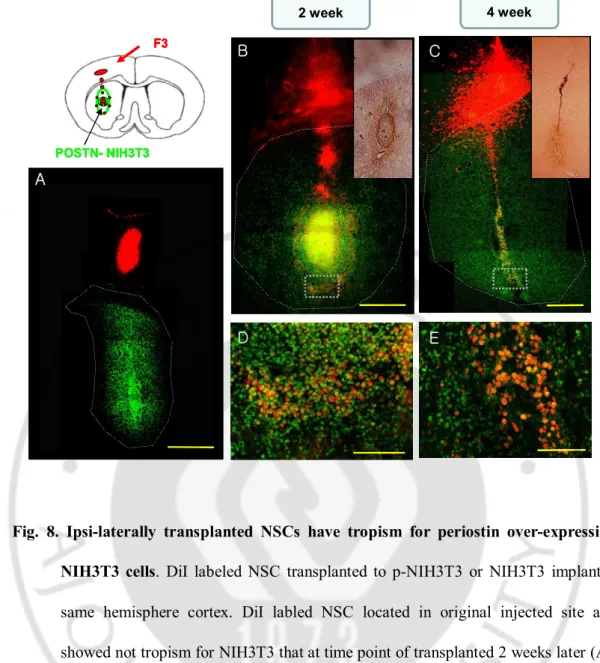
Fig. 8. Ipsi-laterally transplanted NSCs have tropism for periostin over-expressing NIH3T3 cells. DiI labeled NSC transplanted to p-NIH3T3 or NIH3T3 implanted
same hemisphere cortex. DiI labled NSC located in original injected site and
showed not tropism for NIH3T3 that at time point of transplanted 2 weeks later (A).
However, NSC migrated through corpus callosum and reached Vybrant Dyecycle
Green labeled p-NIH3T3 (B) that continuously expressed periostin (small box in
Fig. B). NSC transplanted 2 weeks later, NSCs distributed entire p-NIH3T3 cells
which spread from implanted position to near striatum tissues and intermixed with
39
have motility to p-NIH3T3 (C) and constantly maintained (E). In addition, periostin
expressed continuously (small box in Fig. C). Coronal section diagram of rat brain
40 F3 POSTN- NIH3T3 F3 POSTN- NIH3T3
2 week
1 week
A B D F G I J H E C41
Fig. 9. Contra-laterally transplanted NSCs reached to p-NIH3T3 cell. NSC was labeled
with DiI and injected contra-laterally to p-NIH3T3 cell implanted rat hemisphere
cortex. Even both cells have long distance between that, DiI labeled NSC moved
follow corpus callosum (C) and surrounded p-NIH3T3 cells (A, B). For 2 weeks after
NSC cell injection, NSCs traveled to p-NIH3T3 cells which located far from NSC
injected site and infiltrated themes (F, G) through corpus callosum route (H).
Periostin expression in vivo was confirmed using immunohistochemistry with DAB
(D and I) or DAPI (E and J). Periostin continuously expressed in p-NIH3T3
implanted 1 or 2 weeks passed time point. Red: DiI labeled NSCs, Green: Dyecycle
labeled p-NIH3T3 cells, Rat coronal brain section diagram showed NSCs migration
route and injected site or p-NIH3T3 cell implanted site. Scale bar : (A,F), 1000mm; (B-C, G-H), 50mm; (E, J), 200mm.
42
6. Periostin Receptor expression in neural stem cell lines
Periostin bind to diverse integrin complex that composited with integrin alpha subunits and
beta subunits. Integrin alphaV and beta3, alphaV and beta5 and alpha6 and beta4 complexes
were known as periostin receptor that related with cell migration. In cell migration, Integrin
avb3 and avb5 were mainly used and a6b4 used in some cell type. We investigated that existence of integrin subunits in HB1.F3 NSC using reverse transcription-PCR and
Microarray. In Microarray results, i observed that integrin alpha V subunit and beta1 and 5
subunit were highly expressed but not beta 3 and 4 (Fig. 10A). RT-PCR results showed same
result in HB1.F3 NSCs (Fig. 10B). Through above results, i assume that integrin aVb5 complexes could use in NSC migration instead of aVb3 complex or a6b4.
43 b1 a1 a2 a11 a10 a9 a4 a7 a6 aE a5 b4 a3 b2 b8 b6 aV a8 b3 b5 aM aX aL aD b7 a11b I-domain RGD biding domain laminin biding domain b5 PP AKTAKT AKT AKT PP FAK FAKPP POSTN POSTN PP FAK FAKPP POSTN POSTN POSTN POSTN
Microarray
RT-PCR
0 5000 10000 15000 20000 25000 30000 aV b1 b2 b3 b4 b5 b6 b7 b8 GAP b1 b2 b3 b4 b5 b6 b7 b8 aVFig. 10. NSCs express integrin alpha V and beta 5. RNA was collected from HB1.F3
NSCs using Trisol method and analyzes with Microarray. Reverse transcription
PCR experiments were conducted in HB1.F3 using individual integrin subunit
44
7. FAK and CDK5 signal pathway was included in the neural stem cell migration
We observed that periostin promoted stem cell migration arise from FAK activation that
integrated integrin complex. FAK signaling pathway well known as cell motility related
signal pathway. FAK signal pathway connected with many kinases in its downstream and
convey signal. In cell migration, PI3K / AKT signal pathway was mainly used that located in
FAK downstream. So, i checked activation of many kinases included in FAK downstream
signal pathway. To research kinase activation, Cell lysates were collected from periostin
treated NSCs as time increasing manner in ranging from periostin non treated condition to
12hr treated and detected with phosphorylate form kinase antibody.
At first, i observed FAK activation level that first trigger of signal transduction from
ligand (periostin) to inside of cell. Western blot results showed that FAK intensely activated
at periostin treat 30 minutes after time point. AKT and mTOR were activated followed FAK
at periostin treat 1 hour time point. Subsequently, i researched CDK5 activation that
controlled by mTOR and well known regulator of Nudel1 and PAK1. Both proteins control
cytoskeleton component arrangement. Western blotting result showed that CDK5 activation
appeared on periostin treated one hour later and maintained until periostin treat 12 hours
time point. Coincidently, PAK1 activation started at 1hr time point and continued 6hr.
Nudel1 also activated at PAK1 activation decreased time point and continued 12 hours as
more activated pattern. After all, periostin induced stem cell migration signal was madden
with FAK signal pathway that conveyed to AKT signaling and CDK5 downstream signal