1 KEEI Research Report 17-06
A Study of the Economic Impact of Energy Tax Reform Reflecting Externality
Taeheon Kim
2
Research Staff
Head Researcher: Research Fellow Taeheon Kim
Research Associate: Postdoctoral Researcher Simgeon Choi
3 ABSTRACT
1. Research Purpose
Although taxes are levied on bituminous coal for power generation, the current energy taxes fail to adequately incorporate social costs, including environmental pollution and climate change, and the criteria of taxation by energy source are inconsistent, leading to distortions in supply and demand in the environment and energy industries. In theory, energy prices that apply external costs appropriately are considered acceptable, but there are some concerns regarding price hikes caused by energy tax reform. It is therefore necessary to take external costs incurred through the use of energy into consideration when coming up with ways to change energy policies with the aim of minimizing economic losses. In this regard, the following study seeks ways of revising energy tax policies to mitigate the impact of changes in economic conditions while also improving air quality, reducing greenhouse gas emissions, and stabilizing the supply and demand of energy. Furthermore, the study carefully examines the impacts of energy tax system reforms on the GDP and industrial competitiveness and suggests policy directions.
2. Major Content
In this study, scenarios where chosen in which the relative sizes of bituminous coal are overhauled based on LNG as a means of reforming the tax policy for fuels. First, an increase in the tax on fuels for power generation leads to an increase in electricity bills. In consideration of prices and industrial competitiveness, it is crucial that the relative rates between the two energy sources be revised. Second, in the power generation sector, the tradable emission permit system is being implemented to reduce greenhouse gas emissions. Therefore, tax levels for fuels should be subject to direct regulation and the tradable emission permit system, among others. The proper level of environmental tax does not necessarily need to be that of a Pigovian tax.
According to the estimation of environmental losses incurred due to the use of fuels for power generation, the external cost per kilogram of bituminous coal is approximately 80% that of LNG. Scenarios 1 and 2 thus set the tax on bituminous coal at about 80% that of LNG, based on individual consumption tax and individual consumption tax + income contribution, respectively. Scenarios 3 and 4 use the estimates from which carbon monoxide has been excluded from the environmental degradation costs of fuels for power generation. These two
4
scenarios therefore set the tax imposed on bituminous coal at around 88% that of LNG, based on individual consumption tax and individual consumption tax + income contribution, respectively.
The experiments that were conducted produced some significant findings. First, it was found that a tax hike on bituminous coal causes the GDP to decrease, but prices to increase. As the tax on bituminous coal increases, the GDP declines further while costs increase. Scenario 1, which imposes an additional KRW 17 per kilogram on the individual consumption tax levied on bituminous coal, sees the GDP fall by 0.08%; whereas in Scenario 4, which imposes an additional KRW 44 per kilogram on the individual consumption tax levied on bituminous coal, the GDP appears to decline by 0.21%. This shows that Scenario 4 seems to place an enormous economic burden on the power generation sector.
Second, the revision of the tax on bituminous coal for power generation is related to the tradable emission permit system and reduction of greenhouse gas emissions. The declining demand for electricity due to the tax hike on bituminous coal for power generation serves to reduce the consumption of fuels for power generation, resulting in lower greenhouse gas emissions. Concerning the reduction of greenhouse gases, Scenarios 1 and 4 achieved reductions of 1.3% and 3.3%, respectively, demonstrating that tax reforms for bituminous coal for power generation can reduce air pollutants and cut greenhouse gas emissions. As observed in Scenario 1, the minimum increase in the tax on bituminous coal can reduce a country’s total greenhouse gas emissions by around 1%. The revision of the tax on bituminous coal for power generation is therefore expected to reduce greenhouse gas emissions in conjunction with the tradable emission permit system.
Third, the impact of tax reforms on industrial activities does not seem remarkable. As shown by the changes in the production volume of industries in tandem with the increase in tax on bituminous coal for power generation, production volume appears to decline in all sectors. However, excluding the energy industry, changes in industrial production capacity are estimated to be less than 0.5%, showing no significant impact on industrial activities as a whole.
Fourth, the tax hike on bituminous coal is anticipated to promote the efficiency of the energy industry by internalizing external costs. Also, increasing the tax on bituminous coal for power generation may decrease demand for coal and electricity. According to Scenario 4, demand for coal and electricity could fall by 5.1% and 2.5%, respectively. The diminishing demand for electricity may lead to reductions in demand for fuels for power generation and LNG. Therefore, the tax increase is expected to internalize the external costs of bituminous coal and increase the effectiveness of resource allocation, thus preventing excessive investment in the energy industry.
All in all, energy tax reforms in the power generation sector raise the effectiveness of resource allocation, improve air quality, and reduce greenhouse gas emissions. Furthermore, revenues generated through the revision
5
can be used to build eco-friendly facilities and increase energy welfare. As a result, investment in environmental services and infrastructure is expected to decline significantly. The revision will also help to increase economic efficiency and drive environmental improvements.
3. Policy Implications
The following proposals are made with respect to energy tax reforms: first, the investment plan for bituminous coal-fired power plants is of the greatest importance when it comes to energy tax reforms for power generation.
Air pollutant emissions vary significantly depending on the performance of environmental facilities at power plants. As described in Chapter 3, the amount of air pollutants emitted by emission source differs considerably.
The tax levels regarding fuels for power generation are determined per unit of contaminant emitted by power plants; thus, the appropriate levels of taxes levied on fuels change according to the capacities of power plants to install and operate eco-friendly facilities. In addition, the Korean government, as part of its measures to address the issue of fine dust, announced a plan to shut down aging coal-fired power plants and invest in eco-friendly facilities. Therefore, when setting the standard of assessment for bituminous coal-fired power generation, that plan should be taken into consideration. Furthermore, a tax refund needs to be considered in relation to the installation of eco-friendly facilities by bituminous coal-fired power plants.
Second, it is vital to implement a range of policies, including direct regulations on air pollution and major accident risk factors. Considering the policies that affect pollutant emissions, such as the tradable emission permit system, policy on investments in bituminous coal-fired plants, and restrictions on diesel cars, an appropriate tax level should be determined.
Third, it may be a good idea to set up an “external cost appraisal committee” in relation to reforming the taxes imposed on fuels for power generation. External costs may serve as a basis for determining appropriate taxes on energy sources. As external costs can differ depending on assumptions and estimation methods, it is important to organize the committee in such a way as to ensure its objectivity and transparency.
Fourth, it is desirable to use revenues generated from energy tax reforms to supply renewable energy or build eco-friendly infrastructure. The primary purpose of environmental tax reforms (ETRs) in European countries is to improve the environment through energy taxes and correct the distortions in the economic structure caused by the existing tax structure. In this way, these countries aim to promote financial efficiency by reducing income taxes and consolidate political power through tax reforms based on neutrality. In Korea’s case, however, the purposes of energy tax reform were to remedy the distorted supply and demand of energy and improve air quality.
6
In this sense, it seems reasonable for the Korean government to supply renewable energy and build eco-friendly facilities using energy tax revenue instead of considering tax-neutral reform plans. However, it is imperative to secure transparency and efficiency in fiscal spending regarding the supply of renewable energy.
7 Table of Contents
Chapter 1. Introduction ···13
1. Purpose of research and background ···13
2. Literature review ···14
Chapter 2. Status and Weakness of the Current Energy Tax System ···16
1. Status of the current energy tax system ···16
2. Energy prices and supply and demand ···19
3. Energy tax system and international comparison of energy prices ···22
Chapter 3. Estimation of the Social Costs of Fuels Used for Power Generation ···27
1. Appropriate taxes on fuels used for power generation ···27
2. Estimation of the environmental costs of power generation fuels ···29
A. Energy consumption for power generation ···29
B. Emissions of pollutants by the power generation sector ···33
C. Emissions of pollutants per unit of power generation fuel ···36
D. Air pollution cost per power generation fuel ···41
Chapter 4. Tax Reform for Energy for Power Generation ···45
1. Analytic model ···45
2. Analysis of tax reform scenarios for power generation fuels ···50
A. Establishment of tax reform scenarios ···50
B. Simulation results ···52
1) Changes in major economic indicators and carbon dioxide emissions ···53
2) Impact on industrial production and prices ···54
3) Impact on energy supply and demand ···56
C. Summary of simulation results ···57
3. Considerations for energy tax reform ···60
A. Investment in environmental control facilities for coal-fired generators ···60
8
B. Greenhouse gas emissions trading system ···68 Chapter 5. Conclusion ···71 References ···74
9 List of Tables
Table 2-1. Energy Tax System and Surcharges in Korea···16
Table 2-2. Grounds for the Local Resources and Facilities Tax Levied on Energy Sources ···18
Table 2-3. Energy Consumption Trends (2000-2015) ···19
Table 2-4. Major Economic and Energy Consumption Indices···20
Table 2-5. Rate of Electricity Price Increases by Period ···21
Table 2-6. Contribution to Total Energy Consumption Growth by Energy Source ···22
Table 2-7. Absolute and Relative Electricity Prices in OECD Countries (as of 2016) ···23
Table 3-1. Electricity Generation by Energy Source ···29
Table 3-2. Fuel Consumption by Energy Source Used for Power Generation ···31
Table 3-3. 2014 Air Pollutants by Source of Emissions ···33
Table 3-4. 2014 Air Pollutant Emissions by Power Generation Fuel (Emission Coefficients) ···41
Table 3-5. Economic Value of Environmental Damage According to AEA (2005) ···41
Table 3-6. Economic Damage per Unit of Air Pollutant ···42
Table 3-7. Calculation of Damages of LNG for Power Generation ···43
Table 3-8. Calculation of Damages of Bituminous Coal for Power Generation···43
Table 4-1. Classification of Products ···45
Table 4-2. Structure of the Household Sector Used in This Model ···47
Table 4-3. Structure of the Production Sector Used in This Model ···49
Table 4-4. Damage Costs per Unit of Air Pollutant ···52
Table 4-5. Changes in Major Economic Indicators and CO2 emissions ···53
Table 4-6. Percent Increase in Electricity Prices by Scenario ···54
Table 4-7. Changes in Energy Demand by Scenario ···56
Table 4-8. Bituminous Coal-Fired Thermal Plants by Region ···60
Table 4-9. Investment Plan for Coal-fired Power Plants by Year ···67
Table 4-10. Plan to Close Down Old Coal-fired Power Plants ···68
10
Table 4-11. Dual Emissions Trading and Carbon Tax Systems in Major Countries ···69
11 List of Figures
Figure 2-1. Relative Price of Electricity vs. Low-sulfur Heavy Oil for Industrial Use ···24
Figure 2-2. Relative Price of Electricity vs. Light Crude Oil Price for Household Use ···24
Figure 2-3. Average Effective Energy Tax for Electricity Generation ···25
Figure 2-4. Average Effective Energy Tax on CO2 from Energy Production ···25
Figure 3-1. Principles for Imposing Energy Taxes ···27
Figure 3-2. Electricity Generation by Energy Source ···30
Figure 3-3. Fuel Use for Power Generation ···32
Figure 3-4. PM10 Emissions in the Power Generation Sector ···34
Figure 3-5. NOx Emissions in the Power Generation Sector ···35
Figure 3-6. Sox Emissions in the Power Generation Sector ···35
Figure 3-7. PM10 Emissions by Electricity Generation Fuel ···36
Figure 3-8. PM10 Emissions per Unit of Fuel ···37
Figure 3-9. NOx Emissions per Unit of Electricity Generation ···38
Figure 3-10. NOx Emissions per Unit of Fuel Consumption ···39
Figure 3-11. SOx Emissions per Unit of Electricity Generation ···40
Figure 3-12. SOx Emissions per Unit of Fuel Consumption ···40
Figure 3-13. Calculation of Damages of LNG for Power Generation ···43
Figure 3-14. Calculation of Damage of Bituminous Coal for Power Generation ···44
Figure 4-1. Structure of the Household Sector Used in This Model ···48
Figure 4-2. Structure of the Production Sector Used in this Model ···50
Figure 4-3. Changes in Major Economic Indicators ···53
Figure 4-4. Changes in Production by Industry ···55
Figure 4-5. Changes in Product Pricing ···55
Figure 4-6. Changes in Energy Demand by Scenario ···57
Figure 4-7. Possible Effects of Energy Tax Reform ···59
12
Figure 4-8. PM10 Emissions from Bituminous Coal-fired Power Generation Plants by Region in 2014··64 Figure 4-9. NOx Emissions from Bituminous Coal-fired Power Generation Plants by Region in 2014 ···64 Figure 4-10. SOx Emissions from Bituminous Coal-fired Power Generation Plants by Region in 2014 ··65 Figure 4-11. Air Pollutant Emissions per Unit of Bituminous Coal-fired Electricity Generation by Region in 2014 ···66
13
Chapter 1. Introduction
1. Purpose of research and background
The demand for electricity in Korea has grown rapidly in tandem with the country’s economic growth. This rapid rise of electricity demands has led to the large-scale expansion of nuclear power and thermal power generation facilities. Along with the great increase in fuels used by thermal power plants, there has also been a sharp increase in air pollutants and greenhouse gas emissions. Recently, air pollutants such as particulate matter (PM) have emerged as social issues, prompting many to call for reductions to meet the target level of greenhouse gas emissions set by the Paris Agreement.
Low electricity prices and economic growth in Korea are major factors that have contributed to increased power demands nationwide. Electricity prices have remained low due to governmental policies aimed at maintaining stable power prices and inadequate taxes levied on fuels used for power generation. In order to address the issue of the nation’s increased power consumption, the government adopted measures to restructure the relative price of energy. In 2013, the government raised electricity prices, and in 2014, began to impose a tax on bituminous coal used for power generation. However, despite the introduction of this tax on coal, the current tax system still does not properly reflect the external costs associated with power generation, such as environmental pollution and climate change. Furthermore, there is no consistency between the taxes on different types of fuels, meaning that current taxes do not adequately contribute to the protection of the environment and efficiency in energy supply and demand.
Theoretically, energy prices should reflect external costs, but there are always concerns about the potential negative effects of energy price hikes associated with tax reform. As such, it is necessary to adopt an energy tax reform plan that considers the external costs of energy use, but also minimizes any negative economic impact.
Proposed energy tax reforms must be calculated by estimating external costs and be accompanied by an analysis of all possible economic repercussions.
The most important issues in terms of Korea’s energy supply and demand are the stabilization of electricity demands and the securing of a safe, clean energy supply system through the implementation of the government’s energy transmission policy. This research aims to devise a plan for the energy tax system that improves air quality, reduces greenhouse gas emissions, stabilizes energy supply and demand, and minimizes any negative economic impact. The potential economic impact of proposed energy tax reforms will also be analyzed to propose policy
14 implications.
This research is comprised of the following chapters. After the completion of Chapter 1 (the introductory chapter), Chapter 2 provides an overview of the status and issues of Korea’s energy tax system. Chapter 3 estimates the social costs of various fuels used for power generation, provides a theoretical review of tax levels appropriate for each power generation fuel, and estimates the environmental costs of each fuel used for power generation. Chapter 4, through the use of analytical models, explores different tax reform scenarios and proposes various energy tax reform plans. Chapter 5 is the conclusion of this research.
2. Literature review
In their research, Gwangsu Park and Taeheon Kim (2012)1 analyzed Korea’s energy price system, identified system weaknesses, and proposed means of improvement. They also reviewed the government’s Regulations on Network Energy Prices, pointed out problems with the current energy tax system of Korea, and compared Korea’s energy tax system with those of other countries. They then used these analyses to develop scenarios for energy tax reforms and, using a CGE model, analyzed the impact of each scenario on energy supply and demand, greenhouse gas emissions, and the economy. The scenarios can be summarized as calling for: the imposition of taxes on electricity, the imposition of taxes on coal used for power generation, and the imposition of a carbon tax.
In a separate study, Taeheon Kim (2012)2 presented ways to effectively introduce a carbon tax under the existing energy tax system. He analyzed other countries that had introduced a carbon tax and estimated the impact of a similar tax reform on Korea’s energy supply and demand. Using a CGE model, Kim analyzed the double- dividend effect of his proposed revenue-neutral carbon tax and the impact such a tax would have on the existing energy tax system. He also examined the impact of a carbon tax and eco-friendly tax reform on the reduction of carbon emissions, energy supply and demand, and the national economy.
Seonghun Hong, Seonghun Kang, and Gyeongseon Hur (2014)3 likewise considered energy tax reforms, but instead examined the introduction of a revenue-neutral tax on coal used for power generation and nuclear power.
1 Gwang-su Park and Taeheon Kim. (2012). “A study of the establishment of a market-friendly energy pricing system.” Korea Energy Economics Institute.
2 Taeheon Kim (2012). “A study of the impact on the cost of introducing a carbon tax in the energy tax system.” Korea Energy Economics Institute.
3 Seonghun Hong, Seonghun Kang, and Gyeongseon Hur. (2014). “Economic effect of adjustments of the energy tax system and public services price system.” Korea Institute of Public Finance.
15
In their study, Hong, Kang, and Hur explored the possibility of introducing a coal tax based on caloric value and CO2 emissions, and used the Caloric Standards Index to determine the appropriate tax rate for nuclear power.
Seonghun Kang, Donggyu Lee, and Jongmin Yu (2015)4 analyzed the use of an environmental tax as a policy measure for meeting greenhouse gas emissions targets and to reflect the social costs of greenhouse gas emissions on energy prices. Using the existing energy tax system and emissions trading system as a reference, they analyzed how environmental tax can work effectively in conjunction with existing tax system and emissions trading system to reduce greenhouse gas emissions and derived policy implications. By using a theoretical model the researchers were able to estimate the appropriate price of emissions trading system (ETS) allowances to reach greenhouse gas emission targets. The research team also explored ways of increasing the compatibility between proposed environmental taxes and the existing emissions trading system by comparing current price of ETS allowances with the appropriate price.
Although Gwangsu Park and Taeheon Kim (2012) and Seonghun Hong, Seonghun Kang, and Gyeongseon Hur (2014) presented ways to levy taxes on bituminous coal used for power generation, they did not consider the environmental costs of air pollutants and greenhouse gas emissions. This study aims to fill this gap in existing research by estimating the environmental costs associated with the use of power generation fuels and, through the use of a CGE model, analyzes the impact of tax hikes on bituminous coal on the nation’s GDP, consumer price index, industrial production, energy supply and demand, and greenhouse gas emissions. Taeheon Kim (2012) presented ways of introducing a carbon tax under the existing energy tax system, using a CGE model. However, this study proposes an energy tax reform that reflects the social costs of power generation, while still minimizing negative economic impact. Seonghun Kang, Donggyu Lee, and Jongmin Yu (2015)5 proposed ways of introducing a new environmental tax within the existing emissions trading system by considering the social costs of greenhouse gas emissions associated with energy use. However, this paper estimates the social costs of both air pollutants and greenhouse gas emissions associated with power generation fuels and considers these factors when developing and proposing energy tax reforms. Using a CGE model, this study analyzes the economic impact of each proposed energy tax reform.
4 Seonghun Kang, Donggyu Lee, and Jongmin Yu (2015). “Ways of harmonizing the emissions trading system and environmental tax.” Korea Institute of Public Finance.
5 Seonghun Kang, Donggyu Lee, and Jongmin Yu (2015). “Ways of harmonizing the emissions trading system and environmental tax” Korea Institute of Public Finance.
16
Chapter 2. Status and Weaknesses of the Current Energy Tax System
1. Status of the current energy tax system
Table 2-1 illustrates the current status of Korea’s energy taxes and surcharges as of October 2017. In Korea’s energy tax system, energy taxes are heavily concentrated on energy for transport. Taxes that are currently levied on gasoline and diesel (used for transportation) include relatively higher traffic, energy, and environment tax, education tax, and local driving tax. Individual consumption taxes and education taxes are levied on butane used for LPG vehicles, and a petroleum import sales surtax is imposed on all types of petroleum.
Another main characteristic of the current energy tax system is that taxes do not properly reflect the external costs of energy use. Energy taxes must incorporate the external costs associated with energy such as environmental pollution and climate change that results from energy use. At the present time, taxes on power generation do not properly reflect externality, leading to lower electricity prices and higher electricity demands.
In response to inadequate energy taxes and distorted electricity prices, along with the resulting skyrocketing of electricity demands, the government established the Second National Energy Basic Plan. This legislation seeks, in part, to correct distorted electricity prices by distinguishing between energy for electricity production and energy for other uses, and makes provisions for the levying of taxes on bituminous coal. An amendment (No.
12157) to the Individual Consumption Tax Act levying taxes on bituminous coal for power generation was drafted on January 1, 2014 and took effect on July 1, 2014. Under this amendment, bituminous coal used for power generation is subject to a basic tax of KRW 24/kg, with subsequent tax increases based on caloric value.
Table 2-1. Energy Tax System and Surcharges in Korea
Type Unit Tariff
Individual consumption
tax
Traffic, energy, environment
tax Education tax
Local driving
tax
VAT
Surcharges
Basic rate (flexible
rate)
Basic rate (flexible
rate)
Import sales surcharge
Safety management
surcharge
Gasoline ℓ 3% 475
(529) 79.35 137.54 10% of product price
16
-
Diesel ℓ 3% 340
(375) 56.25 97.50 -
17
Kerosene ℓ 3% 90
(63) - 9.45 - -
Heavy oil ℓ 3% 17
(17) - 2.55 - -
Propane Kg 3% 20
(14) - - - - -
Butane Kg 3% 252
(275) - 41.25 - 62.28 4.5
LNG Kg 3% 60
(42) - - - 24.2 3.9/m3
Anthracite Kg exempt
- - - -
Bituminous
coal1) Kg 30 - - - - -
Note: Levied only on bituminous coal used for power generation, with a basic tax rate of KRW 30 for 5,000 kcal/kg–5,500 kcal/kg, KRW 33 for 5,500 kcal/kg or higher, and KRW 27 for less than 5,000kcal/kg (based on the net caloric value, as of April 1, 2017).
Source: Taxation Overview (2016), Ministry of Economy and Finance; Ministry of Economy and Finance, Notice No. 2016-217, Opinet (www.opinet.co.kr). Accessed on October 1, 2017.
With regard to the individual consumption tax for bituminous coal used for power generation, both the basic rate and flexible, caloric-dependent rate were raised in April 2017.6 Following this increase, based on net caloric value, basic rates of KRW 30/kg for 5,000 kcal/kg–5,500 kcal/kg, KRW 33/kg for over 5,500 kcal/kg, and KRW 27/kg for less than 5,000 kcal/kg were applied.7 Bituminous coal used for the Integrated Gasification Combined Cycle (IGCC) project was exempt.
Despite the introduction of a tax on bituminous coal, taxes levied on power generation fuels still failed to fully reflect externality, and there was no consistency between the taxes on different energy sources. Even after tax raises in 2017, taxes for bituminous coal were lower than those for LNG in terms of caloric value, leading to distortions in resources allocation.8 According to Energy Caloric Conversion Standards, the caloric value of LNG is 13,040 kcal/kg, and caloric value of bituminous coal is 6,160 kcal/kg.9 Given that the individual consumption tax for LNG is KRW 60/kg and the import surcharge is KRW 24.2/kg, the individual consumption tax for
6 Refer to Notice No. 2016-217 of the Ministry of Economy and Finance (Dec 29, 2016).
7 The Individual Consumption Tax Act was revised on December 19, 2017 in consideration to the impact of bituminous coal- fire power generation on the environment. Under the new act, effective as of April 2018, the basic individual consumption tax rate for bituminous coal rose from KRW 30/kg to KRW 36/kg. In terms of net caloric value, for 5,000 kcal/kg–5,500 kcal/kg, the basic tax rate was raised to KRW 36/kg. For 5,500 kcal/kg, the flexible tax rate was raised to KRW 39/kg, and KRW 33/kg for less than 5,000 kcal/kg.
8 Taeheon Kim (2016). “A comparative analysis of the relative prices of energy in major countries.” p.11.
9 Article 5 (1) [see attached] of the Enforcement Rule of the Energy Act.
18
bituminous coal should be increased to KRW 40/kg in order to be at a level similar to LNG in terms of caloric value.10 Considering that bituminous coal emits more air pollutants than LNG for the same caloric value, the tax currently levied on bituminous coal is very low.
Meanwhile, the individual consumption tax levied on heavy oil, used mainly for industrial fuel, is far less than that of LNG and other fuels. For the same caloric value, heavy oil generates more pollutants and greenhouse gas emissions than LNG. Given these important facts and figures, it can be concluded that the current energy tax system of Korea does not properly reflect external costs, resulting in a distortion of the allocation of resources.
In addition to national taxes, energy resources are also subject to local taxes such as the local resources and facility tax. According to Article 141 of the Local Tax Act, the local resources and facility tax is levied in order to secure the financial resources necessary to protect and develop local resources, such as underground and marine resources, tourism resources, water resources, and special geographical features. This tax is also used to operate safety management projects (such as firefighting activities and the prevention of specific disasters that threaten the region), support projects for the environmental protection/improvement and balanced development of the region, and cover any expenses incurred by the area’s firefighting facilities, waste disposal facilities, irrigation facilities, and other public facilities. For nuclear power generation, the local resources and facility tax is KRW 1/kWh, and for thermal power generation, the tax is KRW 0.3/ 1kWh.11 Nuclear power generation was added to the taxable objects section of the Local Tax Act when it was amended in 2005 in order to compensate residents around nuclear power plants for their economic loss; this amendment went into effect in 2006. Thermal power generation was added to the taxation list when the Local Tax Act was revised in March 2011, and this amendment went into effect in 2014.12 In the case of thermal power, the local resources and facility tax seeks to raise funds to promote the balanced development of neighborhoods around thermal power plants, and 65% of the tax revenue goes directly to the cities and counties in which thermal power plants are located. Grounds for the taxation of nuclear power and thermal power plants as being subject to the local resources and facility tax are as follows.
Table 2-2. Grounds for the Local Resources and Facilities Tax Levied on Energy Sources Items for
taxation Grounds for taxation Purpose
10 Taeheon Kim (2016). “A comparative analysis of the relative prices of energy in major countries.” p.12.
11 Article 146 of the Local Tax Act (Tax Bases and Tax Rates).
12 Sangha Lee and Jinha Kim (2012). “Ways to expand taxable targets subject to local resources and facility tax.” p. 10.
19 Nuclear
power generation
•Surcharge levied on the contributor of the high-risk externality of being exposed to nuclear materials in a certain area
•Compensation for hindering local development (limited ability to develop areas surrounding nuclear power plants)
‘Polluter pays’
principle:
surcharge to compensate for
hindering local development
Thermal power generation
•Surcharge levied on the contributor of the impact (i.e. the party responsible for air pollutants emitted from thermal power plants in residential areas)
•Provision of funds for the recovery of residential environments located near thermal plants.
‘Polluter pays’
principle:
surcharge to
fund the
environmental restoration of affected
residential areas Source: Sanghun Song and Minjeong Ryu (2011). “Ways of improving the local resources and facility tax,” p. 10.
The local resources and facility tax as a local tax is based on external costs as the individual consumption tax, a national tax, is levied due to external costs. Hence, an appropriate tax level for power generation fuels should be determined based on external costs, and national and local taxes should be determined at a level commensurate with the stated grounds for taxation.
2. Energy prices and supply and demand
The nation’s economic growth has been led by industries that consume large amounts of energy, and energy consumption continues to rapidly increase. Demands for raw materials in the steel and petrochemicals industries and electricity generation account for most of the total energy demand nationwide.
Table 2-3. Energy Consumption Trends (2000-2015)
(Unit: million TOE)
2000 2005 2010 2015 Annual
growth (%) Petroleum 100.3
(52.0)
101.5 (44.4)
104.3 (39.5)
109.6
(38.1) 0.6 - Oil for non-
energy use
31.9 (16.5)
38.6 (16.9)
47.0 (19.2)
55.3
(19.2) 3.7
20
Coal 42.9
(22.2)
54.8 (24.0)
77.1 (29.7)
85.5
(29.7) 4.7
LNG 18.9
(9.8)
30.6 (13.4)
43.0 (15.2)
43.6
(15.2) 5.7 Nuclear power 27.2
(14.1)
36.7 (16.1)
31.9 (12.1)
34.8
(12.1) 1.6 Primary energy 192.9
(100.0)
228.6 (100.0)
263.8 (100.0)
287.5
(100.0) 2.7
Electricity 20.6 28.6 37.3 41.6 4.8
Note: ( ) indicates the percentage (%).
Source: Prepared by the author in reference to the 2016 Yearbook of Energy Statistics.
Low electricity prices are the main reason behind the sharp increase in electricity demand, leading to significant increases in the demand for bituminous coal and LNG as power generation fuels. From 2000 to 2015, electricity demand showed an average annual growth of 4.8%, nearly twice the average annual growth of primary energy consumption (2.7%) over the same period. The annual growth rates of coal and LNG demands were also high at 4.7% and 5.7%, respectively, meaning that the percentages of coal and LNG in the primary energy rate rose significantly.
Since 2000, increases in electricity prices13 in Korea have been very low compared to the price increases of other energy sources. The lower price of electricity relative to other forms of energy14 has led to an increased demand for electricity that far surpasses the growth rate of the national economy (refer to Table 2-4). And conversely, when the price of electricity for industrial use rose sharply in 2008, the rapid increase in the demand of electricity slowed significantly.
Table 2-4. Major Economic and Energy Consumption Indices
Category 2000 2005 2010 2015
Annual growth rate (%) 2000–
2005
2005–
2010
2010–
2015 GDP (trillion KRW) 821 1,034 1,265 1,464 4.73 4.11 2.96
Total energy
(million TOE) 192.9 228.6 263.8 287.5 3.46 2.90 1.73 Electricity 239.5 332.4 434.2 483.7 6.77 5.49 2.18
13 Please refer to Table 2-5.
14 Please refer to Figure 2-1 and Figure 2-2.
21 consumption (TWh)
GDP elasticity of energy consumption
1)
0.73 0.71 0.58 GDP elasticity of
electricity consumption 2)
1.43 1.33 0.74
Notes: 1) Annual growth rate of total energy consumption ÷ annual growth of the economy
2) Annual growth rate of electricity consumption ÷ annual growth of the economy
Source: Prepared by the author based on Monthly Energy Statistics (November, 2016).
Table 2-5. Rate of Electricity Price Increases by Period
(Unit: %) Period Total Households General Education Industry
2000–2005 5.2 0.1 0.1 -15.4 11.2
2005–2010 14.7 2.0 2.2 18.3 28.2
2010–2013 26.0 9.7 26.0 18.4 33.0
2000–2013 52.1 12.0 29.0 18.6 89.6
Source: Prepared by the author using data posted on the website of KEPCO http://cyber.kepco.co.kr/ckepco/front/jsp/CY/H/C/CYHCHP00105.jsp, (accessed on October 30, 2017).
From 2000 to 2008, coal and LNG used for power generation accounted for 35.1% and 18.7%, respectively, of Korea’s total energy consumption growth, meaning that thermal power generation fuels were largely responsible for the growth of total energy consumption (Table 2-6). Naphtha, a raw material used in the petrochemicals industry, accounted for 22.4% of total energy consumption growth, second only to fuels used for power generation.
From 2008 to 2011, coal and LNG for power generation contributed to 28.6% and 15.1%, respectively, of total energy consumption growth. When adding the contributions of hydropower and nuclear power (3.7%) and renewable energy (0.9%), fuels for power generation accounted for nearly half (47.6%) of total energy consumption growth. Coal for making steel and naphtha for petrochemicals accounted for 16.0% and 15.6%, respectively, (36.6% total) of total energy consumption growth, second only to fuels used for power generation.
From 2011 to 2015, the growth of the nation’s electricity demand slowed remarkably, which also curbed demands for power generation fuels. These decreased electricity demands can be attributed to the weakening of industrial
22
demands, which had driven the growth of electricity demands. Decreased electricity demands were caused by continuous hikes of the price of electricity for industrial use. Following the slowed growth of electricity demands in 2011, energy consumption growth has continued to remain low. Controlling electricity demands is the key to ensuring the stability of energy supply and demand in Korea.
Table 2-6. Contribution to Total Energy Consumption Growth by Energy Source (Unit: %)
Period
Coal Petroleum LNG
Coking coal Power
generation Naphtha Power
generation Gas production 2000–
2008 48.4 7.7 35.1 -0.2 22.4 35.0 18.7 16.2
2008–
2011 49.0 16.0 28.6 13.9 15.6 29.6 15.1 10.0
2011–
2015 16.9 32.2 4.2 40.8 45.2 -24.6 -7.5 -15.3
Source: Prepared by the author based on the 2016 Yearbook of Energy Statistics.
3. Energy tax system and international comparison of energy prices
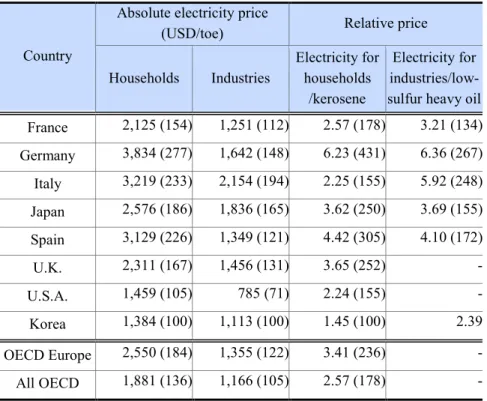
As of 2016, the price of electricity for household and industrial use in Korea was far lower than that of OECD countries in Europe, and lower than the OECD average.15 The average electricity price for households in OECD countries in Europe was USD 2,550/toe, 84% higher than the USD 1,384/toe of Korea.16 The average electricity price for households among all OECD countries was USD 1,881/toe, 36% higher than that of Korea.17 The average electricity price for industries in European OECD countries was USD 1,355 /toe, which is 22% higher than the USD 1,113/toe of Korea.18 The average electricity price for industries among all OECD countries worldwide was USD 1,166 /toe, 5% higher than that of Korea, which is a relatively small difference.19
15 Refer to Energy Prices and Taxes (Q3 2017).
16 Calculated by the author using Energy Prices and Taxes (Q3 2017).
17 Calculated by the author using Energy Prices and Taxes (Q3 2017).
18 Calculated by the author using Energy Prices and Taxes (Q3 2017).
19 Calculated by the author using Energy Prices and Taxes (Q3 2017).
23
Table 2-7. Absolute and Relative Electricity Prices in OECD Countries (as of 2016)
Country
Absolute electricity price
(USD/toe) Relative price
Households Industries
Electricity for households
/kerosene
Electricity for industries/low- sulfur heavy oil France 2,125 (154) 1,251 (112) 2.57 (178) 3.21 (134) Germany 3,834 (277) 1,642 (148) 6.23 (431) 6.36 (267) Italy 3,219 (233) 2,154 (194) 2.25 (155) 5.92 (248) Japan 2,576 (186) 1,836 (165) 3.62 (250) 3.69 (155) Spain 3,129 (226) 1,349 (121) 4.42 (305) 4.10 (172)
U.K. 2,311 (167) 1,456 (131) 3.65 (252) -
U.S.A. 1,459 (105) 785 (71) 2.24 (155) -
Korea 1,384 (100) 1,113 (100) 1.45 (100) 2.39
OECD Europe 2,550 (184) 1,355 (122) 3.41 (236) -
All OECD 1,881 (136) 1,166 (105) 2.57 (178) -
Note: ( ) indicates the size relative to Korea (Korea=100); prices as of 2016.
Source: Prepared by the author using Energy Prices and Taxes (Q3 2017)
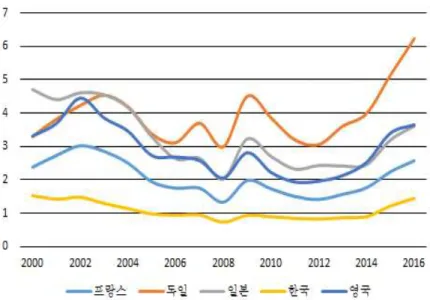
In Korea, as of 2016, the relative price of electricity for households vs. kerosene was 1.46, and the relative price of electricity for industries vs. low-sulfur heavy oil was 2.39. Relative prices for both households and industries in OECD countries were higher than those in Korea. As for electricity for household use, the average relative price of OECD countries in Europe was 3.41, and the average relative price of all OECD countries was 2.57, which is significantly higher than the relative prices of Korea.
In the early 2000s, when international oil prices were rising, Korea managed to curb its increasing electricity prices. From 2005 to 2014, electricity prices for households were lower than prices for light crude oil, which kept the relative electricity price under 1.20 The relative price of electricity for industries (vs. low-sulfur heavy oil) stayed at 1 or less from 2008 to 2012.21
Electricity prices have risen steadily since the late 2000s, and currently (as of 2016), the relative prices of electricity have risen to greater than 1, and international oil prices have declined (as of the second half of 2014).
Despite these increases, the relative prices of electricity vs. other energy sources in Korea are significantly lower
20 Taeheon Kim (2016). “A comparative analysis of the relative prices of energy in major countries.” p. 29.
21 Taeheon Kim (2016). “A comparative analysis of the relative prices of energy in major countries.” p. 32.
24 than those in other OECD nations (as of 2016).
Korea’s average effective tax rate for power generation is in the lower range compared to other OECD nations (Figure 2-3). The average effective tax rate for all energy sources in Korea is less than the OECD average (Figure 2-4). Since the relative price of electricity may fluctuate together with the international energy market, electricity prices in Korea should be adjusted by adopting energy tax reforms that reflect externality.
Figure 2-1. Relative Price of Electricity vs. Low-sulfur Heavy Oil for Industrial Use
Source: Prepared by the author using the IEA Energy Prices and Taxes Statistics (OECD iLibrary, accessed on Sep 20, 2017).
원문 번역문
프랑스 독일 일본 한국 영국
France Germany Japan Korea U.K.
Figure 2-2. Relative Price of Electricity vs. Light Crude Oil Price for Household Use
25
Source: Prepared by the author using IEA Energy Prices and Taxes Statistics (OECD iLibrary, accessed on Sep 20, 2017).
Figure 2-3. Average Effective Energy Tax for Electricity Generation
Source: Taxing Energy Use 2015, OECD, p. 60.
Figure 2-4. Average Effective Energy Tax on CO2 from Energy Production
26
Source: Taxing Energy Use 2015, OECD, p. 62.
27
Chapter 3. Estimation of the Social Costs of Fuels Used for Power Generation
1. Appropriate taxes on fuels used for power generation
Energy enables consumers to use heating and lighting devices, increases the utility of various devices, and is an important input variable for production. Although energy is an important part of human economic activities in contemporary society, its use results in a variety of external costs, including the emission of pollutants and traffic congestion. The external costs of electricity generation using different fuels include environmental contamination due to the emission of pollutants and climate change caused by greenhouse gas emissions.
If utility companies do not incorporate these social costs into their electricity prices, these costs will be passed on to an unspecified multitude of people. In Korea, the current low electricity prices, which do not reflect external costs, trigger a higher, overinflated demand for electricity. As such, when external costs are not properly reflected in electricity prices, it distorts the distribution of resources. When electricity consumers pay only for the private costs related to the actual generation of power and prices do not reflect external costs such as environmental pollution, electricity demands surpass the level required to meet the needs of society. A tax levied on energy to internalize the external costs of fuel use is called a ‘Pigouvian tax,’ or ‘environmental tax’. Environmental taxes, along with emissions trading systems, help solve environmental problems using market mechanisms.
Figure 3-1 illustrates the principle of internalizing external costs (such as environmental pollution) by levying taxes on power generation fuels.22 When only the private costs of the producer are considered, the equilibrium of electricity production is Q0. However, if the social costs of environmental damage caused by power generation are considered, optimum electricity production moves to Q*.23 Namely, when a tax equivalent to marginal damage GI (JQ*) is imposed on pollutants or greenhouse gases emitted by power generation fuels, the marginal private cost curve moves upwards to PMCT, allowing electricity supply and demand to reach a new equilibrium (Q*), thereby reducing air pollutants and greenhouse gas emissions.24
Figure 3-1. Principles for Imposing Energy Taxes
22 Jungu Lee (2006) pp. 155–166.
23 Taeheon Kim (2015) pp. 29–30.
24 Taeheon Kim (2015) pp. 30.
28
Source: Jungu Lee, Finance (2006), p. 165 (as cited in Taeheon Kim (2015))
원문 번역문
가격, 비용 산출량
Price, cost Output
Figure 3-1 illustrates principles for taxation on power generation fuels using the Pigouvian tax principle in the electricity market, where the optimal environmental tax level is equivalent to the amount of marginal damage. In this case, the Pigouvian tax considers only the electricity market and does not reflect damages and market mechanisms in other markets. In the real world, taxes are also levied on labor, capital, and goods. Some researchers25 argue that the optimal environmental tax in a ‘second-best world’26 in which taxes exist is different from that of a theoretical world without any taxes. They go on to say that the imposition of an environmental tax in the real world (a world subject to other taxes) would only serve to further the distortion of existing taxes.
According to these researchers, in a real-world situation in which labor, capital, and goods are taxed, the levying of a new environmental tax or an increase in tax rates encourages consumers to decrease their consumption of higher priced goods and increases their consumption of lower priced goods. The reduced consumption of goods on which an environmental tax is levied reduces the tax base. In this case, even if all the environmental tax revenue were used to reduce other taxes, it would not be enough to fully offset the decrease of real income caused by the imposition of the new environmental tax. Hence, a new environmental tax or increase in tax rates would lead to a decrease in the real wages of workers and reduce the labor supply. As such, the optimal environmental tax for the real world (in which various kinds of taxes already exist) is actually lower than the Pigouvian tax, which is determined by the marginal amount of social damage.27
25 Bovenberg and Mooij (1994), Goulder (1995); Bovenberg and Goulder (1996)
26 Called the ‘Second-Best World’
27 Taeheon Kim (2012), Korea Energy Economics Institute, pp.8-9
29
However, as previously mentioned, the Pigouvian tax can still be used as a starting point for determining an appropriate environmental tax, even when considering a ‘second-best world’ in which other taxes exist. This study uses the Pigouvian tax as a basis to estimate the social costs associated with power generation fuels and derive an appropriate environmental tax.
2. Estimation of the environmental costs of power generation fuels
A. Energy consumption for power generation
The consumption of fuels for electricity generation has risen rapidly in tandem with increases in electricity demand. Table 3-1 illustrates electricity generation trends by fuel since 2000. From 2000 to 2015, LNG for electricity production showed the greatest increase with an annual growth rate of 8.9%, followed by bituminous coal (5.3% annual growth rate) and nuclear power (2.8% annual growth rate). The proportion of electricity generated by bituminous coals and LNG also rose significantly.
With regards to the percentage of the nation’s total electricity generated by each fuel, bituminous coal rose from 34.6% in 2000 to 41.5% in 2010, but decreased significantly to 37.7% in 2015. However, as of 2015, bituminous coal represented the largest proportion of Korea’s electricity generation. In the case of LNG, the percentage of LNG in Korea’s electricity generation mix doubled from 10.6% in 2000 to 20.7% in 2010, and decreased slightly to 19.1% in 2015. Electricity generation by nuclear power accounted for 40.9% and 40.6% of total electricity generation in 2000 and 2005, respectively, representing the biggest proportion of the nation’s power mix at that time. Later on, with the slowed growth of nuclear power plant/equipment, the share of nuclear power in the total power mix declined to 31.8% in 2010 and 31.2% in 2015. Currently, as of 2015, bituminous coal represents the largest share of Korea’s electricity generation, followed by nuclear power and LNG—these three energy sources account for 88% of the nation’s total electricity generation, with bituminous coal and nuclear power accounting for a combined 69% of total electricity generation.
Table 3-1. Electricity Generation by Energy Source
(Unit: GWh, %)
Year 2000 2005 2010 2015
Annual growth rate (%)
30 Hydroelectric 5,610
(2.1)
5,189 (1.4)
6,472 (1.4)
5,796
(1.1) 0.2 Anthracite
coal
5,285 (2.0)
4,484 (1.2)
4,393 (0.9)
4,902
(0.9) -0.5 Bituminous
coal
92,253 (34.6)
129,174 (35.7)
193,523 (41.5)
199,328
(37.7) 5.3 Petroleum 26,142
(9.8)
17,732 (4.9)
12,878 (2.8)
31,616
(6.0) 1.3
LNG 28,146
(10.6)
58,118 (16.1)
96,734 (20.7)
100,783
(19.1) 8.9 Nuclear
power
108,964 (40.9)
146,779 (40.6)
148,596 (31.8)
164,762
(31.2) 2.8
Total 266,400 361,880 466,580 528,091 4.7
Note: ( ) indicates the percentage of the total electricity supply; annual average growth rates for alternative energy sources were based on the period of 2005 to 2015.
Source: Prepared by the author based on the 2016 Yearbook of Energy Statistics and Electricity Statistics Report (Aug 2008 & Sep 2017).
Figure 3-2. Electricity Generation by Energy Source
Source: Prepared by the author based on the 2016 Yearbook of Energy Statistics and Electricity Statistics Report (Aug 2008 & Sep 2017).
원문 번역문
단위 Unit
수력 무연탄 유연탄
Hydroelectric power Anthracite
Bituminous coal
31 석유
원자력 대체
Petroleum Nuclear power Alternative energy
By nature, producing electricity using fuels incurs loss, and the efficiency of electricity generation varies by fuel. Thus, the ratio of fuel input to electricity generation output is not the same across all types of fuels. Table 3- 2 illustrates fuel consumption for power generation by energy source since 2000. From 2000 to 2015, the consumption of LNG rose by 8.4%, and bituminous coal rose by 5.6%; these figures are similar to the electricity generation growth rates of each respective fuel. However, since the electricity generation efficiency28 of LNG increased more quickly than that of bituminous coal, the ratio of fuel input to electricity generation is slightly different between the two different fuels. With regards to fuel input by energy source, the percentage of bituminous coal consumption increased from 34.6% in 2000 to 45.2% in 2015, which is greater than its share of the nation’s total electricity generation (37.7%), as seen in Table 3-1. The share of LNG consumption was 17.6% in 2015, lower than its share of electricity generation (19.1%) (see Table 3-1 in the same year. In 2015, in terms of electricity generation, the amount of electricity generated using bituminous coal was 1.98 times larger than LNG, but in terms of fuel input, the amount of bituminous coal consumed was 2.6 times larger than the amount of LNG consumed. Due to the increased generation of electricity using LNG, LNG consumption increased the fastest, but as the years progressed, bituminous coal for power generation increased as well. Currently, as of 2015, bituminous coal accounts for nearly half of all total fuel input for electricity generation.
As discussed in Chapter 2, since the current energy tax system does not adequately reflect the externals cost of each fuel type, the tax levied on coal—which is the biggest source of pollutants and greenhouse gas emissions per unit—is less than the tax levied, per unit, on LNG. The implementation of this type of energy tax system lowers the cost of electricity generated using coal, thereby encouraging the use of coal as a fuel source and increasing coal consumption for future electricity generation.
Table 3-2. Fuel Consumption by Energy Source Used for Power Generation (Unit: 1,000 toe, %)
Year 2000 2005 2010 2015
Annual growth rate (%)
28 As of 2015, the generation efficiency (electricity generation ÷ input energy) by fuel source was 44.9% for LNG and 34.6%
for bituminous coal.
32 Hydroelectric
power
1,402 (2.2)
1,297 (1.5)
1,391 (1.3)
1,223
(1.1) -0.9 Anthracite
coal
1,083 (1.7)
895 (1.0)
390 (0.4)
1,054
(1.0) -0.2 Bituminous
coal
21,981 (34.6)
31,582 (36.7)
47,538 (45.5)
49,498
(45.2) 5.6
Petroleum 6,042 (9.5)
4,290 (5.0)
3,125 (3.0)
2,015
(1.8) -7.1
LNG 5,767
(9.1)
11,138 (13.0)
19,470 (18.6)
19,304
(17.6) 8.4
Nuclear power
27,241 (42.9)
36,695 (42.7)
31,948 (30.5)
34,765
(31.7) 1.6
Total 63,516 85,961 104,580 109,602 3.7
Note: ( ) indicates the percentage of the total amount of electricity generated by each respective fuel.
Source: Prepared by the author using the 2016 Yearbook of Energy Statistics.
Figure 3-3. Fuel Use for Power Generation
Source: Prepared by the author based on the 2016 Yearbook of Energy Statistics.
원문 번역문
단위 Unit
수력 무연탄
Hydroelectric power Anthracite
33 유연탄
석유 원자력
Bituminous coal Petroleum Nuclear power
B. Emissions of pollutants by the power generation sector
Table 3-3 details the 2014 emissions of specific air pollutants—carbon monoxide (CO), nitrogen oxide (NOx), sulfur oxide (SOx), and fine particular matter (PM2.5)—in Korea by emissions source. The percentages of total air pollutant emissions that can be attributed to the energy industry are as follows: 10% for CO, 14% for NOx, 28% for SOx, and 6% for PM2.5.
Table 3-3. 2014 Air Pollutants by Source of Emissions
(Unit: ton, share (%)) Source of
emissions CO NOx SOx PM2.5
Energy industry combustion
57,856 (10%) 162,818 (14%) 94,562 (28%) 3,679 (6%)
Non-industry
combustion 76,594 (13%) 81,143 (7%) 24,668 (7%) 1,045 (2%) Manufacturing
industry combustion
18,716 (3%) 173,660 (15%) 82,982 (24%) 30,322 (48%)
Production
processes 25,855 (4%) 53,311 (5%) 98,927 (29%) 4,903 (8%) Movement on
roads 281,225 (47%) 361,230 (32%) 183 (0%) 9,218 (15%) Non-road
movement 126,103 (21%) 291,171 (26%) 39,991 (12%) 13,671 (22%) Waste disposal 1,645 (0%) 12,257 (1%) 1,846 (1%) 204 (0%)
Other 6,459 (1%) 153 (0%) - 245 (0%)
Total 594,454 1,135,743 343,161 63,286
34
Source: Prepared by the author based on the 2014 Air Pollutant Emissions Statistics by the National Air Pollutant Emission Service of the National Institute of Environmental Research (http://airemiss.nier.go.kr/user/boardList.do?command=view&page
=1&boardId=160&boardSeq=346&id=airemiss_030500000000, accessed on Sep 18, 2017).
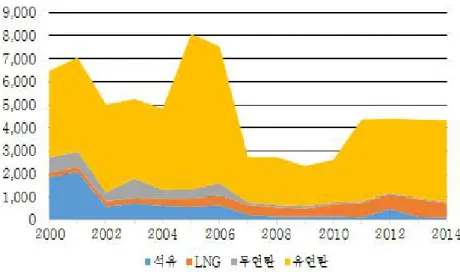
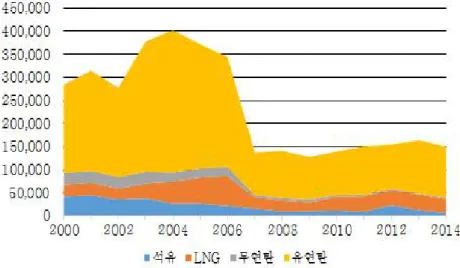
Figure 3-4 Figure 3-5, and Figure 3-6 detail trends in the emission of air pollutants—particulate matter (PM10), nitrogen oxide (NOx), sulfur oxide (SOx), etc.—due to power generation from 2000 to 2014. As seen below, emissions from power generation have generally declined since 2000, but rose slightly in 2007.
In the early 2000s, 5,000–7,000 tons of particulate matter (PM10) were emitted annually, but in 2007, PM10 emissions dropped to about 3,000 tons and were maintained at this level for several years. However, since 2011, PM10 emissions have risen back up to 4,000 tons. As of 2014, the largest source of PM 10 emissions (among fuels used for electricity production) was bituminous coal, followed by LNG. This can be attributed to the fact that most thermal power plants use these two sources of energy as fuel.
In the early 2000s, 300,000 tons of nitrogen oxide (NOx) were emitted each year, but in 2007, NOx emissions declined to 140,000 tons and have remained around this level ever since. As of 2014, bituminous coal produced the largest amount of nitrogen oxide (NOx), followed by LNG.
In terms of sulfur oxide (SOx), 180,000 tons were emitted annually in the early 2000s, but in 2007, emissions fell to 80,000 tons and have since remained stable. As of 2014, has LNG produced nearly zero SOx emissions, and most SOx emissions come from thermal power plants using bituminous coal.
Figure 3-4. PM10 Emissions in the Power Generation Sector (Unit: ton)
Source: Adapted by the author in reference to the 2000–2014 Air Pollutant Statistics provided by the National Air
35
Pollutant Emission Service of the National Institute of Environmental Research (http://airemiss.nier.go.kr/, accessed on Sep 18, 2017).
원문 번역문
석유 무연탄 유연탄
Petroleum Anthracite Bituminous coal
Figure 3-5. NOx Emissions in the Power Generation Sector (Unit: ton)
Source: Adapted by the author in reference to the 2000–2014 Air Pollutant Statistics provided by the National Air Pollutants Emission Service of the National Institute of Environmental Research (http://airemiss.nier.go.kr/, accessed on Sep 18, 2017).
원문 번역문
석유 무연탄 유연탄
Petroleum Anthracite Bituminous coal
Figure 3-6. SOx Emissions in the Power Generation Sector (Unit: ton)
36
Source: Adapted by the author in reference to the 2000–2014 Air Pollutant Statistics provided by the National Air Pollutants Emission Service of the National Institute of Environmental Research (http://airemiss.nier.go.kr/, accessed on Sep 18, 2017)
원문 번역문
석유 무연탄 유연탄
Petroleum Anthracite Bituminous coal
C. Emissions of pollutants per unit of power generation fuel
The emission of air pollutants in the power generation sector have decreased since 2000, despite a sharp increase in the consumption of bituminous coal and LNG. This suggests that the amount of pollutants emitted per unit of thermal power generation has decreased over time. Figure 3-7 – Figure 3-12 illustrate some of the changes in pollutant emissions by electricity generation fuels from 2000 to 2014.
From 2000 to 2006, the use of anthracite for electricity production resulted in 100 kg of PM10 emissions per 1 GWh, while the use of bituminous coal resulted in 40 kg of PM10 emissions per 1 GWh. However, since 2007, the amount of emissions per unit of electricity generation has dropped significantly, and in 2014, PM10 emissions caused by the use of anthracite decreased to 13 kg, and PM10 emissions for bituminous coal decreased to 16 kg.
During this same period, LNG produced the lowest amount of PM10 emissions per unit of electricity generated.
Figure 3-7. PM10 Emissions by Electricity Generation Fuel
(Unit: kg/GWh)
37
Source: Prepared by the author in reference to the Electricity Statistics Reports (Aug 2018 & Sep 2017) and the 2000–2014 Air Pollutant Statistics provided by the National Air Pollutants Emission Service of the National Institute of Environmental Research (http://airemiss.nier.go.kr/, accessed on Sep 18, 2017).
원문 번역문
석유 무연탄 유연탄
Petroleum Anthracite Bituminous coal
Figure 3-8. PM10 Emissions per Unit of Fuel
(Unit: kg/t)
Source: Prepared by the author in reference to the 2000–2014 Air Pollutant Statistics provided by the National Air Pollutant Emission Service of the National Institute of Environmental Research (http://airemiss.nier.go.kr/, accessed on Sep 18, 2017) and the Use of Fuel for Power Generation posted on the Electricity Statistics Information System (https://epsis.kpx.or.kr/, accessed on Sep 19, 2017).
원문 번역문
유연탄 Bituminous coal
38
For bituminous coal and LNG, which are the largest producers of PM10, emissions per unit of consumption (ton) were slightly different from the emissions per unit of electricity generation. Up until 2006, PM10 emissions per unit of bituminous coal consumption were 0.1 kg; from 2007 onward, this number fell sharply, reaching 0.04 kg in 2014. For LNG, PM10 emissions per unit of consumption remained at around 0.04 kg from 2000 to 2014.
As of 2014, PM10 emissions for bituminous coal and LNG per unit of fuel consumption were almost the same.
From 2000 to 2006, anthracite produced 4,500 kg of NOx per unit of electricity generation (1 GWh), and bituminous coal produced 2,000 kg of NOx. However, NOx emissions per unit of electricity generation have greatly decreased, with NOx emissions for both anthracite and bituminous coal falling to 500kg by 2014. LNG showed the lowest NOx emissions per unit of electricity generation, with only 1,000 kg of NOx emissions in the early 2000s and 200 kg in 2014.
For LNG and bituminous coal, which are the largest contributors to NOx emissions, the emissions per unit of fuel consumption (ton) were slightly different from the emissions per unit of electricity generation. Up until 2006, the amount of NOx emissions per unit of consumption for bituminous coal was 6 kg/ton; however, after 2007, this number decreased dramatically to only 1.5 kg/ton. For LNG, NOx emissions per unit of consumption were 6 kg/ton up until 2006, but after 2007, fell sharply to 2 kg/ton. In terms of PM10 emissions per unit of fuel consumption, bituminous coal was lower than LNG.
Figure 3-9. NOx Emissions per Unit of Electricity Generation (Unit: kg/GWh)
Source: Prepared by the author in reference to the Electricity Statistics Report (Aug 2018 & Sep 2017) and 2000–
2014 Atmospheric Pollutant Statistics by the National Air Pollutants Emission Service of the National Institute of Environmental Research (http://airemiss.nier.go.kr/, accessed on Sep 18, 2017).
39
원문 번역문
석유 무연탄 유연탄
Petroleum Anthracite Bituminous coal
Figure 3-10. NOx Emissions per Unit of Fuel Consumption (Unit: kg/t)
Source: Prepared by the author in reference to the 2000–2014 Atmospheric Pollutant Statistics provided by the National Air Pollutant Emission Service of the National Institute of Environmental Research (http://airemiss.nier.go.kr/, accessed on Sep 18, 2017) and Trends in the Use of Fuels for Power Generation posted on the Electricity Statistics Information System (https://epsis.kpx.or.kr/, accessed on Sep 19, 2017).
원문 번역문
유연탄 Bituminous coal
For bituminous coal and anthracite, SOx emissions per GWh in the early 2000s were 1,400 kg, and 1,200 kg, respectively. However, after the mid-2000s, SOx emission per unit dropped remarkably. In 2014, SOx emissions for anthracite and bituminous coal fell to 200 kg and 400 kg, respectively. LNG produced almost zero SOx emissions during this same period.
In the case of bituminous coal, the amount of SOx emissions per unit of fuel consumption (ton) was nearly the same as the amount of SOx emissions per unit of electricity generation (GWh). SOx emissions for bituminous coal per unit of consumption were over 2.5 kg until 2006, but after 2007, dropped significantly to around 1 kg.
Figure 3-11. SOx Emissions per Unit of Electricity Generation (Unit: kg/GWh)
40
Source: Prepared by the author in reference to the Electricity Statistics Report (Aug 2018 & Sept 2017) and the 2000–2014 Atmospheric Pollutant Statistics provided by the National Air Pollutants Emission Service of the National Institute of Environmental Research (http://airemiss.nier.go.kr/, accessed on Sep 18, 2017).
원문 번역문
석유 무연탄 유연탄
Petroleum Anthracite Bituminous coal
Figure 3-12. SOx Emissions per Unit of Fuel Consumption (Unit: kg/t)
Source: Prepared by the author in reference to the 2000–2014 Atmospheric Pollutants Statistics by the National Air Pollutants Emission Service of the National Institute of Environmental Research (http://airemiss.nier.go.kr/, accessed on Sep 18, 2017) and Trends of the Use of Fuels for Power Generation posted on the Electricity Statistics Information System (https://epsis.kpx.or.kr/, accessed on Sep 19, 2017).
원문 번역문
41
유연탄 Bituminous coal
Table 3-4 shows the emission coefficients by air pollutant and fuel in 2014 used to calculate the damage costs per unit of fuel. The emission coefficient is calculated by dividing air pollutant emissions by the consumption of energy for power generation.
Table 3-4. 2014 Air Pollutant Emissions by Power Generation Fuel (Emission Coefficients) (Unit: g/kg, g/ℓ for petroleum) Energy
source CO NOx SOx TSP PM10 VOC NH3 PM2.5
Petroleum 0.938 3.314 2.316 0.046 0.036 0.155 0.092 0.022 LNG 1.977 2.025 0.207 0.044 0.044 0.267 0.064 0.044 Anthracite 0.144 1.189 0.554 0.052 0.030 0.072 0.000 0.016 Bituminous
coal 0.269 1.466 0.973 0.047 0.043 0.032 0.000 0.033
D. Air pollution cost per power generation fuel
This study adopted the estimates of AEA (2005)29 and Hojeong Park, et al. (2017)30 to calculate the air pollution cost per power generation fuel. Two estimates were used because the estimation of external costs is heavily dependent on the premise and method of estimation.
AEA (2005) presented four scenarios, based on the damage pollutants can inflict on the human body and the economy. This information can be seen in Table 3-5.
Table 3-5. Economic Value of Environmental Damage According to AEA (2005) (Unit: EUR/ton) Items Scenario 1 Scenario 2 Scenario 3 Scenario 4 PM mortality VOLY median VSL median VOLY mean VSL mean O3 mortality VOLY media VOLY media VOLY mean VOLY mean Health sensitivities Not included Not included Included Included
Crops Included Included Included Included
29 AEA (2005) investigated the damages per ton of PM2.5, NH3, SO2, NOx and VOC emissions from each of the 25 EU Member States (excluding Cyprus) and seas surrounding Holland. M., Pye, S., Watkiss, P., Droste-Franke, B. and Bickel, P.(2005).
30 Hojeong Park, et al. (2017). “Meta-analysis of external costs of thermal power generation.” [Presentation].