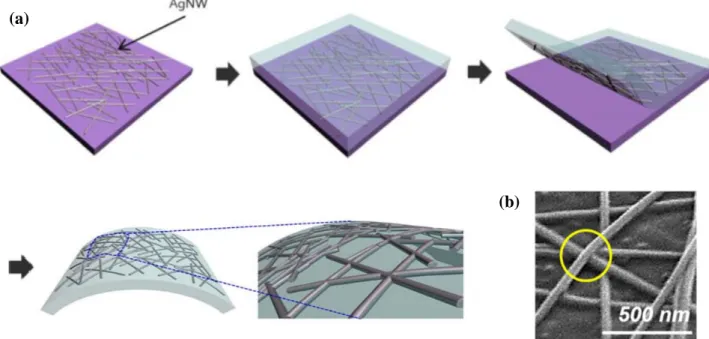
We compared the stress distributions of OLEDs under the bending test and investigated the effect of the volume fraction of AgNWs on the structural stability of the structures. The second reference model also consisted of five layers, but now the ITO layer was replaced by 72 nm thick PEOT:PSS composite AgNW while the materials of the other four layers are the same. The real size of the flexible OLED device is 15 mm x 15 mm in the lateral directions, but we carefully reduced it to 7 mm x 1 mm without any significant change in the stress analysis to reduce the computational cost.
Fracture toughness is used as a material failure criterion and represents the material's resistance to brittle fracture. As a result, it was confirmed that the AgNWs electrode is superior to the ITO electrode in terms of structural and bending robustness during bending. Final model of the hinge with brackets to control the exact bend radius. a) There is a path AB along with the length of the shell. a) On the bent line in the shell are Path CD.
Bounded shell dimension and Von-Mises stress distribution. a) and (b) show the final modeling before and after bending. a) and (b) show the final hinge resizing modeling before and after bending. a).
Introduction
Introduction
OLEDs structure and luminescence principle
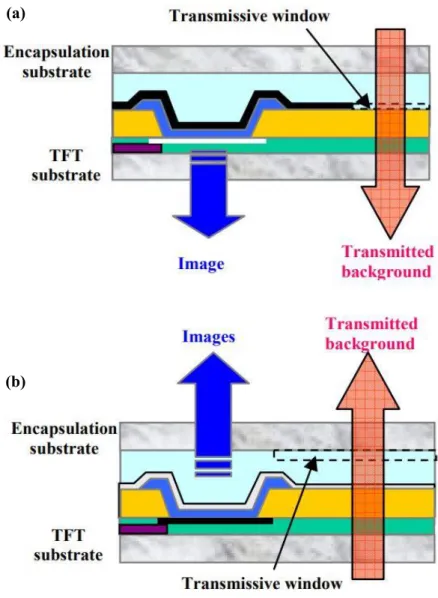
Light is reflected from the cathode and emitted to the substrate through the transparent anode. In bottom emission, the emitted light is partially blocked by a capacitor or a thin film transistor (TFT). It causes low aperture ratio, which is the area that can emit light per unit pixel, and bad impact on device life to emit more brightness than wasted brightness.
Put another way, top emission means that the light is emitted towards the cathode. However, the cathode must be very thin to be transparent, causing high plate resistance and damage to the organic material during the deposition process.
Modeling for Bending Test
Hinge modeling
- Draft modeling
- Support for accurate bending radius
- Friction between shell and hinges
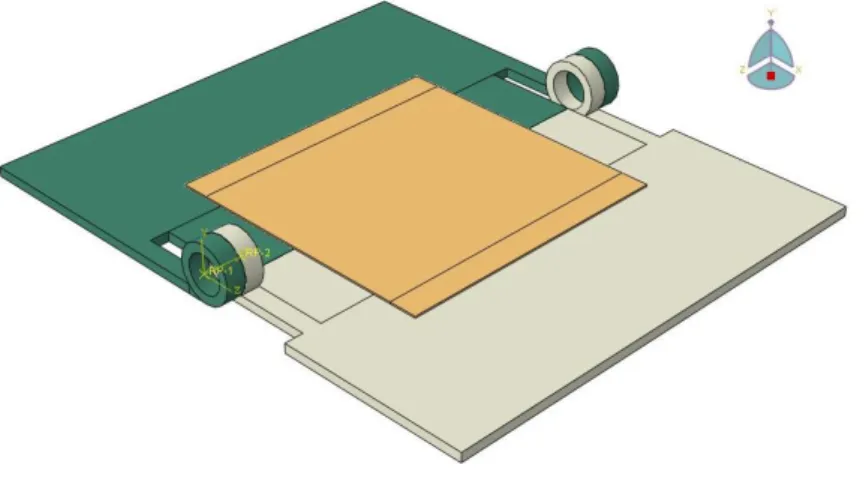
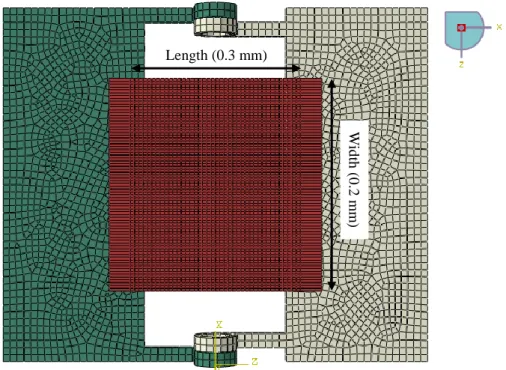
The shell consists of composite coating including 5 layers which are Al, PDY-132, PEDOT:PSS, ITO and PET. In Figure 2-2, the red rectangles in the shell are connected to the hinges, and the unconnected area in contact with the hinges has friction. The element type used in hinge modeling is R3D4 which is used for a 4-element 3-dimensional solid joint.
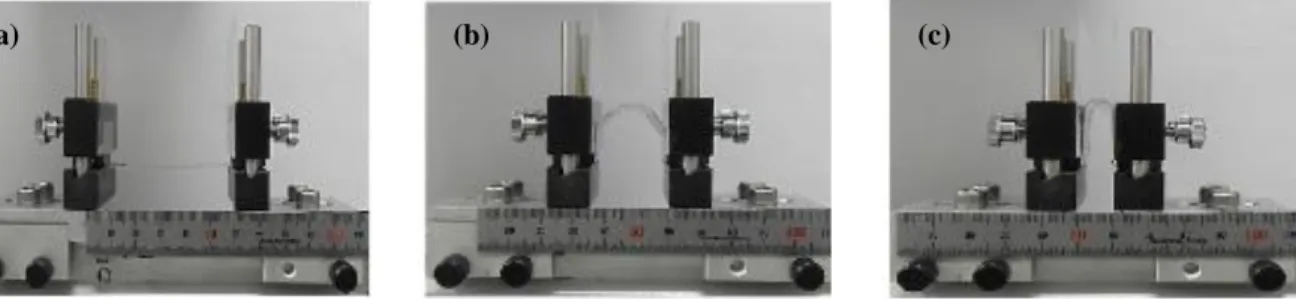
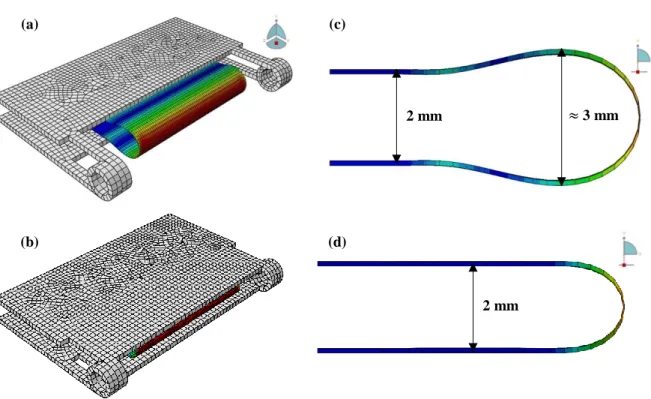
Element type of the shell is S4R which is used for a linear 4-node quadrilateral shell element. In the bending test, a hole between the two hinges could not cause compressive stress on the shell and the bending radius was changed from 1 mm to about 1.5 mm as shown in figure 2-4 (c). Therefore, I compensated the defect by using support between the hinges as in figure 2-4 (b) and the bending radius was controlled to the desired value.
For the bending test, hinge modeling in 3-dimension (a) without supports and (b) with supports. c) The cross-section of the shell in the x-y plane (c) without supports and (d) with supports. There was friction at the interface between the unbonded region of the shell and the hinges. Since the contact area between the hinges and the shell is increased by support between two hinges, the influence of friction could not be ignored.
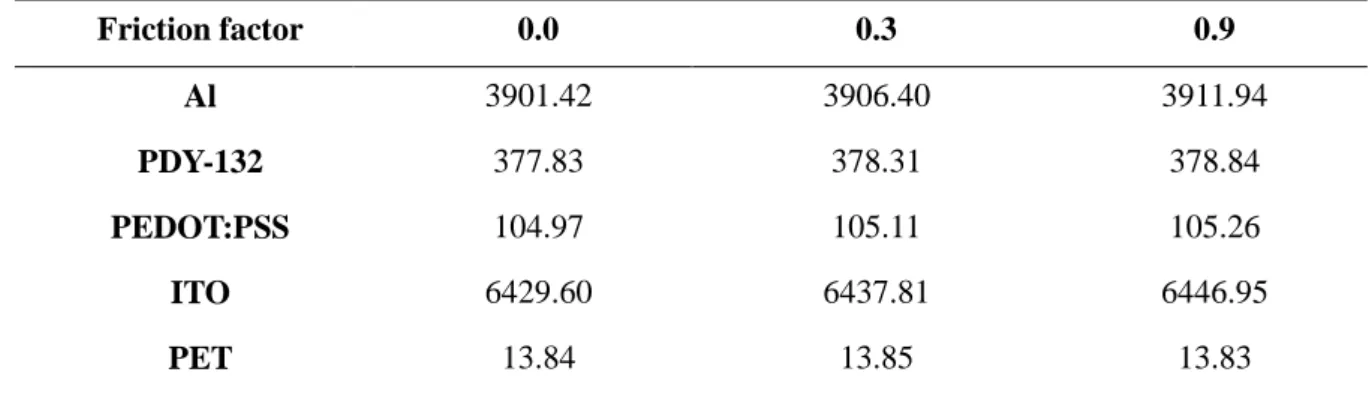
To check the influence of the friction, I changed the friction factor from 0.0, 0.3 to 0.9 and then compared Von-mises at the center of the scale in each layer. Therefore, the final hinge modeling, shown in Figure 2-5, has a friction factor of 0.3 between the hinges and the shell. The Von-mises values at the center of the scale in each layer per friction factor.
Shell modeling
- Reducing width of the shell
- Reducing length of the shell
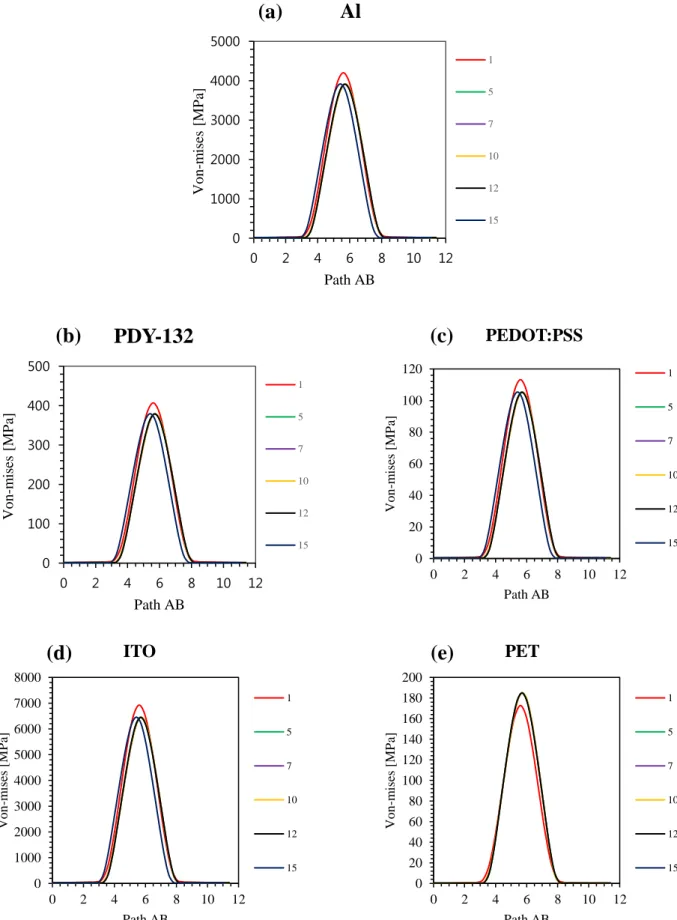
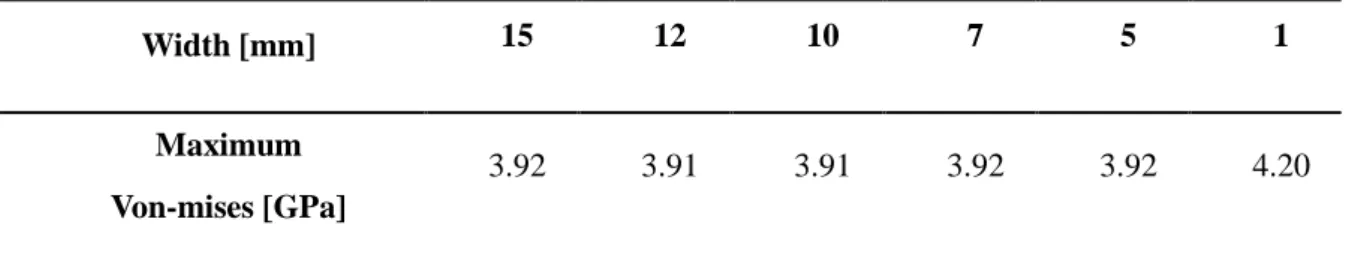
Von mises of the shells are applied at the bent line and almost the same, while there was no stress in the other area. In Al layer, accurate values of Von mises according to the width of the shell are listed in table 2-2. The values of stress distribution are almost constant despite the change in width of the shell.
Maximum von mises at path AB by reducing the width of the shell in the Al layer. The area near the curved line is affected by bending stress, and the length of the shell should be longer than 5mm to avoid affecting the applied bending stress. As the length of the shell decreases, the solid area becomes closer to the curved line and the free area becomes smaller.
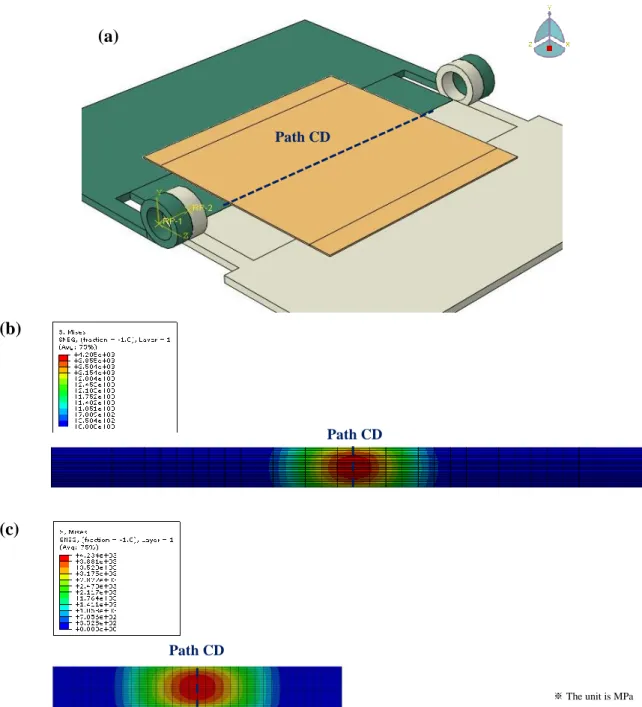
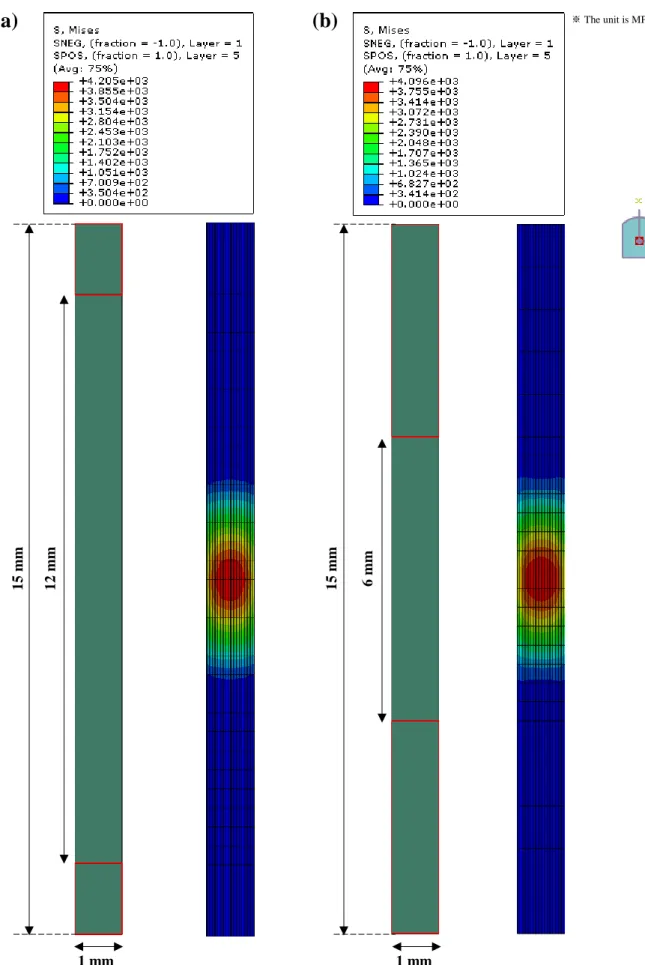
I changed the free length from 12mm to 6mm with a constant shell length of 15mm and compared the Von-mises result to check the effect. a) On the bent line in the shell are Path CD. So I set the free length to 6mm regardless of the shell length and I reduced the shell length from 15mm to 7mm, in the same way by reducing the width. In the Al layer, the exact values of the maximum Von-Misses with respect to the shell length are listed in Table 2-3.
Therefore, the length of the shell was set to 7 mm, and the final dimension of the shell was determined to be 7 mm × 1 mm. Maximum Von mises at Path CD by reducing the length of the shell in Al layer. The dimension of the bounded shell and Von-mises stress distribution. a) and (b) show final modeling before and after bending. a) and (b) show final modeling with change of hinge size before and after bending.
Homogenization for AgNWs
- Basic concept of homogenization
- Obtaining the elastic properties
- Analytical method
- Periodic boundary conditions
- Generation of RVE modeling
- Generation of RVE modeling with longitudinal pattern of fibers
- Generation of RVE modeling with orthogonal pattern of fibers
- Comparison between analytical and numerical method
- Influence by fibers on homogenization result
- Influence by number of fibers
- Influence by position of fibers
Therefore, the material properties are the same in the direction of the normal plane of the fiber, and the number of independent elastic constants is reduced to 5. Elastic properties, including longitudinal and transverse Young's modulus (EL, ET) and shear modulus (GLT, 𝐺𝑇𝑇), longitudinal Poisson's ratio (νLT ) is determined by the compliance matrix, which is the inverse of the elastic stiffness matrix. Six analyzes are required to determine each column of the PBC stiffness tensor used in the RVE.
When the value of 𝜀̅𝑘𝑙 is 1 and the other values of all strain tensors are 0, the value of Cijkl is equal to the value of 𝜎̅𝑖𝑗, which is the volume average of the stress field. It is a very important value in determining the elastic properties of a composite and is calculated using a simple equation. All equations for PBC must be applied to one node and the opposite node at the edges and vertices of the RVE.
Where Wx and Wy are the dimensions of the RVE in the x and y direction and u and v are the displacement along the x and y axis. For the group, each node of the RVE is combined with the node of the opposite parallel side. Figure 3-4 shows the geometry information for RVE faces, edges, and vertices to apply 3D PBC.
An automatic generation of the symmetric nodes and constraint equations for PBCs must be developed because the RVE has many nodes. As a result, each column of the stiffness matrix is determined, and the elastic properties of RVE for homogenization can also be determined, as shown in Table 3-3. Python script for calculating the stiffness tester components is shown from page 33 to page 35.
Through the 'homogenized_stiffeness_output.txt' we can get the stiffness tensor and then calculate the elastic properties of the composite. Although there is a small gap between analytical and numerical results of (a), (b) and (c), the values are very small as many ignore.
Result and Discussion
Homogenization result of AgNWs
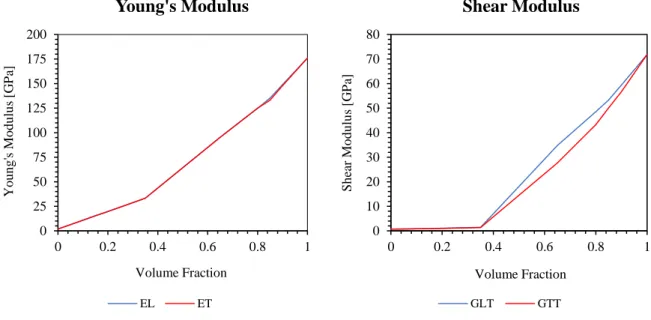
The final RVE modeling was created with a size of 10 mm x 10 mm x 10 mm and a fiber with a long length, circular shape and 50% orthogonal pattern. I changed the volume fraction of AgNWs from 0% to 100% and checked the homogenization result based on the volume fraction. Since the final AgNWs layer has a volume fraction of 10%, its final elastic properties are shown in Table 4-2.
Thickness of AgNWs layer
Comparison between stress distribution of OLEDs containing ITO or AgNWs
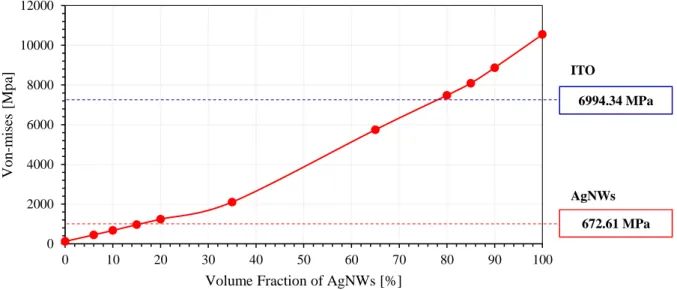
The value measured in the ITO layer is 10 times greater than the value of Von-mises measured in the AgNWs layer and corresponding to the value of Von-mises of the AgNWs layer with 75% volume fraction. However, reference model including AgNWs electrode was applied small voltage, and AgNWs, which have high yield stress, and PEDOT:PSS, which is a conducting polymer, do not break well. Other voltage results listed in Tables 4-5 also show that the voltage applied to the ITO layer is 10 times to 45 times greater than the voltage applied to the AgNW layer.
The values of stress measured in the center of the shell including ITO or AgNWs. In addition to stress distribution, the fracture toughness of ITO and silver is about 2.59 MPa m1/2 and 40 MPa m1/2 at room temperature. If the fracture toughness value is large, the material's properties will normally undergo ductile fracture.
On the other hand, brittle fracture may occur in a material with low fracture toughness before yielding. The fracture toughness of ITO belongs to the low value, while the fracture toughness of silver belongs to the high value. If ITO is used for flexible OLEDs, it will break easily even with a small deformation.
However, as a result of this thesis, flexible OLEDs made by AgNWs are applied less stress and do not break under large deformation, remaining at high transmittance and low skin resistance. Therefore, it was confirmed that the AgNWs electrode is better than the ITO electrode in the aspect of structural and bending strength during bending.
Sanggil Nam, Myungkwan Song, Dong-Ho Kim, Byungjin Cho, Hye Moon Lee, Jung-Dae Kwon, Sung-Gyu Park, Kee-Seok Nam, Yongsoo Jeong, Se-Hun Kwon, Yun Chang Park, Sung-Ho Jin, Jae-Wook Kang, Sungjin Jo, Chang Su Kim, 2014, "Ultra-smooth, extremely deformable and shape-reversible Ag-nanowire embedded transparent electrode". Srihari Kurukuri, 2005, "Homogenization of damaged concrete mesostructures using representative volume elements - Implementation and application to hose", Bauhaus–. Fan Ye, Hu Wang, 2017, "A simple Python code for calculating effective properties of 2D and 3D representative volume elements under periodic boundary conditions", Hunan University, Changsha 410082, P.R.
Weidong Wu, Joseph Owino, Ahmed Al-Ostaz, Liguang Cai, 2014, "Application of Periodic Boundary Conditions in Finite Element Analysis", University of Tennessee Chattanooga and Mississippi. Yonghee Jang, Jihoon Kim, Doyoung Byun, 2013, "Invisible metal-grid transparent electrode prepared by electrohydrodynamic (EHD) jet printing", J. Won-Yong Jin, Riski Titian Ginting, Keum-Jin Ko and Jae-Wook Kang, 2016 , "Ultra-smooth, fully solution-processed large-area transparent conductive electrodes for organic device", SCIENTIFIC REPORTS.
![Figure 1-3. The reference model structure of OLEDs containing AgNWs. [1]](https://thumb-ap.123doks.com/thumbv2/123dokinfo/10514010.0/17.892.117.599.228.511/figure-1-reference-model-structure-oleds-containing-agnws.webp)