저작자표시-비영리-변경금지 2.0 대한민국 이용자는 아래의 조건을 따르는 경우에 한하여 자유롭게
l 이 저작물을 복제, 배포, 전송, 전시, 공연 및 방송할 수 있습니다. 다음과 같은 조건을 따라야 합니다:
l 귀하는, 이 저작물의 재이용이나 배포의 경우, 이 저작물에 적용된 이용허락조건 을 명확하게 나타내어야 합니다.
l 저작권자로부터 별도의 허가를 받으면 이러한 조건들은 적용되지 않습니다.
저작권법에 따른 이용자의 권리는 위의 내용에 의하여 영향을 받지 않습니다. 이것은 이용허락규약(Legal Code)을 이해하기 쉽게 요약한 것입니다.
Disclaimer
저작자표시. 귀하는 원저작자를 표시하여야 합니다.
비영리. 귀하는 이 저작물을 영리 목적으로 이용할 수 없습니다.
변경금지. 귀하는 이 저작물을 개작, 변형 또는 가공할 수 없습니다.
Master's Thesis
Sounkou Kim
Department of Biological Sciences
Ulsan National Institute of Science and Technology
2022
Comparative Study on Microbiome of Saliva,
Tissue, and Stool from Crohn’s Disease
Sounkou Kim
Department of Biological Sciences
Ulsan National Institute of Science and Technology
Comparative Study on Microbiome of Saliva,
Tissue, and Stool from Crohn’s Disease
i
Abstract
Research on inflammatory bowel disease (IBD) has mainly focused on intestinal tissue or stool sample that are neighboring where the disease occurs. However, inflammation is a kind of immune response based on the circulatory system spread throughout the body. In particular, the symptoms of Crohn's disease (CD) can be found not only in the small intestine and colon, but also in joints, skin, liver, biliary ducts, and kidneys beyond the entire gastrointestinal tract, which is known as extraintestinal manifestations (EIMs). Based on this characteristic of CD, some approaches for studying CD used saliva samples to investigate oral microbiota. This study is aimed to comprehend common or unique features of microbiome in saliva, which is relatively simple to obtain, compared to those in intestinal tissue biopsy and stool samples.
The microbiome profiles for the three different body sites showed similar characteristics between intestinal tissue and stool, attributed to their adjacent environment, and distinct pattern for saliva.
Streptococcus and Prevotella from the saliva and Bacteroides and Escherichia-Shigella from stool and intestine tissue were the major genera, in the respective sites. Streptococcus and Prevotella were also found in stool, suggesting their potential to serve as diagnostic or prognostic biomarkers for CD.
ii
iii
Contents
Abstract ... i
Contents ... iii
List of Figures ... iv
List of Tables ... v
Introduction ... 1
Materials and Methods ... 3
Study Subjects ... 3
Sample Collection ... 3
DNA Extraction and 16sRNA Gene Amplification Sequence Processing ... 3
Bioinformatic and Statistic Analysis ... 4
Results ... 5
Baseline Characteristics ... 5
Overview of Taxonomic Distribution ... 7
Quantitative and Phylogenic Analysis ... 12
Discussion ... 21
Conclusion ... 26
References ... 27
iv
List of Figures
Figure 1: Alpha diversity of microbiome in saliva, tissue, and stool of CD patients
Figure 2: Beta Diversity; unweighted UniFrac distances of microbiome in saliva, tissue, and stool of CD patients
Figure 3: Taxonomy bar plot of microbiome in saliva, tissue, and stool of CD patients Figure 4: UMAP of microbiome cluster in saliva, tissue, and stool of CD patients Figure 5: Heatmap of microbiome cluster in saliva, tissue, and stool of CD patients Figure 6: LDA histogram of microbiome in saliva, tissue, and stool of CD patients Figure 7: Cladogram of microbiome in saliva, tissue, and stool of CD patients
Figure 8: Venn diagram of top 20 abundant genera in microbiome in saliva, tissue, and stool of CD patients
Figure 9: Saliva – Stool Pairwise LDA histogram (LDA 2.0) Figure 10: Saliva – Tissue Pairwise LDA histogram (LDA 2.0) Figure 11: Tissue – Stool Pairwise LDA histogram (LDA 1.0)
v
List of Tables
Table 1: Baseline Demographic and Clinical Characteristics of Participants Table 2a: Top 20 abundant genera in saliva sample
Table 2b: Top 20 abundant genera in tissue sample Table 2c: Top 20 abundant genera in stool sample
Table 3a: Common genera within top 20 abundant among saliva, tissue, and stool Table 3b: Exclusive genera within top 20 abundant among saliva, tissue, and stool
1
Introduction
Inflammatory bowel disease (IBD) is a chronic inflammatory gastrointestinal disorder represented mainly by Chron's disease (CD) and ulcerative colitis (UC)1,2. The incidence and prevalence of IBD have increased worldwide, and patients with IBD have suffered from various symptoms, including abdominal pain, diarrhea, and hematochezia. However, despite continuous efforts, the etiology and pathogenesis of IBD are poorly understood3.
In recent years, the microbiome has been a major area of interest within the field of research on IBD with the development of genome sequencing methods. Several studies have shown the differences in the gut microbial community in patients with IBD from normal, and increasing evidence suggests that they play a pivotal role in the pathogenesis of IBD4,5. Inflammatory cascades induced by an imbalance of gut microbial community called dysbiosis are mainstream of this hypothesis6.
Research on IBD through metagenome analysis has mainly focused on dysbiosis in intestinal tissue or stool samples neighboring where the disease occurs and discovered several microbiome biomarkers for IBD3–5. However, CD affects anywhere in the gastrointestinal tract, from the oral cavity to the anus, so the symptoms of CD can be found not only in the small intestine and colon. It can also lead to disease in joints, skin, liver, biliary ducts, and kidneys beyond the entire gastrointestinal tract, known as extraintestinal manifestations (EIMs)7. Those changes throughout the body caused by CD make it considerable to find the dysbiosis in body sites other than intestinal tissue or stool samples. Among various candidates, saliva samples were added from the oral cavity to this analysis based on the following reasons: 1) there are several kinds of research that describe the composition of the microbiome of saliva affected by inflammation, 2) it is much easier to collect samples from patients in terms of time, occasion, and quality control compared to intestinal tissue biopsy or stool. Based on these advantages, the saliva microbiome from the oral cavity would be examined to whether it is proper as a diagnostic material of CD by comparison and contrast to the microbiome of stool and intestinal tissue biopsy.
Recently, several studies have investigated the oral microbiome through saliva samples in patients with CD based on the disease characteristics8,9. Several oral mucosal diseases, including aphthous ulcers and stomatitis, are frequently found in CD patients and are suggested to be associated with disease activities10,11. As salivary sample collection has the advantage of being safer, easier, and less uncomfortable for patients compared to other samples, understanding of salivary microbiome will improve patient compliance and expand the view of microbiota in patients with CD. However, a few studies of salivary microbiota have investigated the association between the microbiota in stool, intestinal tissue, and saliva in patients with CD. Therefore, this study aims to comprehend common or
2
unique microbiome patterns among saliva, intestinal tissue biopsy, and stool samples in patients with CD.
3
Materials and Methods
Study Subjects
This prospective study was conducted at Kangbuk Samsung Hospital in Korea from May 2017 to December 2020. Patients aged > 18 years who were diagnosed with CD and undergoing treatment were included. Baseline demographic and clinical characteristics were assessed before sample collection.
Concomitant drug use was evaluated for each patient. Patients who used probiotics and antibiotics affecting the intestinal microbiome within the past three weeks were excluded. Participants have refrained from smoking not only for case-control but also for a part of treatment. The history of disease- related operations included incision and drainage of anal abscess, anal fistulectomy, small bowel resection, and ileocolectomy. The study protocol was approved by an institutional review board (IRB No. 2016-07-029). All participants voluntarily agreed to participate in this study and provided written informed consent.
Sample Collection
The saliva samples (2mL each) were collected using Saliva Collection Kit (Cat. PDX-026, PDXen Biosystems Co., Korea), which can be transported and stored at room temperature(15~30°C). The stool samples were collected by participants (5g each) and stored in a deep freezer (-80°C) immediately after submission. The tissue biopsy samples were refrigerated at 4℃ immediately after being taken from random 5 points of the intestine during endoscopy and stored at -80℃.
DNA Extraction and 16S rRNA Gene Amplification Sequence Processing
To separate the cellular pellet from cell-free supernatant, samples were subjected to centrifugation at 15,000 rpm for 20 minutes at 4℃. QIAamp DNA Microbiome Kit (Qiagen, Valencia, CA, USA) was applied on the pellet following the protocol provided from the manufacturer for DNA extraction.
Amplification of the V3–V4 region of the 16S rRNA gene was done with the 341F (5' TCG TCG GCA GCG TCA GAT GTG TAT AAG AGA CAG CCT ACG GGN GGC WGC AG 3') and 805R (5' GTC TCG TGG GCT CGG AGA TGT GTA TAA GAG ACA GGA CTA CHV GGG TAT CTA ATC C 3') primers with added Illumina adaptor overhang sequences. A magnetic bead-based clean-up system (Agencourt AMPure XP; Beckman Coulter, Brea, CA, USA) was used for amplicon purification.
4
Limited-cycle PCR using Nextera technology was used for indexed library preparation, further cleaned up, followed by pooling at equimolar concentrations. The final library was denatured with 0.2 N NaOH and diluted to 6 pM with a 20% PhiX control. Sequencing was performed on the Illumina MiSeq platform using a 2x300 bp paired-end protocol, according to the manufacturer's instructions.
Bioinformatic and Statistic Analysis
The primary analysis of the obtained sequences was performed, consisting of their demultiplexing with the MiSeqReporter software (Illumina). The paired-end sequences of each sample were exported from the MiSeq system for analysis in the FASTA format.
Quantitative analysis of sequence reads is conducted by Quantitative Insights Into Microbial Ecology 2 (QIIME2) 2021.4.012. Demultiplexed sequences were denoised using DADA213 (via q2-dada2).
Amplicon sequence variants (ASVs) were aligned through an align-to-tree-mafft-fasttree pipeline consisting of q2-alignment MAFFT14, and q2-phylogeny FastTree215 that are provided by QIIME2.
Alpha diversity metrics (observed features, Faith's phylogenetic diversity16, evenness, chao1, and Shannon entropy), and beta diversity metrics (weighted UniFrac17, unweighted UniFrac18, Jaccard distance, and Bray-Curtis dissimilarity) were estimated using q2-diversity after samples were rarefied (subsampled without replacement) 7841 sequences per sample.
Taxonomy was assigned to ASVs using the q2-feature-classifier19 classify-sklearn naïve Bayes taxonomy classifier against the Silva 138 99% OTUs full-length sequences20. The difference in microbiome profile among saliva, stool, and tissue was visualized by Uniform Manifold Approximation and Projection (UMAP)21 and Linear Discriminant Analysis (LDA) effect size (LEfSe).22
5
Results
Baseline Characteristics
A total of 49 patients were enrolled in this study. Table 1 shows the baseline demographic and clinical characteristics of all participants. The microbiome of saliva, tissue, and stool (noted as saliva, tissue, and stool “samples groups” from now on) were compared in the same patients. Demultiplexed sequence counts distributed as: minimum 1; median 97,956; mean 132,029; and maximum 1,270,567; and 19,408,300 in total. DADA2 trimming was done in the standard of Phred quality score 35 for 5' end, and 25 for 3' end for each direction of sequence reads; 15-288 positions in forwarding reads and 6-223 positions in reverse reads. Twenty-five samples (24 from tissue, one from stool) were filtered out before alpha and beta diversity analysis due to having fewer feature counts than sampling depth 7841, determined based on the balance of enough level of rarefaction and minimizing sample loss.
6
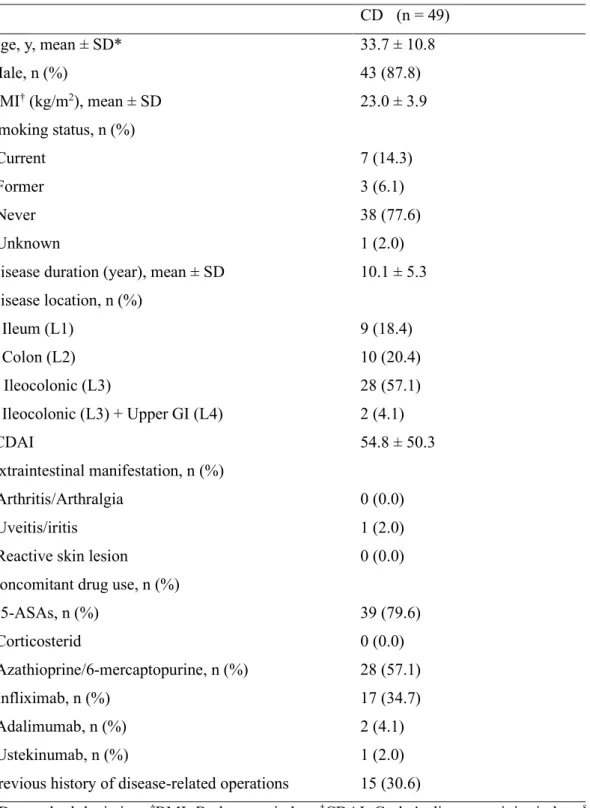
Table 1: Baseline Demographic and Clinical Characteristics of Participants CD (n = 49)
Age, y, mean ± SD* 33.7 ± 10.8
Male, n (%) 43 (87.8)
BMI† (kg/m2), mean ± SD 23.0 ± 3.9
Smoking status, n (%)
Current 7 (14.3)
Former 3 (6.1)
Never 38 (77.6)
Unknown 1 (2.0)
Disease duration (year), mean ± SD 10.1 ± 5.3 Disease location, n (%)
Ileum (L1) 9 (18.4)
Colon (L2) 10 (20.4)
Ileocolonic (L3) 28 (57.1)
Ileocolonic (L3) + Upper GI (L4) 2 (4.1)
‡CDAI 54.8 ± 50.3
Extraintestinal manifestation, n (%)
Arthritis/Arthralgia 0 (0.0)
Uveitis/iritis 1 (2.0)
Reactive skin lesion 0 (0.0)
Concomitant drug use, n (%)
§5-ASAs, n (%) 39 (79.6)
Corticosterid 0 (0.0)
Azathioprine/6-mercaptopurine, n (%) 28 (57.1)
Infliximab, n (%) 17 (34.7)
Adalimumab, n (%) 2 (4.1)
Ustekinumab, n (%) 1 (2.0)
Previous history of disease-related operations 15 (30.6)
*SD, standard deviation; †BMI, Body mass index; ‡CDAI, Crohn's disease activity index; §5-ASA, 5- aminosalicylic acid
7
Overview of taxonomic distribution Alpha Diversity
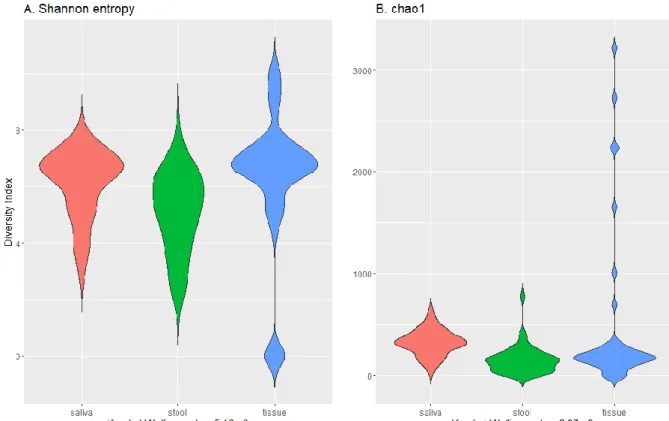
The tissue sample group showed the most varied result in terms of Shannon entropy and chao1 indexes with widely spread values (Figure 1 the highest maximum (over 3000) and median in chao1, and the highest maximum and median in Shannon entropy). Kruskal-Wallis p-value calculated 5.16e-9 for Shannon entropy and 2.97e-9 for chao1, which indicates a statistically significant difference in the median of each sample group.
Figure 1: Alpha diversity of microbiome in saliva, tissue, and stool of CD patients
8
Beta Diversity
Boxplots of unweighted UniFrac (Figure 2) also make common results from alpha diversity. The higher internal distances (means: saliva 0.4, stool 0.5, tissue 0.8) of members and the highest distance between groups (means: saliva-stool 0.6, saliva-tissue 0.9, stool-tissue 0.9) are found in the tissue sample group.
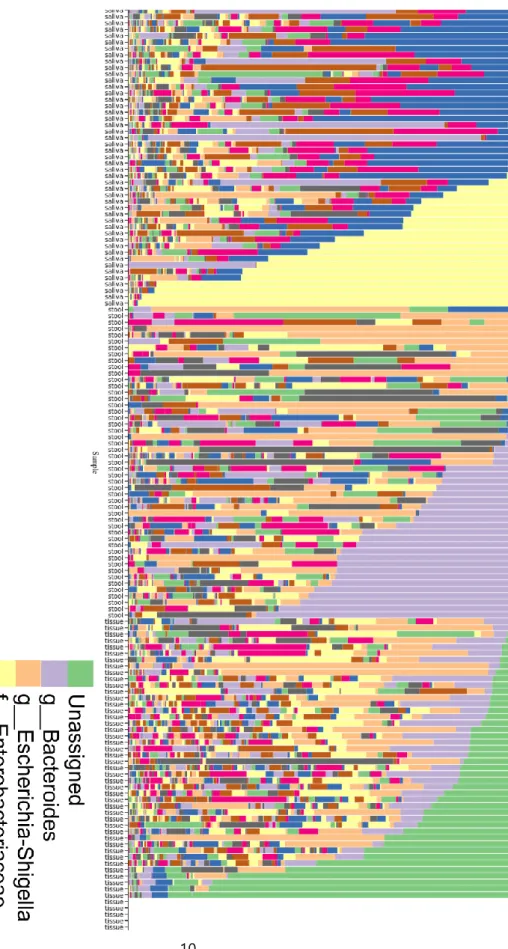
Taxonomy Distribution
These results from diversity analysis agree with the taxonomy distribution plotted in Figure 3; the most abundant OTU in the tissue sample group is ‘unassigned’, indicating a mixture of unidentified bacteria.
Five samples from the tissue sample group were filtered out and resulted in empty in the bar plot due to the low quality of the sequence.
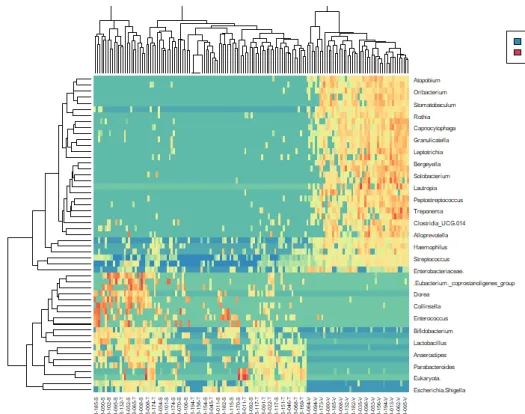
Cluster Visualization
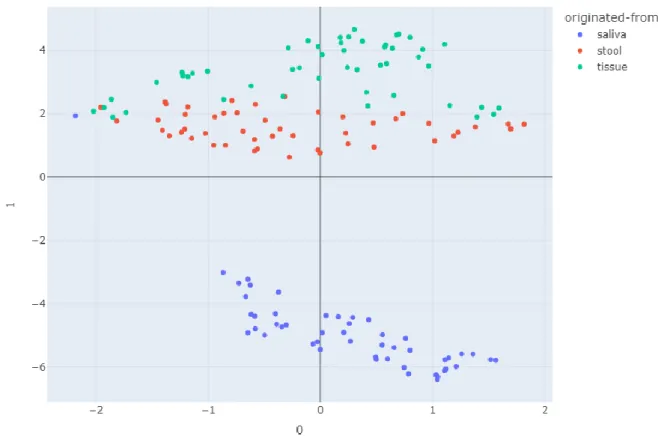
Normalized abundances of each OTUs among samples were projected on UMAP (Figure 4) and heatmap (Figure 5) based on values that were calculated by the natural log of raw OTU counts plus one pseudo count, resulting in a clearly separated saliva sample group from stool and tissue groups. Unlike the diversity levels of each group, the strains of OTU came out to their environmental condition; tissue and stool sample groups neighboring each other in the intestines are similar, different from the saliva sample group from the oral cavity.
9
Figure 2: Beta diversity; unweighted UniFrac distances of microbiome in saliva, tissue, and stool of CD patients
10
Figure 3: Taxonomy bar plot of microbiome in saliva, tissue, and stool of CD patients
11
Figure 4: UMAP of microbiome cluster in saliva, tissue, and stool of CD patients
12
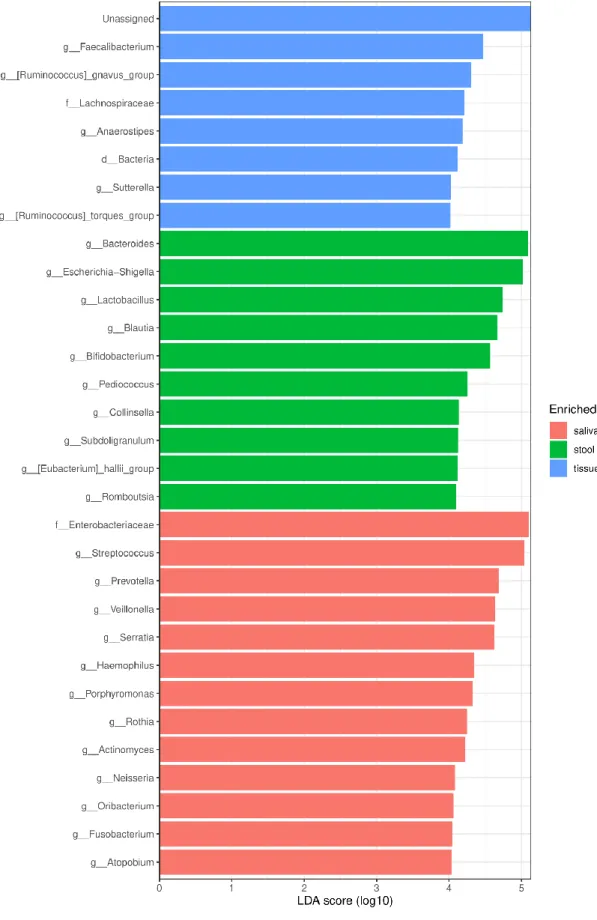
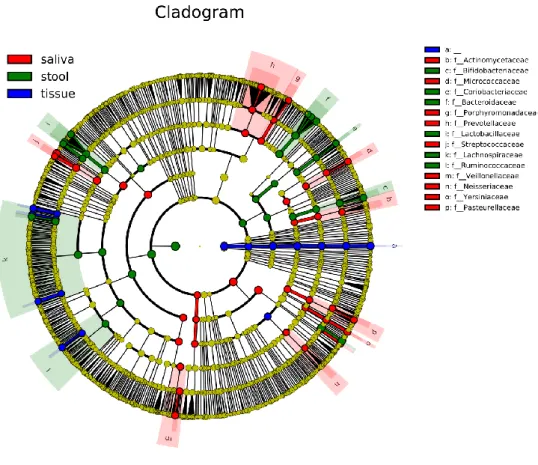
Quantitative and Phylogenic Analysis
The histogram of LEfSe result shows OTUs with LDA score over 4.0, and p-values of the Kruskal- Wallis test and Wilcoxon test are less than 0.05 for each group (Figure 6). ‘Unassigned’, which takes the most remarkable part in tissue samples in this histogram, shows it affected the various other analysis results. Streptococcus and Prevotella in saliva and Bacteroides and Escherichia-Shigella genera in stool are marked. Those genera are also marked as representative identities for upper families - Streptococcaceae, Prevotellaceae, and Bacteroidaceae- in cladogram (Figure 7).
The most relatively abundant 20 genera from saliva, stool, and tissue are listed in Table 2. in order of relative abundance. Figure 8 is a Venn diagram of those 20 genera showing inclusion relationship, and the names of elements are listed in Table 3. Prevotella and Streptococcus were observed all over saliva, stool, and tissue commonly, making them thought to be considered biomarker candidates for diagnosis or prognosis of CD.
Figure 5: Heatmap of microbiome cluster in saliva, tissue, and stool of CD patients
13
Figure 6: LDA histogram of microbiome in saliva, tissue, and stool of CD patients
14
Figure 7: Cladogram of microbiome in saliva, tissue, and stool of CD patients
15
Figure 8: Venn diagram of top 20 abundant genera in microbiome in saliva, tissue, and stool of CD patients
16 Table 2a: Top 20 abundant genera in saliva sample
Genus Rate of containing samples* Total relative abundance**
Streptococcus 97.96% 16.97%
Prevotella 100.00% 8.23%
Serratia 22.45% 7.01%
Veillonella 97.96% 6.74%
Haemophilus 87.76% 3.46%
Porphyromonas 85.71% 3.12%
Rothia 91.84% 2.59%
Actinomyces 93.88% 2.42%
Neisseria 77.55% 1.90%
Fusobacterium 81.63% 1.80%
Oribacterium 91.84% 1.65%
Enterobacter 24.49% 1.63%
Atopobium 93.88% 1.53%
Pseudomonas 8.16% 1.36%
Gemella 91.84% 1.35%
Campylobacter 91.84% 1.11%
Capnocytophaga 91.84% 1.02%
Granulicatella 89.80% 1.01%
Peptostreptococcus 89.80% 0.97%
TM7x 73.47% 0.97%
*: The proportion of samples where one or more OTU counts were detected
**: Means of relative abundances of each OTU for samples
17 Table 2b: Top 20 abundant genera in tissue samples
Genus Rate of containing samples* Total relative
abundance**
Escherichia Shigella 83.67% 13.56%
Bacteroides 87.76% 9.09%
Faecalibacterium 81.63% 4.24%
Ruminococcus gnavus group 63.27% 2.64%
Anaerostipes 59.18% 2.35%
Bifidobacterium 69.39% 2.22%
Lactobacillus 51.02% 1.92%
Blautia 53.06% 1.72%
Sutterella 59.18% 1.65%
Ralstonia 51.02% 1.62%
Ruminococcus torques group 44.90% 1.43%
Prevotella 63.27% 1.24%
Parabacteroides 61.22% 1.12%
Cutibacterium 48.98% 1.00%
Lachnoclostridium 40.82% 0.99%
Fusicatenibacter 42.86% 0.98%
Clostridium sensu stricto 1 42.86% 0.89%
Fusobacterium 40.82% 0.83%
Dorea 38.78% 0.74%
Intestinibacter 28.57% 0.73%
18 Table 2c: Top 20 abundant genera in stool samples
Genus Rate of containing samples* Total relative abundance**
Bacteroides 73.47% 18.59%
Escherichia Shigella 77.55% 15.09%
Lactobacillus 53.06% 8.16%
Blautia 79.59% 6.92%
Bifidobacterium 67.35% 6.01%
Pediococcus 22.45% 2.93%
Faecalibacterium 53.06% 2.86%
Collinsella 34.69% 2.07%
Eubacterium hallii group 44.90% 1.87%
Ruminococcus gnavus group 57.14% 1.84%
Romboutsia 42.86% 1.78%
Subdoligranulum 30.61% 1.60%
Prevotella 26.53% 1.49%
Agathobacter 30.61% 1.37%
Enterococcus 44.90% 1.34%
Streptococcus 55.10% 1.29%
Lachnoclostridium 48.98% 1.10%
Dorea 42.86% 1.07%
Anaerostipes 51.02% 1.06%
Ruminococcus torques group 36.73% 1.05%
19
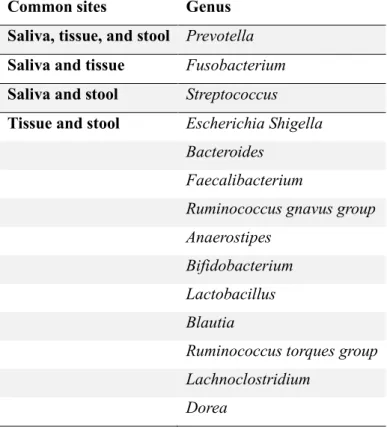
Table 3a: Common genera within top 20 abundant among saliva, tissue, and stool
Common sites Genus
Saliva, tissue, and stool Prevotella Saliva and tissue Fusobacterium Saliva and stool Streptococcus Tissue and stool Escherichia Shigella
Bacteroides Faecalibacterium
Ruminococcus gnavus group Anaerostipes
Bifidobacterium Lactobacillus Blautia
Ruminococcus torques group Lachnoclostridium
Dorea
20
Table 3b: Exclusive genera within top 20 abundant among saliva, tissue, and stool Exclusive sites Genus
Saliva Serratia Veillonella Haemophilus Porphyromonas Rothia
Actinomyces Neisseria Oribacterium Enterobacter Atopobium Pseudomonas Gemella Campylobacter Capnocytophaga Granulicatella Peptostreptococcus TM7x
Tissue Sutterella Ralstonia Parabacteroides Cutibacterium Fusicatenibacter
Clostridium sensu stricto 1 Intestinibacter
Stool Pediococcus
Collinsella
Eubacterium hallii group Romboutsia
Subdoligranulum Agathobacter Enterococcus
21
Discussion
This study observed taxonomic distributions in CD patients' saliva, tissue, and stool. The bacterial community of intestinal tissue and stool samples was similar. Diversity shows no significant difference between the two groups, and they are not separated in UMAP. 11 of the top 20 microbiota were common in both tissue and stool samples. However, as expected, the saliva sample group is significantly distinct from them. The microbial community of saliva was separated from those of tissue and stool. The top 20 microbiota that accounted for a high proportion of each sample were also evaluated. As shown in Table 2, major species of microbiota and their compositions are also significantly different. However, several species occupied a relatively major proportion in each sample. Prevotella was found in common in three types of samples. Streptococcus and Prevotella are abundant in both saliva and stool, which can be confirmed in pairwise LDA histograms (Figure 9~11). And they are markedly identified in the saliva sample group compared to the stool and tissue sample group. Fusobacterium is found in both saliva and stool samples.
Streptococcus and Prevotella were considered the main species associated with dysbiosis in the salivary microbiota in patients with IBD23,24. Prevotella, gram-negative obligate anaerobe, is commensal microbiota prevalent in the gastrointestinal tract, from the oral cavity to the anus. Previous studies reported a decreased abundance of Streptococcus and increased abundance of Prevotella compared to healthy controls and suggested that these changes in oral microbiota may be associated with immune disorders in the pathogenesis of IBD8. The role of Prevotella in human health and disease remains unclear. Still, an increased abundance of Prevotella species in the gut has been reported in various inflammatory diseases, such as bacterial vaginosis, rheumatoid arthritis, esophagitis, and gastritis25–27. Although it has not yet been fully established, prior studies have noted several inflammatory cascades that Prevotealla species are involved in25.
Prevotella activates Toll-like receptor 2, which drives immune response by producing inflammatory cytokines such as interleukin-23 (IL-23). Another pathway is direct stimulation of epithelial cells to produce cytokines promoting T helper type 17 (Th17) associated immune response and neutrophil recruitment. Adhering to the host cell membrane and destroying them through bacterial substances is also suggested as one of their inflammatory reactions28. It was shown that some species of Prevotella induced colitis in mice25, and an increased abundance of Prevotella at colonic biopsy samples was identified in patients with IBD compared with healthy controls29. Salivary Prevotella is oral biofilm- forming bacteria and has commonly been reported as one of the main taxa which are increased in abundance in patients with IBD8,30,31. They also correlated with inflammatory biomarkers including
22
immunological cytokines8,30, and recently, it was suggested that salivary Prevotella might serve as a biomarker in CD compared to patients with UC and healthy controls8. This study is consistent with previous research and demonstrated that Prevotella is a universally abundant taxon in saliva, intestinal tissue, and stool in patients with CD. Interestingly, the relative abundance of Prevotella in the salivary sample is prominent compared to the tissue and stool samples. This result implicates the potential role of salivary Prevotella in patients with CD.
Streptococcus is oral commensal bacteria and known as the most abundant bacteria forming dental biofilm with the ability of binding and coaggregating other microorganisms using surface32 molecules.
However, some species of Streptococcus are known to have an anti-inflammatory effect and are considered oral protective probiotics33. Depletion of salivary Streptococcus in patients with IBD was found in previous research, and abundance of salivary Streptococcus was reported to be negatively correlated with not only serum inflammatory markers such as white blood cell and C-reactive protein8, but also inflammatory cytokines8,30. One of the Streptococcus species was found in both stool and saliva samples in other previous studies similar to this study34.
Fusobacterium was commonly found in saliva and stool samples. Fusobacterium was reported as one of the salivary indicators of the CD when compared to patients with UC, and healthy controls35,36. Including Prevotella, Streptococcus, and Fusobacterium, most bacterial species identified in common between samples were already known to have compositional changes in each saliva, tissue, and stool sample in patients with IBD. It is noteworthy that these bacteria overlap between samples. Further studies with more focus on this result are recommended.
There are several limitations to this study. First, the relatively small sample size may be a potential for bias. Second, most patients were in mild disease status when samples were collected. Third, factors affecting the microbiome, such as diet, were not controlled before collecting samples. Fourth, the results of this study do not explain the correlation between salivary microbiota and stool or tissue microbiota.
Lastly, this research only covered CD patients without comparable healthy controls. These data, therefore, need to be interpreted with caution. However, only a few studies have evaluated the differences in the microbiome of saliva, stool, and tissue in patients with IBD. This study analyzed all saliva, stool, and tissue samples demonstrated their differences, and identified bacteria commonly found between samples. Further large-scale studies considering factors associated with the microbial community are required to validate findings from this research.
There are still many unanswered questions in the field of the microbiome in patients with IBD. This study could help expand the understanding of microbiota in patients with CD and is expected to be used as data for future studies to develop a full picture of the microbiome in CD.
23
Figure 9: Saliva – Stool Pairwise LDA histogram (LDA 2.0)
24
Figure 10: Saliva – Tissue Pairwise LDA histogram (LDA 2.0)
25
Figure 11: Tissue – Stool Pairwise LDA histogram (LDA 1.0)
26
Conclusion
Crohn's disease is a kind of inflammatory bowel disease that affects all over the body. Even beyond the gastrointestinal tract, by extraintestinal manifestations. Yet the significant cause is not examined. This research approached CD through microbiota from the oral cavity and intestines, taking samples from saliva, tissue biopsy, and stool. Streptococcus and Prevotella were found as major in abundance and statistically significant common genera among microbiome from saliva, tissue biopsy, and stool through analysis. Since saliva has a beneficial aspect in obtaining and managing samples from patients, further research examining those common genera that might be diagnostic or prognostic biomarkers would pioneer a more convenient way for CD patients and doctors who diagnose and cure them.
27
References
(1) Danese, S.; Fiocchi, C. Ulcerative Colitis. http://dx.doi.org/10.1056/NEJMra1102942 2011, 365 (18), 1713–1725. https://doi.org/10.1056/NEJMRA1102942.
(2) Ungaro, R.; Mehandru, S.; Allen, P. B.; Peyrin-Biroulet, L.; Colombel, J. F. Ulcerative Colitis. Lancet 2017, 389 (10080), 1756–1770. https://doi.org/10.1016/S0140-6736(16)32126- 2.
(3) Mizoguchi, E.; Low, D.; Ezaki, Y.; Okada, T. Recent Updates on the Basic Mechanisms and Pathogenesis of Inflammatory Bowel Diseases in Experimental Animal Models. Intest Res 2020, 18 (2), 151–167. https://doi.org/10.5217/ir.2019.09154.
(4) Pittayanon, R.; Lau, J. T.; Leontiadis, G. I.; Tse, F.; Yuan, Y.; Surette, M.; Moayyedi, P.
Differences in Gut Microbiota in Patients With vs Without Inflammatory Bowel Diseases: A Systematic Review. Gastroenterology 2020, 158 (4), 930-946.e1.
https://doi.org/10.1053/J.GASTRO.2019.11.294.
(5) Manichanh, C.; Rigottier-Gois, L.; Bonnaud, E.; Gloux, K.; Pelletier, E.; Frangeul, L.;
Nalin, R.; Jarrin, C.; Chardon, P.; Marteau, P.; Roca, J.; Dore, J. Reduced Diversity of Faecal Microbiota in Crohn’s Disease Revealed by a Metagenomic Approach. Gut 2006, 55 (2), 205–
211. https://doi.org/10.1136/GUT.2005.073817.
(6) Franzosa, E. A.; Sirota-Madi, A.; Avila-Pacheco, J.; Fornelos, N.; Haiser, H. J.; Reinker, S.;
Vatanen, T.; Hall, A. B.; Mallick, H.; McIver, L. J.; Sauk, J. S.; Wilson, R. G.; Stevens, B. W.;
Scott, J. M.; Pierce, K.; Deik, A. A.; Bullock, K.; Imhann, F.; Porter, J. A.; Zhernakova, A.; Fu, J.; Weersma, R. K.; Wijmenga, C.; Clish, C. B.; Vlamakis, H.; Huttenhower, C.; Xavier, R. J.
Gut Microbiome Structure and Metabolic Activity in Inflammatory Bowel Disease. Nature Microbiology 2018 4:2 2018, 4 (2), 293–305. https://doi.org/10.1038/s41564-018-0306-4.
(7) Vavricka, S. R.; Brun, L.; Ballabeni, P.; Pittet, V.; Prinz Vavricka, B. M.; Zeitz, J.; Rogler, G.; Schoepfer, A. M. Frequency and Risk Factors for Extraintestinal Manifestations in the Swiss Inflammatory Bowel Disease Cohort. Am J Gastroenterol 2011, 106 (1), 110–119.
https://doi.org/10.1038/AJG.2010.343.
(8) Qi, Y.; Zang, S.; Wei, J.; Yu, H.; Yang, Z.; Wu, H.; Kang, Y.; Tao, H.; Yang, M.; Jin, L.;
Zen, K.; Wang, F. High-Throughput Sequencing Provides Insights into Oral Microbiota Dysbiosis in Association with Inflammatory Bowel Disease. Genomics 2021, 113 (1, Part 2), 664–676. https://doi.org/https://doi.org/10.1016/j.ygeno.2020.09.063.
(9) Read, E.; Curtis, M. A.; Neves, J. F. The Role of Oral Bacteria in Inflammatory Bowel
28
Disease. Nature Reviews Gastroenterology and Hepatology. Nature Research October 1, 2021, pp 731–742. https://doi.org/10.1038/s41575-021-00488-4.
(10) Plauth, M.; Jenss, H.; Meyle, J. Oral Manifestations of Crohn’s Disease. An Analysis of 79 Cases. J Clin Gastroenterol 1991, 13 (1), 29–37. https://doi.org/10.1097/00004836- 199102000-00008.
(11) Pittock, S.; Drumm, B.; Fleming, P.; McDermott, M.; Imrie, C.; Flint, S.; Bourke, B. The Oral Cavity in Crohn’s Disease. J Pediatr 2001, 138 (5), 767–771.
https://doi.org/10.1067/MPD.2001.113008.
(12) Bolyen, E.; Rideout, J. R.; Dillon, M. R.; Bokulich, N. A.; Abnet, C. C.; Al-Ghalith, G. A.;
Alexander, H.; Alm, E. J.; Arumugam, M.; Asnicar, F.; Bai, Y.; Bisanz, J. E.; Bittinger, K.;
Brejnrod, A.; Brislawn, C. J.; Brown, C. T.; Callahan, B. J.; Caraballo-Rodríguez, A. M.;
Chase, J.; Cope, E. K.; da Silva, R.; Diener, C.; Dorrestein, P. C.; Douglas, G. M.; Durall, D.
M.; Duvallet, C.; Edwardson, C. F.; Ernst, M.; Estaki, M.; Fouquier, J.; Gauglitz, J. M.;
Gibbons, S. M.; Gibson, D. L.; Gonzalez, A.; Gorlick, K.; Guo, J.; Hillmann, B.; Holmes, S.;
Holste, H.; Huttenhower, C.; Huttley, G. A.; Janssen, S.; Jarmusch, A. K.; Jiang, L.; Kaehler, B. D.; Kang, K. bin; Keefe, C. R.; Keim, P.; Kelley, S. T.; Knights, D.; Koester, I.; Kosciolek, T.; Kreps, J.; Langille, M. G. I.; Lee, J.; Ley, R.; Liu, Y. X.; Loftfield, E.; Lozupone, C.;
Maher, M.; Marotz, C.; Martin, B. D.; McDonald, D.; McIver, L. J.; Melnik, A. v.; Metcalf, J.
L.; Morgan, S. C.; Morton, J. T.; Naimey, A. T.; Navas-Molina, J. A.; Nothias, L. F.;
Orchanian, S. B.; Pearson, T.; Peoples, S. L.; Petras, D.; Preuss, M. L.; Pruesse, E.;
Rasmussen, L. B.; Rivers, A.; Robeson, M. S.; Rosenthal, P.; Segata, N.; Shaffer, M.; Shiffer, A.; Sinha, R.; Song, S. J.; Spear, J. R.; Swafford, A. D.; Thompson, L. R.; Torres, P. J.; Trinh, P.; Tripathi, A.; Turnbaugh, P. J.; Ul-Hasan, S.; van der Hooft, J. J. J.; Vargas, F.; Vázquez- Baeza, Y.; Vogtmann, E.; von Hippel, M.; Walters, W.; Wan, Y.; Wang, M.; Warren, J.; Weber, K. C.; Williamson, C. H. D.; Willis, A. D.; Xu, Z. Z.; Zaneveld, J. R.; Zhang, Y.; Zhu, Q.;
Knight, R.; Caporaso, J. G. Reproducible, Interactive, Scalable and Extensible Microbiome Data Science Using QIIME 2. Nature Biotechnology 2019 37:8 2019, 37 (8), 852–857.
https://doi.org/10.1038/s41587-019-0209-9.
(13) Callahan, B. J.; McMurdie, P. J.; Rosen, M. J.; Han, A. W.; Johnson, A. J. A.; Holmes, S.
P. DADA2: High-Resolution Sample Inference from Illumina Amplicon Data. Nat Methods 2016, 13 (7), 581–583. https://doi.org/10.1038/NMETH.3869.
(14) Katoh, K.; Standley, D. M. MAFFT Multiple Sequence Alignment Software Version 7:
Improvements in Performance and Usability. Molecular Biology and Evolution 2013, 30 (4), 772–780. https://doi.org/10.1093/MOLBEV/MST010.
29
(15) Price, M. N.; Dehal, P. S.; Arkin, A. P. FastTree 2 – Approximately Maximum-Likelihood Trees for Large Alignments. PLOS ONE 2010, 5 (3), e9490.
https://doi.org/10.1371/JOURNAL.PONE.0009490.
(16) Faith, D. P. Conservation Evaluation and Phylogenetic Diversity. Biological Conservation 1992, 61 (1), 1–10. https://doi.org/10.1016/0006-3207(92)91201-3.
(17) Lozupone, C. A.; Hamady, M.; Kelley, S. T.; Knight, R. Quantitative and Qualitative Beta Diversity Measures Lead to Different Insights into Factors That Structure Microbial
Communities. Appl Environ Microbiol 2007, 73 (5), 1576–1585.
https://doi.org/10.1128/AEM.01996-06.
(18) Lozupone, C.; Knight, R. UniFrac: A New Phylogenetic Method for Comparing Microbial Communities. Appl Environ Microbiol 2005, 71 (12), 8228–8235.
https://doi.org/10.1128/AEM.71.12.8228-8235.2005.
(19) Bokulich, N. A.; Kaehler, B. D.; Rideout, J. R.; Dillon, M.; Bolyen, E.; Knight, R.;
Huttley, G. A.; Gregory Caporaso, J. Optimizing Taxonomic Classification of Marker-Gene Amplicon Sequences with QIIME 2’s Q2-Feature-Classifier Plugin. Microbiome 2018, 6 (1), 1–17. https://doi.org/10.1186/S40168-018-0470-Z/TABLES/3.
(20) Quast, C.; Pruesse, E.; Yilmaz, P.; Gerken, J.; Schweer, T.; Yarza, P.; Peplies, J.; Glöckner, F. O. The SILVA Ribosomal RNA Gene Database Project: Improved Data Processing and Web- Based Tools. Nucleic Acids Research 2013, 41 (D1), D590–D596.
https://doi.org/10.1093/NAR/GKS1219.
(21) Sainburg, T.; McInnes, L.; Gentner, T. Q. Parametric UMAP Embeddings for Representation and Semisupervised Learning. Neural Comput 2021, 33 (11), 2881–2907.
https://doi.org/10.1162/NECO_A_01434.
(22) Segata, N.; Izard, J.; Waldron, L.; Gevers, D.; Miropolsky, L.; Garrett, W. S.;
Huttenhower, C. Metagenomic Biomarker Discovery and Explanation. Genome Biology 2011, 12 (6), 1–18. https://doi.org/10.1186/GB-2011-12-6-R60/FIGURES/6.
(23) Yamanaka, W.; Takeshita, T.; Shibata, Y.; Matsuo, K.; Eshima, N.; Yokoyama, T.;
Yamashita, Y. Compositional Stability of a Salivary Bacterial Population against Supragingival Microbiota Shift Following Periodontal Therapy. PLOS ONE 2012, 7 (8), e42806.
https://doi.org/10.1371/JOURNAL.PONE.0042806.
(24) Paju, S.; Pussinen, P. J.; Suominen-Taipale, L.; Hyvönen, M.; Knuuttila, M.; Könönen, E.
Detection of Multiple Pathogenic Species in Saliva Is Associated with Periodontal Infection in Adults. Journal of Clinical Microbiology 2009, 47 (1), 235–238.
https://doi.org/10.1128/JCM.01824-08/ASSET/9F6C0BDA-8D4C-4739-A522-
30
340724C97C7B/ASSETS/GRAPHIC/ZJM0010986120002.JPEG.
(25) Larsen, J. M. The Immune Response to Prevotella Bacteria in Chronic Inflammatory Disease. Immunology 2017, 151 (4), 363–374. https://doi.org/10.1111/IMM.12760.
(26) Oakley, B. B.; Fiedler, T. L.; Marrazzo, J. M.; Fredricks, D. N. Diversity of Human Vaginal Bacterial Communities and Associations with Clinically Defined Bacterial Vaginosis.
Applied and Environmental Microbiology 2008, 74 (15), 4898–4909.
https://doi.org/10.1128/AEM.02884-07/SUPPL_FILE/SUPPLEMENTARY_TABLE1.DOC.
(27) Yang, L.; Lu, X.; Nossa, C. W.; Francois, F.; Peek, R. M.; Pei, Z. Inflammation and Intestinal Metaplasia of the Distal Esophagus Are Associated With Alterations in the Microbiome. Gastroenterology 2009, 137 (2), 588–597.
https://doi.org/10.1053/J.GASTRO.2009.04.046.
(28) Gill, T.; Brooks, S. R.; Rosenbaum, J. T.; Asquith, M.; Colbert, R. A. Novel Inter-Omic Analysis Reveals Relationships Between Diverse Gut Microbiota and Host Immune
Dysregulation in HLA–B27–Induced Experimental Spondyloarthritis. Arthritis &
Rheumatology 2019, 71 (11), 1849–1857. https://doi.org/10.1002/ART.41018.
(29) DInakaran, V.; Mandape, S. N.; Shuba, K.; Pratap, S.; Sakhare, S. S.; Tabatabai, M. A.;
Smoot, D. T.; Farmer-DIxon, C. M.; Kesavalu, L. N.; Adunyah, S. E.; Southerland, J. H.;
Gangula, P. R. Identification of Specific Oral and Gut Pathogens in Full Thickness Colon of Colitis Patients: Implications for Colon Motility. Frontiers in Microbiology 2019, 10 (JAN), 3220. https://doi.org/10.3389/FMICB.2018.03220/BIBTEX.
(30) Said, H. S.; Suda, W.; Nakagome, S.; Chinen, H.; Oshima, K.; Kim, S.; Kimura, R.; Iraha, A.; Ishida, H.; Fujita, J.; Mano, S.; Morita, H.; Dohi, T.; Oota, H.; Hattori, M. Dysbiosis of Salivary Microbiota in Inflammatory Bowel Disease and Its Association With Oral
Immunological Biomarkers. DNA Research 2014, 21 (1), 15–25.
https://doi.org/10.1093/DNARES/DST037.
(31) Nijakowski, K.; Surdacka, A. Salivary Biomarkers for Diagnosis of Inflammatory Bowel Diseases: A Systematic Review. International Journal of Molecular Sciences 2020, Vol. 21, Page 7477 2020, 21 (20), 7477. https://doi.org/10.3390/IJMS21207477.
(32) Heller, D.; Helmerhorst, E. J.; Gower, A. C.; Siqueira, W. L.; Paster, B. J.; Oppenheim, F.
G. Microbial Diversity in the Early in Vivo-Formed Dental Biofilm. Applied and
Environmental Microbiology 2016, 82 (6), 1881–1888. https://doi.org/10.1128/AEM.03984- 15/SUPPL_FILE/ZAM999117006SO1.PDF.
(33) Kaci, G.; Lakhdari, O.; Doré, J.; Ehrlich, S. D.; Renault, P.; Blottière, H. M.; Delorme, C.
Inhibition of the NF-ΚB Pathway in Human Intestinal Epithelial Cells by Commensal
31
Streptococcus Salivarius. Applied and Environmental Microbiology 2011, 77 (13), 4681–4684.
https://doi.org/10.1128/AEM.03021-10/SUPPL_FILE/AEM_3021_10_FIG__S1.ZIP.
(34) Hu, S.; Png, E.; Gowans, M.; Ong, D. E. H.; de Sessions, P. F.; Song, J.; Nagarajan, N.
Ectopic Gut Colonization: A Metagenomic Study of the Oral and Gut Microbiome in Crohn’s Disease. Gut Pathogens 2021, 13 (1), 13. https://doi.org/10.1186/s13099-021-00409-5.
(35) Morgan, X. C.; Tickle, T. L.; Sokol, H.; Gevers, D.; Devaney, K. L.; Ward, D. v.; Reyes, J.
A.; Shah, S. A.; LeLeiko, N.; Snapper, S. B.; Bousvaros, A.; Korzenik, J.; Sands, B. E.; Xavier, R. J.; Huttenhower, C. Dysfunction of the Intestinal Microbiome in Inflammatory Bowel Disease and Treatment. Genome Biol 2012, 13 (9), 1–18. https://doi.org/10.1186/GB-2012-13- 9-R79/FIGURES/6.
(36) Papa, E.; Docktor, M.; Smillie, C.; Weber, S.; Preheim, S. P.; Gevers, D.; Giannoukos, G.;
Ciulla, D.; Tabbaa, D.; Ingram, J.; Schauer, D. B.; Ward, D. v.; Korzenik, J. R.; Xavier, R. J.;
Bousvaros, A.; Alm, E. J. Non-Invasive Mapping of the Gastrointestinal Microbiota Identifies Children with Inflammatory Bowel Disease. PLOS ONE 2012, 7 (6), e39242.
https://doi.org/10.1371/JOURNAL.PONE.0039242.
32