INTRODUCTION TO NUMERICAL ANALYSIS
Cho, Hyoung Kyu
Department of Nuclear Engineering
Seoul National University
0. MATLAB USAGE
1. Background
MATLAB
MATrix LABoratory
Mathematical computations, modeling and simulations, data analysis and processing, visualization and graphics, and algorithm development
Standard MATLAB
Toolboxes
Signal processing, symbolic calculations, control system, image processing, etc.
2. Starting with MATLAB
MATLAB download
2. Starting with MATLAB
MATLAB interface
Command window Editor window
Command history window Workspace window
Current directory window
2. Starting with MATLAB
Command window
Commands are typed next to the prompt (>>) and are executed when the Enter key is pressed.
Output generated by the command is displayed in the Command Window,
unless a semicolon ( ; ) is typed at the end.
clc command: clear Command Window
Up-arrow and down-arrow keys (↑ and ↓): recall commands typed before
2. Starting with MATLAB
Command window
Numerical values can be assigned to variables.
Elementary math built-in functions
Ex) sqrt(x)
2. Starting with MATLAB
Built-in elementary math functions
2. Starting with MATLAB
Built-in elementary math functions
2. Starting with MATLAB
Display format
3. Arrays
Arrays
1D array: vector
2D array: matrix
Each number in a vector or a matrix: element
Creating a vector in MATLAB
variable_name=[number; number; number]
“;” is placed!
m : first element
q : spacing
n : last element
Row vector Column vector Row vector with constant spacing
3. Arrays
Arrays
Creating a vector in MATLAB “linspace” command
xi : first element
xf : final element
n : number of elements
3. Arrays
Arrays
Creating a matrix in MATLAB
Variables and mathematical expressions can be used as elements.
Array addressing
3. Arrays
Arrays
Array addressing
3. Arrays
Arrays
Array addressing
Using a colon “: ” in addressing arrays
3. Arrays
Arrays
Built-in functions for handling arrays
size(A,2) size(A,1)
3. Arrays
Strings
A string is an array of characters.
It is created by typing the characters within single quotes.
Strings can include letters, digits, other symbols, and spaces.
Concatenate strings horizontally
strcat : string concatenate!
How can create ‘Nuclear Engineering’ using strcat command?
32 ?
4. Mathematical Operations with Arrays
Addition and subtraction of arrays
4. Mathematical Operations with Arrays
Multiplications of arrays
4. Mathematical Operations with Arrays
Array division (“/”)
Element-by-element operations
4. Mathematical Operations with Arrays
Element-by-element operations
Usefulness of element-by-element operation
For example,
4. Mathematical Operations with Arrays
Built-in functions for handling arrays
5. Script Files
Script file
Program: a file that contains a sequence of MATLAB commands
Extension: “.m” ⇒ M-file
5. Script Files
Script file
Input to a script file
Define the variable and assign it a value in the script file
– File must be edited and the assignment of the variable changed.
Define the variable and assign it a value in the Command Window
5. Script Files
Script file
Input to a script file
Define the variable in the script file but assign a specific value in the Command Window when the script file is executed.
“input” command
5. Script Files
Script file
Output from a script file
“disp” command
“fprintf” command – To Command Window – To a file
New line
→ New line of text file
6. Plotting
Plots in MATLAB
Standard plots with linear axes and logarithmic axes
Bars and stairs plots
“plot” command
With ‘line specifiers’
6. Plotting
Plots in MATLAB
“plot” command
With ‘line specifiers’, labels, title
plot(x,y,'r')
plot(x,y,'*m--')
xlabel('X') ylabel('Y') title('Test')
xlim([0 12]) ylim([0 10]) or
axis([0 12 0 10])
y=[5 10.2 7 8 6 5 3 1];
hold on
plot(x,y,'ob-')
xlabel('X','FontSize',20, … 'FontWeight','bold','Color','r')
vs figure,plot(x,y,’ob-’)
6. Plotting
Plots in MATLAB
“plot3” command
>> t = 0:pi/50:10*pi;
>> st = sin(t);
>> ct = cos(t);
>> figure
>> plot3(st,ct,t)
6. Plotting
Plots in MATLAB
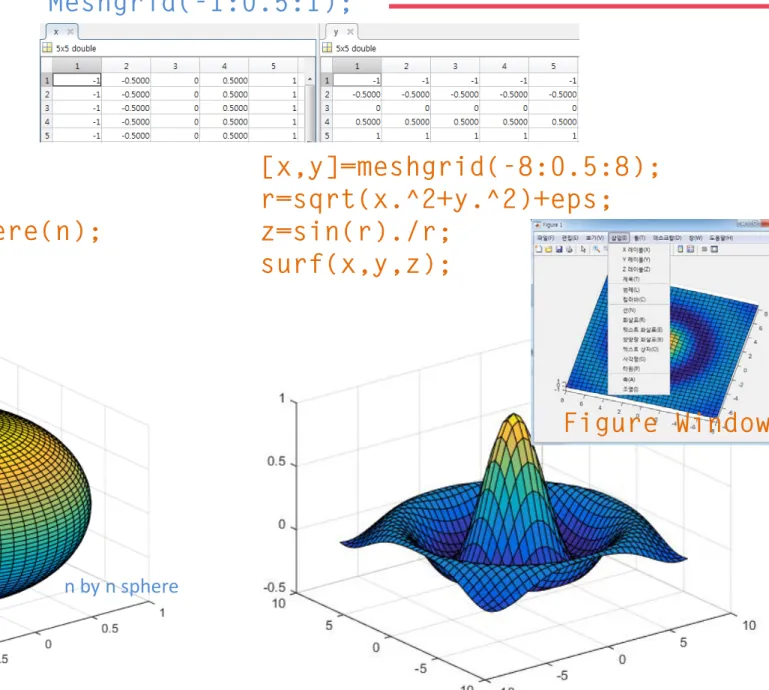
“surf” command
>> k = 6;
>> n = 2^k-1;
>> [x,y,z] = sphere(n);
>> figure
>> surf(x,y,z);
Figure Window
n by n sphere
[x,y]=meshgrid(-8:0.5:8);
r=sqrt(x.^2+y.^2)+eps;
z=sin(r)./r;
surf(x,y,z);
Meshgrid(-1:0.5:1);
7. User-defined Functions and Function Files
User defined function
Arguments
To create user-defined function
Similar with script files
7. User-defined Functions and Function Files
User defined function
Simple example of function
test.m
Command Window
function [result1 result2]=test(a) result1=a+100;
result2=a+200;
[a b]=test(100) a =
200 b = 300
8. Anonymous Functions
Anonymous Functions
Users can define functions in the Command Window, within a script file or inside a user- defined function
cube= @ (x) x^3
circle=@ (x, y) 16*x^2+9*y^2 parabola= @ (x) a*x^2+b*x+c
FA= @ (x) exp(x^2)/sqrt(x^2+5)
>> FA(2) ans =
18.1994
>> z=FA(3) z = 2.1656e+03
9. Function Functions
Function function
Function that accepts a function handle as an input argument
Function handle
Ex) cosHandle=@cos
fhandle=@(x)(2*x);
fplot(fhandle,[0.0,1.0]) hold on
fhandle=@(x)(sin(1.0/x));
fplot(fhandle,[0.0001,1.0]) ylim([-2,2])
10. Programming in MATLAB
Relational and logical operators
>> 4==5 ans = 0
>> 5>10 ans = 0
>> 0||1 ans = 1
>> 0&1 ans = 0
>> 1&5 ans = 1
>> 1||2 ans = 1
>> ~(1||0) ans = 0
10. Programming in MATLAB
Conditional Statements, if-else Structures
if-end
if-else-end
if-elseif-else-end
if-elseif-elseif…-else-end
In a script file,
function test(a) if(a<10)
'less than 0' elseif(a<10)
'greater than 0, less than 10' elseif(a<100)
'greater than 10, less than 100' else
'greater than or equal to 100' end
10. Programming in MATLAB
Loops
for-end
원을 쌓아 구를 그려보길.
function circle(r) n=100;
for i=1:n
theta=2*pi/n*i;
x(i)=r*cos(theta);
y(i)=r*sin(theta);
end
plot(x,y)