2022
First Half
KEEI Korea Energy Demand Outlook
OREA ENERGY ECONOMICS INS TITUTE
Volume 24, No. 1
ISSN 1599-9009
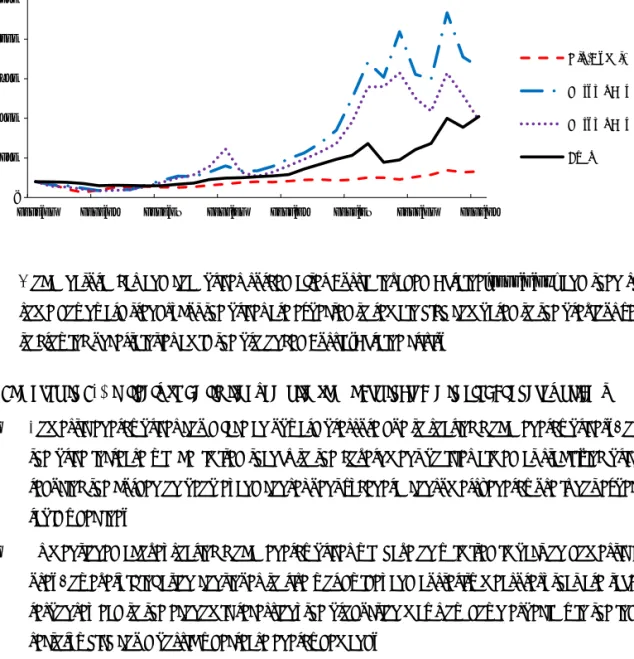
Published by the Korea Energy Economics Institute (KEEI), Energy Demand Outlook takes a closer look at the global energy market and supply and demand trends in domestic energy and examines the outlook for short-term energy demand.
This report outlines the recent changes in the supply and demand of energy and provides important data and policy implications in an effort to contribute to the establishment and adjustment of a series of energy policies by the government.
This report is written by the Energy Outlook Research Team of the Center for Energy Information and Statistics in cooperation with the Energy Supply Statistics Research Team of KEEI and other related research divisions.
Byunguk Kang (Electricity, Heat and Renewables, Transformation) wrote the report with the participation and support of Cherl-Hyun Kim (Economics, Coal, Gas), Seonggyun Kim (Oil).
If you have any further inquiries, please send an email to [email protected] or
call +82-52-714-2241.
1. Total Primary Energy Supply and Total Final Consumption
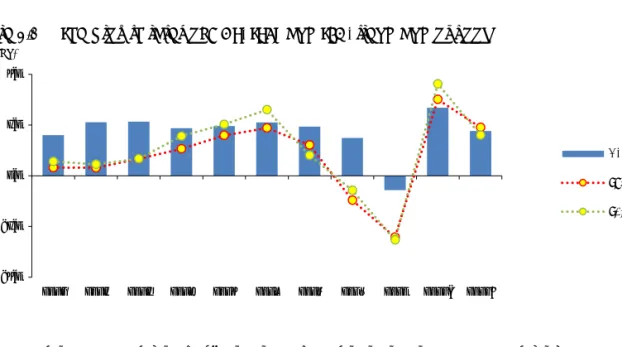
□ The Total Primary Energy Supply(“TPES”) increased by 4.5% year-on-year to 305.3 Mtoe in 2021 with the recovery of economic activities.
o TPES grew at the fastest rate since 2011 (4.9%), as exports and domestic demand increased amid the rapid economic recovery at home and abroad, which led to the growth in production activities of the manufacturing and service sectors.
Figure 1.1 The growth rates of GDP and TPES, production index
Note: Production indexes show year-on-year differences.
□ The use of almost all energy sources increased except nuclear energy, and the increase was mostly led by petroleum and gas.
o Petroleum use rose by 6.9%, which was driven by growing industrial energy use, especially those used as feedstock, owing to the economic recovery and the construction of additional petrochemical facilities, although the growth in transport energy use was stagnant due to the impact of COVID-19.
o Coal use remained flat at the previous year’s level, despite the decent growth in industrial coal use, as it declined in the power generation sector.
-4.0 0.0 4.0 8.0 12.0
- 3 0 3 6 9
2012 2013 2014 2015 2016 2017 2018 2019 2020 2021p
yoy, % Index
Manufacturing Production Index Service Production Index TPES
GDP
Figure 1.2 The growth rate of TPES & contribution by sources
o Natural gas use went up by 8.7% year-on-year, as it surged in the power generation sector due to the increased electricity demand and decreased base load generation, and as it also grew decently in the city gas production sector.
o Nuclear generation fell by 1.4% without any change in its installed capacity, as nuclear capacity factor slightly decreased.
o Renewable and other energy use increased by 5.8%, partly due to the government policies that encourage the deployment of renewable installations.
Figure 1.3 Capacity factors by energy sources and power generation mix
Note: Capacity factor is the ratio of the electrical energy produced to the electrical energy that could have been produced at continuous full power operation.
- 6.0 - 3.0 0.0 3.0 6.0
2012 2013 2014 2015 2016 2017 2018 2019 2020 2021p
yoy(%p, %)
Others (%p) Nuclear (%p) LNG (%p) Petroleum (%p) Coal (%p) TPES (%)
- 20.0 40.0 60.0 80.0 100.0 120.0
2006 2007 2008 2009 2010 2011 2012 2013 2014 2015 2016 2017 2018 2019 2020 2021p
%
Generation share (Coal) Generation share (Nuclear) Generation share (Gas) Capacity factor (Coal) Capacity factor (Nuclear) Capacity factor (Gas)
o Electricity use rose by 4.7% year-on-year, led by the industrial and building sectors; industrial electricity use grew rapidly with stronger production activities; buidlings’ electricity use increased due to the cold spell at the beginning of the year, increased cooling demand during the summer and the recovery of the service sector.
□ The Total Final Consumption(“TFC”) grew by 5.4% year-on-year in 2021, led by a surge in the industrial sector, which accounts for a large share of TFC, although transport energy use remained stagnant.
o Industrial energy use jumped 7.3%, as domestic demand and exports rose fast amid the economic recovery at home and abroad, which led to the increased production in the manufacturing sector, especially large-energy consuming businesses.
o Transport energy use only slightly increased by 0.9%, despite the 1.4% growth in the road transport sector, as it declined in other transport sub-sectors.
Figure 1.4 The growth rate of TFC by end-use sectors
Note: The building sector includes residential, commercial, public-etc usage
o Energy use in buildings posted a year-on-year growth of 3.8%, as it increased in both of the residential and commercial sectors due to the cold spell at the beginning of the year, increased cooling demand during the summer and the stronger service production.
- 10.0 - 5.0 0.0 5.0 10.0
2012 2013 2014 2015 2016 2017 2018 2019 2020 2021p
yoy, %
Industry Transport Building TFC
2. TPES & TFC Outlook
□ TPES is expected to grow by 2.9% year-on-year in 2022 to reach 314.0 Mtoe.
o Since the onset of the COVID-19 pandemic, TPES has been recovering rapidly, posting two consecutive years of growth, and in 2022, it is likely to exceed the previous peak seen in 2018.
Figure 2.1 The growth rates of GDP, TPES and TFC, trend and outlook
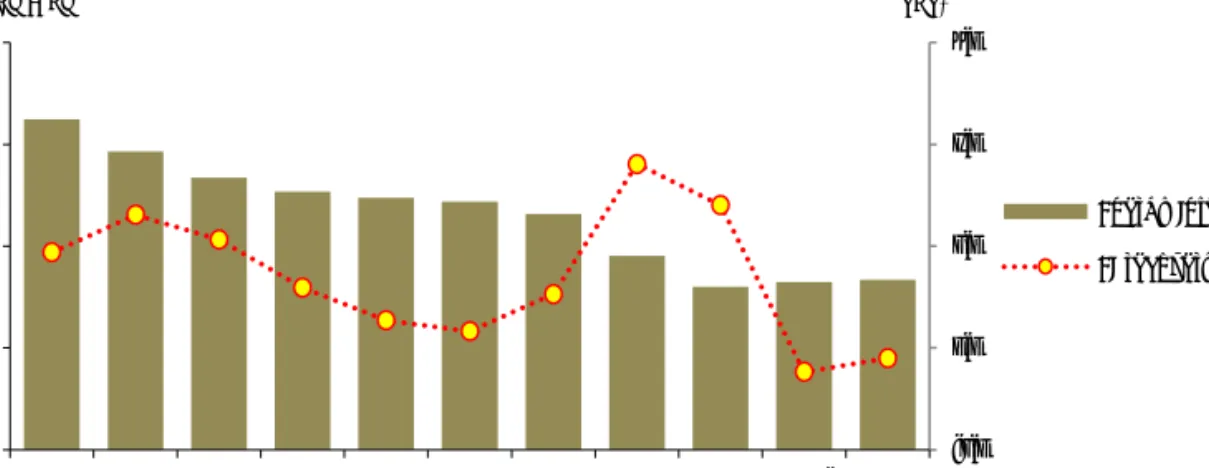
o The rate of TPES growth is expected to be similar to that of the economic growth, and accordingly, energy intensity (toe/ KRW 1 million) will remain at the previous year’s level.
Figure 2.2 Energy Intensity and EI Recovery Trends
Note: Energy Intensity is calculated as the value of ‘TPES/GDP’, expressed in KRW 1 million, EI recovery rate multiplies EI increase rate by ‘-1’.
- 6.0 - 3.0 0.0 3.0 6.0
2012 2013 2014 2015 2016 2017 2018 2019 2020 2021p 2022e
yoy, %
GDP TPES TFC
-2.0 0.0 2.0 4.0 6.0
0.135 0.150 0.165 0.180 0.195
2012 2013 2014 2015 2016 2017 2018 2019 2020 2021p 2022e
yoy, % toe/Million WonEnergy Intensity EI recovery rate
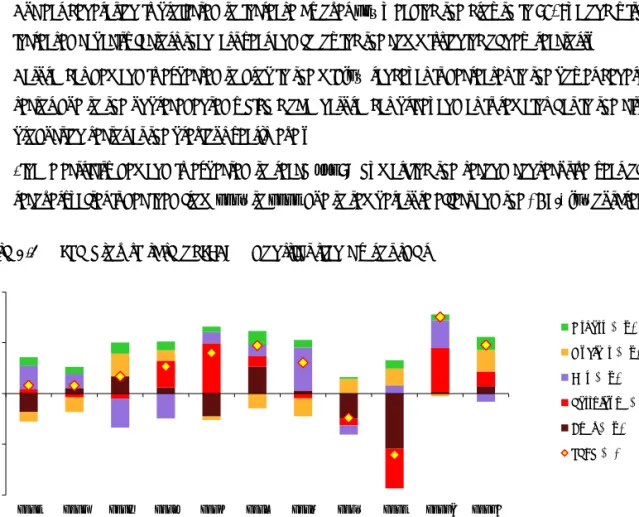
□ Nuclear energy, petroleum and renewable energy will contribute the most to the growth in TPES this year, while gas use is expected to decline especially in the power generation sector.
o Petroleum demand is forecast to grow by around 3%, despite the recent oil price hike, partly because the amount of petroleum used as feedstock increases amid the economic recovery from COVID-19 shocks and following the construction of additional petrochemical facilities.
o Coal demand is set to rebound, despite the stagnant growth in industrial coal use, which was hit by the supply chain crisis, as its demand increases in the power generation sector as a result of the slightly eased restriction on coal-fired generation amid the recent natural gas price hike.
o Nuclear generation is projected to increase by over 10%, leading the growth in TPES, along with the increased capacity factors than last year and following the commissioning of new reactors.
o Natural gas demand is expected to drop in the mid-2% range, as it decreases in the power generation sector due to the unprecedentedly high global natural gas price, and as it remains flat in the city gas production sector at the previous year’s level.
o Final electricity demand is expected to reach 550TWh, marking the second consecutive year of fast recovery, after it declined from 2019 to 2020 due to temperature effect and the COVID-19 outbreak.
Figure 2.3 The growth rate of TPES & contribution by sources
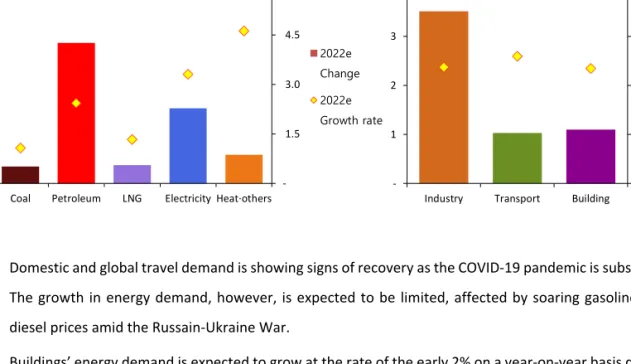
□ Final energy demand by end-users is expected to grow by 2.4% year-on-year to 240.3 Mtoe in 2022.
o Industrial energy demand is forecast to grow by mid-2% amid a strong economic growth, though there are some factors that could increase uncertainties in this outlook, such as the global economic slowdown triggered by the supply chain crisis.
- 6.0 - 3.0 0.0 3.0 6.0
2010 2011 2014 2015 2016 2017 2018 2019 2020 2021p 2022e
%p, %
Others (%p) Nuclear (%p) Gas (%p) Petroleum (%p) Coal (%p) TPES (%)
Figure 2.4 The change and growth rate of TFC by energy sources and end-use sectors
o Domestic and global travel demand is showing signs of recovery as the COVID-19 pandemic is subsiding.
The growth in energy demand, however, is expected to be limited, affected by soaring gasoline and diesel prices amid the Russain-Ukraine War.
o Buildings’ energy demand is expected to grow at the rate of the early 2% on a year-on-year basis due to temperature effect and the recovery of the service sector from the COVID-19 crisis.
- 1.0 2.0 3.0 4.0
- 1 2 3 4
Industry Transport Building yoy, % Mtoe
- 1.5 3.0 4.5 6.0
- 1 2 3 4
Coal Petroleum LNG Electricity Heat·others yoy, % Mtoe
2022e Change 2022e Growth rate
3. Key Features and Implications
Energy Supply Chain Crisis
□ Global energy prices are expected to remain high during the outlook period amid the energy supply chain crisis.
o Global oil price had shown a strong upward move in 2H 2021, as the global economy started to recover from the COVID-19 pandemic. Since then, however, uncertainties surrounding the future oil prices have increased due to a potential global economic recession triggered by the Russian invasion of Ukraine in February 2022.
Table 3.1 International Oil Price Forecast Dot Plot (US$/bbl)
Brent Quarterly Yearly
2022 2Q 2022 3Q 2022 4Q 2023 1Q 2022 2023 2024 2025 2026
130~135 ∙
125~130
120~125 ∙∙∙∙ ∙ ∙ ∙
115~120 ∙ ∙ ∙ ∙
110~115 ∙∙∙∙∙∙∙∙∙∙ ∙∙∙∙ ∙ ∙∙ ∙∙ ∙
105~110 ∙∙∙∙∙∙ ∙∙∙∙∙∙∙∙ ∙∙∙∙∙∙∙ ∙
100~105 ∙∙∙∙∙ ∙∙∙∙∙∙ ∙∙∙∙∙∙∙∙∙∙∙ ∙∙∙ ∙∙∙∙∙∙∙∙∙∙∙∙ ∙∙∙∙
95~100 ∙∙∙ ∙∙∙∙∙ ∙∙∙∙∙∙∙ ∙∙∙ ∙∙∙∙∙∙ ∙∙
90~95 ∙ ∙∙∙ ∙∙∙∙ ∙∙∙∙∙∙∙∙ ∙∙∙∙∙∙ ∙ ∙
85~90 ∙ ∙ ∙∙∙ ∙∙ ∙∙∙ ∙∙∙∙∙∙∙∙ ∙∙∙∙ ∙∙
80~85 ∙ ∙ ∙∙∙∙ ∙∙ ∙∙∙ ∙∙ ∙
75~80 ∙ ∙ ∙ ∙∙∙∙ ∙∙∙∙∙∙∙ ∙∙∙∙ ∙∙∙∙
70~75 ∙ ∙ ∙∙∙∙ ∙∙∙
65~70 ∙ ∙∙∙ ∙ ∙∙
60~65 ∙ ∙ ∙∙∙ ∙∙∙
55~60 ∙ ∙ ∙
50~55 ∙
45~50
Source: Refinitiv Eikon, “Reuters Commodity Polls”(2022.4.29)
o A group of experts reached a consensus on an expectation that oil prices will remain high until 2023 and then stabilize at low level.
o In a shor-term, global oil prices will be largely affected by the Russian-Ukraine war, sanctions on Russia
and the pace of the global economic recovery. In the mid- & long-term, the progress in energy transition
will be a major factor that determines the oil price trend. For instance, if demand for and supply of
fossile fuels decline at the same time throughout the energy transition process, it will have a limited
Figure 3.1 International Energy Price Trend
o Global natural gas and coal prices surged after Russia invaded Ukraine(2022.2.24) and then showed some downward trends, but the prices are expected to remain high compared to the previous year due to growing uncertainties amid the prolonged Russia-Ukraine crisis.
□ The drop in TFC is likely to be limited, despite the sharp increase in global energy prices.
o Domestic energy prices could face an upward pressure due to soaring global energy prices. However, the price increase will be limited thanks to the government policies aimed at stabilizing prices and reducing the burden on people, and consequently, general consumers’ energy use is not expected to rapidly decline.
o As mentioned above, soaring global energy prices will have only limited impact on domestic energy use. However, if inflation continues to rise worldwide, and austerity measures, that are taken as a response, lead to the economic recession, the production may slow down especially in the industrial sector, which could possibly decrease energy demand.
Heat Wave Scenario
□ Electricity demand and supply emerged as a major energy issue for this summer, as a hotter than usual summer is expected.
o Since the extremely hot summer in 2016 and 2018, concerns intensify over scorching heat every summer, and how to respond to growing power demand for cooling is discussed as a major issue of energy demand and supply.
2020.01 2020.05 2020.09 2021.01 2021.05 2021.09 2022.01 2022.05 -
250 500 750 1 000 1 250
Index (2020.01=100)
Oil (Dubai) Natural Gas (TTF) Natural Gas (JKM) Coal
Figure 3.6 Electricity consumption trend in the building sector in summer (Jul-Sep) and cooling degree days
Note: The bottom of the cooling degree day bar of 2021 represents the number of possible cooling degree days assuming the average temperature of last ten years for this summer (‘Base scenario’) while the whole bar graph shows the value assuming that this summer will have the same number of cooling degree days as in 2018 (‘Intensive heat wave scenario’)
o Korea Meteorological Administration(“KMA”) predicted a high possibility of hotter than usual summer(KMA, June 2022) for this year, and therefore, changes in electricity demand needs to be analyzed under the heat wave scenario.
□ If the number of cooling degree days of 2022 is the same as in 2018, the growth rate of electricity demand will be 0.6%p higher compared to the base scenario.
o In the base scenario, the number of cooling degree days is expected to grow by 5.2% year-on-year in 2022, while it is expected to surge by 106.3% in the heat wave scenario, which assumed the same number of cooling degree days (209) recorded in 2018 when the weather was the hottest on record.
o In the heat wave scenario, the residential electricity demand, which is affected the most by heat waves, is forecasted to increase by 5.0% year-on-year in 2022 and by 12.5% in 3Q which includes the summer season.
o In the heat wave scenario, the commercial sector’s electricity demand (including the public sector) is estimated to grow by 3.6% year-on-year in 2022 and by 5.5% in 3Q, which is 0.5%p and 2.0%p higher than the rates in the base scenario.
o The industrial sector is expected to show the smallest change in electricity demand due to temperature change, with its annual electricity demand increasing by just 0.2%p in the heat wave scenario compared to the base scenario.
40 50 60 70 80 90
0 50 100 150 200 250
2015 2016 2017 2018 2019 2020 2021 2022e
degree days TWh
CDD (Intensive heat wave)
CDD (Base scenario)
Electricity consumption
□ If heat waves strike in the midst of the energy supply chain crisis, it is crucial to secure power generation fuels to guarantee energy security.
o If heat waves strike not only Korea but also the entire world this summer
1, the demand for power generation fuels such as coal and natural gas is highly likely to surge, which could exacerbate the current energy supply chain crisis.
o In our base scenario, the total gas-fired generation is to be 36.0 TWh in 3Q. In the heat wave scenario, if the growth rate of electricity demand goes up 0.6%p, the gas-fired generation is expected to grow by 9.8% to 39.5 TWh.
o Securing power generation fuels is far more significant in the energy security aspect, inspite of inflationary conditions caused by soaring fossil fuel prices.
The Main Indicator and Energy Outlook Result
Main Economic and Energy Indicators
2018 2019 2020 2021p 2022e
1H 2H 1H 2H 1H 2H
Economy and Population
GDP (2010 trillion won) 1 812.0 1 852.7 893.5 943.4 1 836.9 928.9 981.9 1 910.7 955.0 1 006.4 1 961.4 Industrial Production(2015=100) 106.3 106.7 103.1 109.8 106.4 112.1 116.6 114.3 116.8 118.4 117.6 Crude Oil Price (Dubai, USD/bbl) 69.4 63.5 40.7 43.8 42.2 63.5 75.0 69.3 99.5 100.0 99.7 Working Days 270.0 272.5 137.0 138.5 275.5 135.5 137.0 272.5 133.5 139.0 272.5
Population (million) 51.6 51.8 51.8 51.8 51.8 51.7 51.7 51.7 51.6 51.6 51.6
Average Temperature (ºC) 13.0 13.5 10.8 15.3 13.0 10.4 16.3 13.3 10.1 16.0 13.1
Cooling Degree days 209.0 120.4 3.5 81.7 85.2 - 101.3 101.3 - 106.6 106.6
Heating Degree days 2 597.8 2 370.9 1 473.4 974.6 2 448.0 1 492.3 912.4 2 404.7 1 576.4 922.6 2 499.0
Energy Indicators
Total Primary Energy Demand (Mtoe) 307.6 303.1 145.5 146.6 292.1 150.2 155.1 305.3 156.1 157.3 313.4 Energy Intensity (toe/million won) 0.170 0.164 0.163 0.155 0.159 0.162 0.158 0.160 0.164 0.156 0.160 TPED/capita (toe/capita) 5.962 5.855 2.807 2.827 5.635 2.903 2.997 5.899 3.024 3.047 6.071 Electricity Generation (TWh) 570.6 563.0 270.1 282.0 552.2 278.8 297.4 576.1 290.4 305.9 596.3 Electricity Generation/capita (MWh/capita) 11.1 10.9 5.2 5.4 10.7 5.4 5.7 11.1 5.6 5.9 11.5 Electricity Demand/capita (MWh/capita) 10.2 10.1 4.9 5.0 9.8 5.1 5.2 10.3 5.3 5.4 10.7
Energy Demand
2018 2019 2020 2021p 2022e
1H 2H 1H 2H 1H 2H
Total Primary Energy Supply
Coal (Mton) 141.1 133.0 55.9 60.7 116.6 54.9 61.9 116.8 56.1 62.9 119.0
Oil (Mbbl) 931.8 927.1 441.1 431.3 872.4 452.7 479.5 932.2 476.9 484.6 961.6
Gas (Bm3) 42.3 41.0 21.2 20.9 42.1 24.1 21.7 45.8 24.0 20.7 44.6
Hydro (TWh) 7.3 6.2 3.2 4.0 7.1 3.4 3.4 6.7 2.8 3.6 6.5
Nuclear (TWh) 133.5 145.9 82.1 78.1 160.2 77.2 80.8 158.0 87.1 89.2 176.3 Other Renewables (Mtoe) 17.1 17.7 9.3 9.6 19.0 10.2 9.9 20.1 11.4 11.1 22.5
Total (Mtoe) 307.6 303.1 145.5 146.6 292.1 150.2 155.1 305.3 156.4 157.6 314.0
Coal 86.7 82.1 34.7 37.6 72.2 34.2 38.3 72.5 34.8 39.0 73.8
Oil 118.5 117.3 55.7 54.6 110.2 57.2 60.6 117.8 59.7 60.7 120.5
Gas 55.2 53.5 27.7 27.3 55.0 31.5 28.3 59.8 31.3 27.0 58.3
Hydro 1.5 1.3 0.7 0.8 1.5 0.7 0.7 1.4 0.6 0.8 1.4
Nuclear 28.4 31.1 17.5 16.6 34.1 16.4 17.2 33.7 18.5 19.0 37.5
Other Renewables 17.1 17.7 9.3 9.6 19.0 10.2 9.9 20.1 11.4 11.1 22.5
Total Final Consumption
Coal (Mton) 49.3 48.2 22.0 23.8 45.8 23.4 24.4 47.8 23.2 25.3 48.4
Oil (Mbbl) 920.0 918.5 438.3 427.5 865.8 448.5 475.1 923.6 473.3 480.6 953.9
Gas (Bm3) 26.3 26.1 14.4 11.6 25.9 15.2 11.8 27.0 15.7 11.7 27.3
Electricity (TWh) 526.1 520.5 252.3 257.0 509.3 261.8 271.6 533.4 271.9 279.1 551.1
Heat (Mtoe) 2.7 2.6 1.6 1.2 2.8 1.7 1.2 2.9 1.8 1.2 3.1
Other Renewables (Mtoe) 9.1 8.9 4.7 4.8 9.5 4.8 4.8 9.6 5.1 5.0 10.0
Total (Mtoe) 233.4 231.4 112.7 109.9 222.6 117.0 117.6 234.7 121.1 119.2 240.3
Coal 32.5 32.1 14.6 15.8 30.5 15.6 16.2 31.8 15.4 16.7 32.1
Oil 116.8 116.1 55.3 54.1 109.3 56.7 60.0 116.7 59.3 60.3 119.6
Gas 27.0 26.9 14.8 11.9 26.7 15.7 12.1 27.8 16.1 12.0 28.1
Electricity 45.2 44.8 21.7 22.1 43.8 22.5 23.4 45.9 23.4 24.0 47.4
Heat 2.7 2.6 1.6 1.2 2.8 1.7 1.2 2.9 1.8 1.2 3.1
Other Renewables 9.1 8.9 4.7 4.8 9.5 4.8 4.8 9.6 5.1 5.0 10.0
Industry 143.5 142.9 69.0 69.0 138.0 72.2 75.8 148.0 75.0 76.5 151.5
Transport 43.0 43.0 19.4 20.1 39.4 19.5 20.3 39.8 19.9 20.9 40.8
Buildings 46.9 45.5 24.3 20.8 45.2 25.3 21.6 46.9 26.1 21.8 48.0
Energy Demand
(yoy, %)
2018 2019 2020 2021p 2022e
1H 2H 1H 2H 1H 2H
Total Primary Energy Supply
Coal (Mton) 1.3 - 5.7 - 11.3 - 13.3 - 12.4 - 1.9 2.1 0.2 2.2 1.6 1.9
Oil (Mbbl) 4.3 - 0.5 - 3.0 - 8.7 - 5.9 2.6 11.2 6.9 5.4 1.1 3.1
Gas (Bm3) - 8.7 - 3.1 - 1.0 6.7 2.7 13.6 3.7 8.7 - 0.5 - 4.7 - 2.5
Hydro (TWh) - 25.9 - 14.1 5.6 22.6 14.4 6.3 - 15.4 - 5.8 - 16.2 8.8 - 3.8
Nuclear (TWh) 5.3 9.3 2.8 18.2 9.8 - 5.9 3.5 - 1.4 12.8 10.4 11.6
Other Renewables (Mtoe) 17.2 3.3 5.4 9.2 7.3 8.9 2.7 5.8 12.0 12.0 12.0
Total (Mtoe) 1.6 - 1.5 - 3.7 - 3.5 - 3.6 3.2 5.8 4.5 4.1 1.6 2.9
Coal 1.2 - 5.3 - 11.0 - 13.0 - 12.1 - 1.4 2.0 0.4 1.8 1.8 1.8
Oil 4.2 - 1.0 - 3.6 - 8.4 - 6.0 2.8 11.0 6.9 4.4 0.2 2.3
Gas - 8.7 - 3.1 - 1.0 6.7 2.7 13.6 3.7 8.7 - 0.5 - 4.7 - 2.5
Hydro - 25.9 - 14.1 5.6 22.6 14.4 6.3 - 15.4 - 5.8 - 16.2 8.8 - 3.8
Nuclear 5.3 9.3 2.8 18.2 9.8 - 5.9 3.5 - 1.4 12.8 10.4 11.6
Other Renewables 17.2 3.3 5.4 9.2 7.3 8.9 2.7 5.8 12.0 12.0 12.0
Total Final Consumption
Coal (Mton) - 0.8 - 2.2 - 8.9 - 1.0 - 4.9 6.4 2.6 4.4 - 1.0 3.3 1.2
Oil (Mbbl) 4.1 - 0.2 - 2.6 - 8.8 - 5.7 2.3 11.1 6.7 5.5 1.2 3.3
Gas (Bm3) - 5.4 - 0.6 - 3.7 3.6 - 0.6 6.1 1.4 4.0 2.8 - 0.6 1.3
Electricity (TWh) 1.3 - 1.1 - 2.9 - 1.4 - 2.2 3.8 5.7 4.7 3.9 2.8 3.3
Heat (Mtoe) 28.7 - 1.3 - 0.7 12.8 4.7 7.0 1.7 4.7 7.0 2.6 5.2
Other Renewables (Mtoe) 23.0 - 2.2 5.0 8.1 6.5 3.4 - 1.0 1.1 4.8 4.1 4.5
Total (Mtoe) 2.3 - 0.9 - 3.5 - 4.1 - 3.8 3.9 7.1 5.4 3.5 1.3 2.4
Coal - 1.0 - 1.3 - 8.5 - 1.5 - 5.0 6.6 2.4 4.4 - 1.4 3.5 1.1
Oil 4.1 - 0.6 - 3.1 - 8.5 - 5.8 2.5 11.1 6.7 4.6 0.4 2.4
Gas - 5.4 - 0.6 - 3.7 3.6 - 0.6 6.1 1.4 4.0 2.8 - 0.6 1.3
Electricity 1.3 - 1.1 - 2.9 - 1.4 - 2.2 3.8 5.7 4.7 3.9 2.8 3.3
Heat 28.7 - 1.3 - 0.7 12.8 4.7 7.0 1.7 4.7 7.0 2.6 5.2
Other Renewables 23.0 - 2.2 5.0 8.1 6.5 3.4 - 1.0 1.1 4.8 4.1 4.5
Industry 0.4 - 0.4 - 2.0 - 4.9 - 3.5 4.7 9.9 7.3 3.9 1.0 2.4
Transport 7.0 0.0 - 9.9 - 6.6 - 8.2 0.7 1.1 0.9 2.3 2.9 2.6
Buildings 4.5 - 3.1 - 2.4 1.4 - 0.7 4.1 3.5 3.8 3.3 1.2 2.3
Energy Demand by Sector
(Mtoe)
2018 2019 2020 2021p 2022e
1H 2H 1H 2H 1H 2H
Industry 143.5 142.9 69.0 69.0 138.0 72.2 75.8 148.0 75.0 76.5 151.5
Coal 32.0 31.8 14.6 15.7 30.2 15.5 16.0 31.6 15.3 16.6 31.9
Oil 69.3 69.2 34.0 32.5 66.5 35.2 38.1 73.2 37.6 38.0 75.5
Gas 11.1 11.4 5.7 5.7 11.4 6.2 6.1 12.2 6.1 5.9 12.0
Electricity 24.4 24.1 11.4 11.7 23.1 12.0 12.3 24.3 12.5 12.6 25.2
Heat - - - -
Other Renewables 6.7 6.4 3.3 3.4 6.7 3.4 3.2 6.6 3.5 3.3 6.8
Transport 43.0 43.0 19.4 20.1 39.4 19.5 20.3 39.8 19.9 20.9 40.8
Coal - - - -
Oil 40.8 40.8 18.4 19.0 37.4 18.5 19.3 37.8 19.0 19.9 38.8
Gas 1.2 1.2 0.5 0.6 1.1 0.5 0.5 1.1 0.5 0.5 1.0
Electricity 0.3 0.3 0.1 0.1 0.3 0.1 0.1 0.3 0.1 0.1 0.3
Heat - - - -
Other Renewables 0.7 0.7 0.3 0.4 0.7 0.4 0.4 0.7 0.4 0.4 0.7
Buildings* 46.9 45.5 24.3 20.8 45.2 25.3 21.6 46.9 26.1 21.8 48.0
Coal 0.4 0.3 0.1 0.2 0.2 0.1 0.1 0.2 0.1 0.1 0.2
Oil 6.8 6.1 2.9 2.5 5.5 3.0 2.7 5.7 2.8 2.4 5.2
Gas 14.7 14.2 8.6 5.6 14.2 9.0 5.5 14.5 9.5 5.6 15.1
Electricity 20.6 20.5 10.1 10.3 20.4 10.4 10.9 21.3 10.8 11.2 22.0
Heat 2.7 2.6 1.6 1.2 2.8 1.7 1.2 2.9 1.8 1.2 3.1
Other Renewables 1.7 1.8 1.0 1.1 2.1 1.1 1.2 2.3 1.2 1.3 2.5
Transform 147.1 143.1 69.2 70.0 139.2 71.4 72.3 143.7 74.9 73.9 148.8
Coal 54.2 50.1 20.0 21.8 41.8 18.6 22.1 40.7 19.4 22.3 41.7
Oil 1.7 1.2 0.4 0.5 0.9 0.5 0.6 1.1 0.4 0.5 0.9
Gas 53.2 50.6 26.0 25.4 51.4 29.8 26.5 56.3 29.6 25.3 54.8
Nuclear 28.4 31.1 17.5 16.6 34.1 16.4 17.2 33.7 18.5 19.0 37.5
Hydro 1.5 1.3 0.7 0.8 1.5 0.7 0.7 1.4 0.6 0.8 1.4
Renewables 8.0 8.8 4.7 4.8 9.5 5.3 5.1 10.5 6.3 6.1 12.5
* include residential, commercial, public∙etc usage
Coal
(Mton)
2018 2019 2020 2021p 2022e
1H 2H 1H 2H 1H 2H
Total Coal Demand 141.1 133.0 55.9 60.7 116.6 54.9 61.9 116.8 56.1 62.9 119.0
Transform 91.8 84.8 33.9 36.8 70.7 31.5 37.5 68.9 32.9 37.7 70.5
Power Generation 91.8 84.8 33.9 36.8 70.7 31.5 37.5 68.9 32.9 37.7 70.5
Heat - - - -
Gas Manufacture - - - -
Total Final Consumption 49.3 48.2 22.0 23.8 45.8 23.4 24.4 47.8 23.2 25.3 48.4
Industry 48.4 47.6 21.8 23.5 45.3 23.3 24.1 47.4 23.0 25.0 48.0
Transport - - - -
Buildings 0.9 0.6 0.2 0.3 0.5 0.2 0.3 0.5 0.2 0.3 0.4
Consumption by products
Anthracite 9.3 7.9 3.3 3.9 7.2 3.4 4.0 7.3 3.7 4.0 7.6
Bituminous 131.8 125.1 52.6 56.8 109.4 51.5 58.0 109.5 52.4 58.9 111.3
Iron making 34.6 35.0 16.3 17.5 33.8 17.6 17.8 35.3 16.9 18.5 35.4
Cement 3.7 4.0 1.7 1.7 3.4 1.7 1.9 3.6 1.7 1.8 3.6
Power Generation 90.8 83.6 33.4 36.4 69.8 31.0 37.0 68.0 32.5 37.3 69.8
Oil
(Mbbl)
2018 2019 2020 2021p 2022e
1H 2H 1H 2H 1H 2H
Total Oil Demand 931.8 927.1 441.1 431.3 872.4 452.7 479.5 932.2 476.9 484.6 961.6
Transform 11.7 8.6 2.8 3.8 6.6 4.2 4.5 8.7 3.6 4.0 7.7
Power Generation 8.6 5.7 1.3 2.5 3.8 1.7 2.4 4.1 0.7 1.1 1.8
Heat 1.1 1.7 0.9 0.7 1.6 0.9 0.8 1.8 1.3 1.8 3.1
Gas Manufacture 2.0 1.2 0.6 0.6 1.2 1.5 1.3 2.8 1.6 1.2 2.8
Total Final Consumption 920.0 918.5 438.3 427.5 865.8 448.5 475.1 923.6 473.3 480.6 953.9 Industry 564.1 566.2 278.5 265.3 543.9 286.8 310.3 597.1 309.2 311.7 620.9 Transport 302.3 303.2 136.0 141.2 277.2 137.0 143.1 280.1 140.2 147.3 287.5
Buildings 53.7 49.1 23.8 20.9 44.7 24.6 21.7 46.4 23.9 21.6 45.5
Consumption by products
Gasoline 79.7 82.7 38.8 42.2 81.0 40.8 44.0 84.9 41.1 44.7 85.8
Diesel (including Transformation) 164.1 166.9 77.4 81.5 158.9 79.4 81.8 161.2 80.8 82.0 162.8 Kerosene (including Transformation) 18.9 17.1 9.4 7.6 17.0 8.8 8.0 16.7 8.7 7.2 16.0 B-C (including Transformation) 33.7 24.0 11.9 11.9 23.8 11.3 11.0 22.3 12.0 10.3 22.3
Jet Oil 39.9 38.8 11.6 10.1 21.7 10.4 10.8 21.2 11.8 15.1 26.9
LPG (including Transformation) 109.4 122.1 60.5 60.8 121.3 61.5 61.9 123.4 71.6 69.6 141.2 Naphtha 451.2 438.6 210.7 194.6 405.3 215.6 235.3 450.9 228.6 231.3 459.9
Other Non-Energy 35.1 36.7 20.8 22.7 43.5 24.9 26.9 51.8 22.4 24.4 46.8
Gas
2018 2019 2020 2021p 2022e
1H 2H 1H 2H 1H 2H
Total Gas Demand (Mton) 42.3 41.0 21.2 20.9 42.1 24.1 21.7 45.8 24.0 20.7 44.6
Transform 40.7 38.8 19.9 19.4 39.3 22.8 20.3 43.1 22.6 19.4 42.0
Power Generation 18.5 17.9 8.7 9.9 18.6 10.9 10.6 21.5 10.0 9.9 19.9
Heat 2.3 1.9 0.9 0.8 1.8 1.1 1.0 2.1 1.1 1.1 2.2
Gas Manufacture 20.0 18.9 10.2 8.7 18.9 10.8 8.7 19.5 11.6 8.3 19.9
City Gas (Bm3) 24.3 23.3 12.7 9.7 22.4 13.6 10.0 23.6 14.0 10.0 24.0
Industry 10.8 11.1 5.5 5.6 11.1 6.0 5.9 11.9 5.9 5.8 11.7
Industrial City Gas 8.8 8.3 3.9 3.7 7.6 4.4 4.1 8.5 4.3 4.1 8.4
Industrial LNG 2.0 2.8 1.6 1.9 3.5 1.6 1.8 3.4 1.7 1.6 3.3
Transport 1.2 1.2 0.5 0.5 1.1 0.5 0.5 1.0 0.5 0.5 1.0
Buildings 14.3 13.8 8.3 5.5 13.8 8.7 5.3 14.1 9.2 5.4 14.6
Electricity
(TWh)
2018 2019 2020 2021p 2022e
1H 2H 1H 2H 1H 2H
Net Electricity Demand 570.6 563.0 270.1 282.0 552.2 278.8 297.4 576.1 290.4 305.9 596.3 Own use and Losses 44.5 42.5 17.9 25.0 42.9 17.0 25.7 42.7 18.4 26.8 45.2
Total Final Consumption 526.1 520.5 252.3 257.0 509.3 261.8 271.6 533.4 271.9 279.1 551.1 Industry 283.7 279.8 133.0 135.7 268.7 139.1 143.3 282.4 145.6 146.9 292.4
Transport 3.0 2.9 1.5 1.6 3.2 1.5 1.6 3.1 1.3 1.7 3.0
Buildings 239.5 237.8 117.8 119.7 237.4 121.2 126.8 247.9 125.0 130.6 255.6
Installed Electrical Capacity (GW)* 118.5 124.6 127.1 128.7 128.7 129.7 133.8 133.8 134.6 139.4 139.4
Coal 37.0 37.0 37.1 36.9 36.9 35.8 37.7 37.7 37.3 38.4 38.4
Oil 4.3 3.9 2.1 2.2 2.2 2.2 2.2 2.2 1.0 1.0 1.0
Gas 37.9 39.4 41.2 41.2 41.2 41.2 41.2 41.2 41.2 42.2 42.2
Nuclear 21.9 23.3 23.3 23.3 23.3 23.3 23.3 23.3 23.3 23.7 23.7
Hydro 6.5 6.5 6.5 6.5 6.5 6.5 6.5 6.5 6.5 6.5 6.5
Other Renewables 11.0 14.6 17.0 18.7 18.7 20.8 23.0 23.0 25.3 27.6 27.6
Electricity Generation of Power
Plants* 570.6 563.0 270.1 282.0 552.2 279.0 297.8 576.7 290.4 305.9 596.3
Coal 238.4 227.4 94.2 102.1 196.3 89.5 108.4 198.0 93.3 109.4 202.8
Oil 5.7 3.3 0.8 1.4 2.3 1.0 1.3 2.4 0.9 0.6 1.5
Gas 153.5 144.4 69.4 76.5 145.9 85.7 82.6 168.3 80.0 77.7 157.7
Nuclear 133.5 145.9 82.1 78.1 160.2 77.2 80.8 158.0 87.1 89.2 176.3
Hydro 7.3 6.2 3.2 4.0 7.1 3.4 3.4 6.7 2.8 3.6 6.5
Other Renewables 32.2 35.9 20.4 19.9 40.3 22.1 21.2 43.3 26.2 25.3 51.4
Fuel Consumption of Power Plants
(Mtoe)* 117.7 115.6 54.4 57.4 111.8 55.6 59.4 115.0 58.0 61.3 119.3
Coal 54.2 50.1 20.0 21.8 41.8 18.6 22.1 40.7 19.4 22.3 41.7
Oil 1.3 0.8 0.2 0.4 0.6 0.2 0.3 0.6 0.1 0.2 0.3
Gas 24.2 23.4 11.4 12.9 24.3 14.3 13.8 28.1 13.0 13.0 26.0
Nuclear 28.4 31.1 17.5 16.6 34.1 16.4 17.2 33.7 18.5 19.0 37.5
Hydro 1.5 1.3 0.7 0.8 1.5 0.7 0.7 1.4 0.6 0.8 1.4
Other Renewables 8.0 8.8 4.7 4.8 9.5 5.3 5.1 10.5 6.3 6.1 12.5
* District Heat is classified by fuel type since 2014
Heat and Other Renewables
(Mtoe)
2018 2019 2020 2021p 2022e
1H 2H 1H 2H 1H 2H
Net Heat Demand 2.6 2.6 1.6 1.2 2.8 1.7 1.2 2.9 1.8 1.2 3.0
Own use and Losses - 0.0 0.0 0.0 0.0 0.0 - 0.0 - 0.0 - 0.0 - 0.0 - 0.0 - 0.0
Total Final Consumption 2.7 2.6 1.6 1.2 2.8 1.7 1.2 2.9 1.8 1.2 3.1
Industry - - - -
Transport - - - -
Buildings 2.7 2.6 1.6 1.2 2.8 1.7 1.2 2.9 1.8 1.2 3.1
Heat Production by fuel
Coal - - - -
Oil 1.7 1.7 1.3 0.9 2.2 1.3 0.9 2.2 1.4 0.9 2.3
Gas 0.9 0.9 0.3 0.3 0.6 0.3 0.3 0.6 0.4 0.3 0.7
Nuclear - - - -
Hydro - - - -
Other Renewables - - - -
Fuel Consumption of District Heat
Coal - - - -
Oil 0.2 0.2 0.1 0.1 0.2 0.1 0.1 0.2 0.2 0.2 0.4
Gas 2.9 2.5 1.2 1.1 2.3 1.4 1.4 2.8 1.4 1.4 2.9
Nuclear - - - -
Hydro - - - -
Other Renewables - - - -
Other Renewables 18.7 19.0 10.0 10.5 20.5 10.9 10.6 21.5 12.0 11.9 23.9
Hydro 1.5 1.3 0.7 0.8 1.5 0.7 0.7 1.4 0.6 0.8 1.4
Transform 8.0 8.8 4.7 4.8 9.5 5.3 5.1 10.5 6.3 6.1 12.5
Total Final Consumption 9.1 8.9 4.7 4.8 9.5 4.8 4.8 9.6 5.1 5.0 10.0
Industry 6.7 6.4 3.3 3.4 6.7 3.4 3.2 6.6 3.5 3.3 6.8
Transport 0.7 0.7 0.3 0.4 0.7 0.4 0.4 0.7 0.4 0.4 0.7
Buildings 1.7 1.8 1.0 1.1 2.1 1.1 1.2 2.3 1.2 1.3 2.5