Week 11, November 14
Life Cycle Assessment (LCA)
Fall 2017
Professor Sung-Hoon Ahn
Department of Mechanical and Aerospace Engineering Seoul National University
Example of LCA - CAR
CV - conventional gasoline vehicle BEV - battery electric vehicle
HYBRID - hybrid vehicle
[1] Deepak R. et al.,Lifecycle Analysis Comparison of a Battery Electric Vehicle and a Conventional Gasoline Vehicle, 2012
CV [1]
HYBRID BEV
LCA - CAR
Ref. Nowsourcing, 2013
Price for car + annual operating costs (Luxury cars)
Price for car + annual operating costs (Affordable midsize cars)
Luxury cars
Mpg (mile per gram)
2013 Gas, Electric & Hybrid car comparison
Affordable midsize cars
LCA in Solar Power Generation System
Calculate and select efficient system using LCA
Power Generation: Solar Panel
Energy Storage: Battery Power Consumption: Light Bulb Required total number of bulbs: 100
or or
In daytime (5 hr)
Quiz :
Select the most efficient system among the different kind of light bulbs after 25 year.
In night time (6 hr)
Bulb)
LED
– Price: 8 USD
– Life time: 15 years – Power : 7.2 W
– 650-700 Lumens
Fluorescent Lamp
– Price: 4 USD
– Life time : 5 years – Power : 14 W
– 700 Lumens
Incandescent Lamp
– Price: 1 USD – Life time: 1 year – Power: 60 W – 700 Lumens
(The power of each bulb is set to have same brightness)
Maintenance Components
Battery
– Price: 380 USD – Life time: 5 years
– Capacity : (12 V, 140 Ahr)
Solar Panel
– Price: 162 USD
– Generation capacity: 120 W/hr – Life time: 20 years
Hint : make the plot of Time vs. Cost
Basic DFE methods: design guidelines
Paper cup Mug cup
VS
Paper Cups
(2 Per Day X 7 Billion X 365) Ceramic Cups
Total Cups 5.1 Trillion 7 Billion
Embodied Energy 2.8 Trillion MJ 98 Billion MJ
Energy per year to wash N/A 919 Billion MJ
Total Energy 2.8 Trillion MJ 1.01 Trillion MJ
Water to produce 2.5 Trillion L N/A
Water per year to wash N/A 2.7 Trillion L
Total water 2.5 Trillion L 2.7 Trillion L
Ref. Institute for lifecycle energy analysis
Basic DFE methods: design guidelines
Product Design (Otto)
Simple and effective when implemented
Consult the guideline for each developed
concept and after embodiment of the concept
Life Cycle Assessment (LCA)
More systematic analysis of a product
Example of cost parameters
Kyoto Protocol
The Kyoto Protocol is a protocol to the United Nations Framework Convention on Climate Change (UNFCCC or FCCC), aimed at
fighting global warming.
Kyoto Protocol participation map as of February, 2012 Green indicates countries that have ratified the treaty
(Annex I & II countries in dark green) Brown = No intention to ratify
Red = Countries which have withdrawn from the Protocol.
Grey = no position taken or position unknown
Kyoto Protocol
The five principal concepts
– Commitments for the Annex I Parties.
(Reduction of greenhouse gases that are legally binding for Annex I Parties).
– Implementation. In order to meet the objectives of the Protocol, Annex I Parties are required to prepare policies and measures for the reduction of greenhouse gases in their respective
countries.
– Minimizing Impacts on Developing Countries by establishing an adaptation fund for climate change.
– Accounting, Reporting and Review in order to ensure the integrity of the Protocol.
– Compliance. Establishing a Compliance Committee to enforce compliance with the commitments under the Protocol.
Carbon footprint
Carbon footprint has historically been defined as "the total set of greenhouse gas (GHG) emissions caused by an organization, event, product or person.
Carbon footprint originates from ecological footprint (developed by Rees and Wackernagel in the 1990s)
Carbon footprint can be measured by undertaking a GHG emissions assessment
The mitigation of carbon footprints through the development of alternative projects (solar or wind energy or reforestation)
represents one way of reducing a carbon footprint. Carbon offsetting.
General principle of LCA
ISO 14040
1. Goal & scope definitions phase
Goal definition
– Why perform LCA?
– Who are the target audiences?
– What is the application of the LCA results?
Scope definition
– Defining product system and setting its boundary – Defining product function and its unit
– Setting data quality requirements and data parameters
Example of crude oil
Simple product
2. Inventory analysis phase
Data collection for input and output
3. Impact assessment phase
• Mandatory elements –classification and characterization
• Optional element – normalization and weighting
Equivalency factor
4. Interpretation phase
Case study of water kettle
Case study of water kettle (2)
Case study of water kettle (3)
LCA in detail
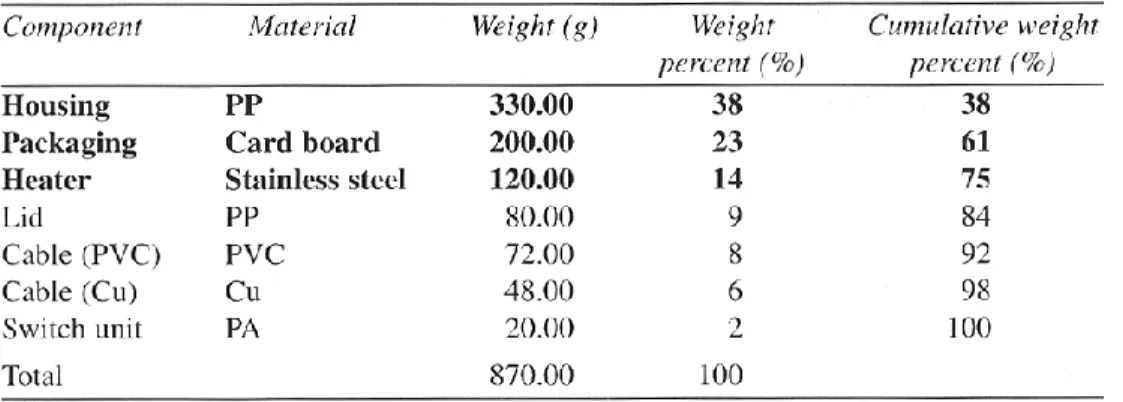
Case study of a water kettle
Product composition
Life cycle data
1. Goal and scope definition
Goal definition
– Why: to generate environmental profile data and to identify key issues of the water kettle
– Who: product designers, developers, and managers within the company, and retail and institutional level consumers as well as B2B consumers in the supply chain
– What: redesign of the reference product
1. Goal and scope definition (2)
Scope definition
– Function
– System boundary
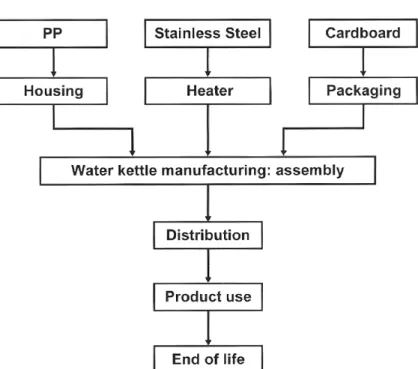
• Table 14, figure 11
Figure 11 Process tree of the water kettle.
1. Goal and scope definition (3)
Data category
2. Life cycle inventory analysis
Data collection
– Preparing for data collection
– Data questionnaire format: table 16
2. Life cycle inventory analysis (2)
Data collection
2. Life cycle inventory analysis (3)
Data base
2. Life cycle inventory analysis (4)
Data computation
2. Life cycle inventory analysis (4)
Data allocation
2. Life cycle inventory analysis (5)
Special case of allocation: recycling
2. Life cycle inventory analysis (6)
Allocation of environmental load
inventory analysis (7) : summary
2. Life cycle inventory analysis (8)
Results of life cycle inventory analysis
3. Life cycle impact assessment
Global warming (GW)
– Greenhouse gases such as CO2 – Kyoto protocol is being ratified
Ozone layer depletion (OD)
– CFC 11 (Freon, a refrigerant)
– Skin cancer and mutation of plants
Acidification (AD)
– Increase in proton or hydrogen ion concentration in water by NOx and SOx
assessment
Eutrophication (EU)
– Increase in nutrient (nitrogen and phosphorous) – Excessive growth of Algae
Photochemical oxidant creation (POC)
– Smog
– Hydrogen carbon from automobile
Abiotic resource depletion (ARD)
– Consumption of non-renewable resources such as crude oil
3. Life cycle impact assessment
Life cycle impact assessment Life cycle inventory
analysis
3. Life cycle impact assessment (2)
Classification
EU: eutrophication
POC: photochemical oxidant
3. Life cycle impact assessment (3)
Cause-effect chain
– Example of acidification
3. Life cycle impact assessment (4)
Typical impact categories
3. Life cycle impact assessment (5)
Characterization factors
3. Life cycle impact assessment (6)
CI = (load of inventory parameter) x (characterized factor of parameter)
3. Life cycle impact assessment (7)
4. Life cycle interpretation
Above 1% impact is considered as a significant issue
4. Life cycle interpretation (2)
Normalization
– N: an impact of an impact category from all the different products in a given geographical region
• Normalization reference of an impact category, g x –eq/(person equivalent-year)
– N = S[(load of a parameter per year) x (characterization factor of the parameter)] / (population size of the geographical region)
Normalized impact
– NI = CI / N
– Represents degree of relative impact caused by the product to the total impact of the geographical region
Normalization enables direct comparison of the magnitude of the impact among different categories
4. Life cycle interpretation (3)
Normalization reference (per person equivalent year) (1995 data)
– GW: 5660 kg CO2-eq – AD: 56.4 kg SO2-eq – EU: 8.9 kg PO43--eq – POC: 7.4 kg ethene-eq – ARD: 18.7 kg/year – (MOCIE 2002)
Table 26
GW: 1500.53 g CO2-eq/5660kg = 265.12 e-6
4. Life cycle interpretation (4)
Weighting
– Assignment of relative significance to the impact categories based on social, ethical, and political values
Weighted impact
– WI = weight of the impact category x NI of the impact category
Weights can be determined by panel members
4. Life cycle interpretation (5)
Weighted impact for each life cycle
Normalized impact in Table 29 x weight
4. Life cycle interpretation (6)
Completeness check
– Identify each stage in the process tree
4. Life cycle interpretation (7)
Sensitivity and consistency check
Eco-design pilot’s assistant
http://www.ecodesign.at/assist/assistent
Raw materials
Raw materials (2)
Raw materials (3)
Carbon Footprint Calculator
http://www.carbonfootprint.com/
0 500 1000 1500 2000 2500 3000
0 1 2 3 4 5 6 7 8 9 10 11 12 13 14 15 16 17 18 19 20 21 22 23 24 25
Total Cost(USD)
Time (year)
Total cost for LED
Total Cost for Fluorescent Lamp
Total Cost for Incandescent Lamp
0 10000 20000 30000 40000 50000 60000
0 1 2 3 4 5 6 7 8 9 10 11 12 13 14 15 16 17 18 19 20 21 22 23 24 25
Total Cost(USD)
Time (year)
Total cost for LED
Total Cost for Fluorescent Lamp
Total Cost for Incandescent Lamp
Total system cost considered (Solar panel, Battery, Light)
Bulb cost considered only
0 500 1000 1500 2000 2500 3000 3500 4000 4500 5000
0 1 2 3 4 5 6 7 8 9 10 11 12 13 14 15 16 17 18 19 20 21 22 23 24 25
Energy (MJ)
Time (year)
Energy consumption
LED
Fluorescent Lamp Incandescent Lamp
Energy consumption Bulb considered only