Article
Geotechnical Property Modeling and Construction Safety Zoning Based on GIS and BIM Integration
Muhammad Shoaib Khan , Jaemin Park * and Jongwon Seo *
Citation: Khan, M.S.; Park, J.; Seo, J.
Geotechnical Property Modeling and Construction Safety Zoning Based on GIS and BIM Integration.Appl. Sci.
2021,11, 4004. https://doi.org/
10.3390/app11094004
Received: 24 March 2021 Accepted: 26 April 2021 Published: 28 April 2021
Publisher’s Note:MDPI stays neutral with regard to jurisdictional claims in published maps and institutional affil- iations.
Copyright: © 2021 by the authors.
Licensee MDPI, Basel, Switzerland.
This article is an open access article distributed under the terms and conditions of the Creative Commons Attribution (CC BY) license (https://
creativecommons.org/licenses/by/
4.0/).
Department of Civil & Environmental Engineering, Hanyang University, Seoul 04763, Korea;
muhammadshoaib5308@gmail.com
* Correspondence: jmpark@kdi.re.kr (J.P.); jseo@hanyang.ac.kr (J.S.)
Abstract:The increase in population and urbanization needs attention towards intense construction activities to meet the social and economic needs. Soil excavation is a primary step in every construc- tion project that needs proper surface and subsurface information modeling since it is vulnerable to construction hazards. Geographic information system (GIS) provides significant information about the existing contextual surface information while building information modeling (BIM) gives information about the asset in a great detail that has been integrated into the construction industry for many applications. However, the integration of BIM and GIS for the subsurface geotechnical property modeling and classification into zones has been rarely explored. This paper presents the integration of BIM and GIS for modeling geotechnical properties and safe construction zones based on soil type.
The use of open standard IFC classes such as IfcBorehole, IfcGeoslice, and IfcGeomodel enhances the collaboration and allows the exchange of geotechnical information among different stakeholders. The method has been applied to the in-situ and laboratory test dataset of the Peshawar, region, to validate the proof of concept. The results demonstrate that the proposed method successfully integrates BIM and GIS providing a three-dimensional surface and subsurface model. The 3D digital geotechnical model has excellent potential to provide information about soil type, properties, depth, and volume of each available soil layer that can be used by construction planners and managers to identify best construction practices and plan for safe construction.
Keywords:GIS; BIM; geotechnical modeling; construction safety; borehole information
1. Introduction 1.1. Background
Urbanization in the world is continuously increasing over the last century. Urban- ization is considered the growth of the population towards cities or suburbs. In 2018, it was estimated that 55% of the world population is living in urban areas and it was projected that by 2050, 68% of the world’s population will be urban dwellers [1,2]. The increase in the population is so rapid; it is becoming a major problem across the world.
These circumstances drive attention towards intense construction activities to meet the social and economic needs. Excavation is a crucial step in infrastructure development projects that includes cutting and filling the soil. However, there has been a significant in- crease in excavation-related accidents which affect project cost, people, and social life [3–5].
Therefore, safety in construction projects is considered a key concern worldwide. Proper modeling and well-managing of the geotechnical properties of the excavation place play an important role in safe construction [6]. The geotechnical properties of the construction site are difficult to predict during the construction stage as it becomes an extremely busy place and working activities are ever-changing. Therefore, safe construction site selection needs to be decided in the planning stage based on on-site geotechnical properties using advanced spatial planning, modeling, and visualization techniques. When the geotechnical properties of the site are known to the project manager, it will be very easy to plan and adopt the safety techniques according to the requirement at the planning stage.
Appl. Sci.2021,11, 4004. https://doi.org/10.3390/app11094004 https://www.mdpi.com/journal/applsci
Appl. Sci.2021,11, 4004 2 of 22
Investigation of the geotechnical properties is an essential step and considered to be a prerequisite to assess the site suitability for the proposed construction, thereby enabling a safe and cost-effective design. Urban geology plays a vital role in the mapping and planning of the geological condition of the cities throughout the world. Within this context, the geotechnical mapping uses geotechnical parameters in establishing a suitable safe construction site. A site investigation is conducted to find the geotechnical parameters such as standard penetration test SPT (N) of the soil and to understand the spatial distribution of the soil layers at the construction site. SPT is an in-situ test that provides information about the geotechnical properties of soil. During the borehole, a thick wall sample tube is driven into the ground with the help of a drop hammer of a 63.5 kg mass through a height of 760 mm that penetrates the sample tube and the soil resistance to the penetration is measured. The number of blows needed to drive the sample tube for the second and third 150 mm penetration Fin the soil out of three consecutive 150 mm penetration is called the SPT (N) [7]. The advantage of using SPT-N information is the simplicity and utilization of its empirical correlation. It can be used to calculate the other geotechnical parameters of soil such as the angle of internal friction, relative density, shear modulus, shear wave velocity, Poisson’s ratio, and shear strength [7–9]. The geotechnical modeling of the construction site can ensure the safe execution of the project and enhancing its feasibility, planning, and design phase [10,11]. Preparation of the geotechnical maps and division into subsequent zones is helpful for the authorities and practitioners as it results in cost and time-saving in the construction projects. The recent increase in the studies using this approach provides an excellent opportunity to utilize the method for improving safety in the construction site [10,12–14].
The geotechnical investigation of the construction site is usually conducted at a certain boring point providing only a one-dimensional profile information having spatial uncer- tainty, which makes it difficult to obtain the geotechnical characteristics at uninvestigated regions. It is therefore essential to estimate the reliable spatial distribution of the subsurface layers. Furthermore, it is indispensable to apply the spatial interpolation technique such as the geostatistical method for the statistical manipulation of the given geotechnical data.
Recently, the spatial interpolation technique has been widely adopted for creating 3D geotechnical models of soil properties [15–18]. The probabilistic and deterministic are two approaches adopted for the geospatial interpolation that uses the point data and inter- polates them to provide information around the whole area. However, the deterministic approach doesn’t take into account the effect of spatial variation with distance. Many studies have utilized geographic information system (GIS) to model, map, integrate, and interpret the geotechnical properties of the site portraying their spatial distribution [10,14].
GIS has been used to produce zonation maps that can be employed to assess hazards and also to determine the suitability of the construction type [14]. Also, GIS capability has been applied frequently in the construction industry for data management and manipu- lation [19]. It is a powerful tool in assessing a huge number of data in a reasonable time.
The key feature of the GIS is the ability to integrate the new information with the existing geographic information using a compatible referencing system.
The integration of GIS and geotechnical parameters is essential considering spatial cor- relation to build and provide digital maps and safety zonation. The multi-scale clustering of the geotechnical properties and zonation maps is very effective in urban areas having low and dense variation in the soil information [20]. The output model obtained from GIS is a georeferenced digitized map, free of inconsistencies, providing continuous information for the whole region, and also attribute information. The recent studies on the use of GIS for spatial data manipulation, compilation, and processing above and below the ground in civil engineering projects have demonstrated its capabilities to ease data interpretation and producing better results [21–24]. The 3D spatial modeling of geotechnical parameters has been conducted to assess and identify the problem encountered during the construction of the Lavrion Technological and Cultural Park [25]. The results of the 3D geotechnical models were useful during the construction to identify the risk-prone areas. The modeling of cone
penetration resistance has been considered to provide high reliability, which facilitates geotechnical engineers in better understanding the site characterization [26].
Data interpretation of the soil profiles and stratigraphy in GIS is conducted in a two or three-dimensional representation. Despite the capability of GIS in creating better geotechnical model results, its information about the asset is less detailed [4]. Advance data visualization tools such as building information modeling (BIM) can be used in integration with GIS to facilitate the management, 3D modeling, and visualization of the geotechnical models [4]. BIM model contains very detailed geometric and semantic information about new or existing assets [27]. BIM provides parametric design tools for the digital repre- sentation of an object that contains graphical and non-graphical information [28,29]. BIM emerges as a platform for model visualization, managing, data exchanging, and sharing building and infrastructure models over the lifecycle. The main focus of the BIM domain is the design and construction information about all the physical elements and contains very detailed and semantic rich information. An algorithm has been developed using visual programming that created automatically the geometric condition in the BIM environment to visualize the potential risks according to Occupational Safety and Health Administration (OSHA) guidelines [3]. OSHA provides standards, assistance, and training about a safe working environment for the workers. While, the GIS domain focuses on the information about existing or captured at different points in time, thereby resulting in less detailed information [30]. The advantage of BIM and GIS integration has been studied in some of the review articles [31–34]. The integration of BIM-GIS domains is widely acknowledged to be a beneficial and crucial step forward towards detailed geotechnical modeling and construction safety zoning.
1.2. Geographic Information System (GIS) and Building Information Modeling (BIM)
Geographic information system (GIS) manages and analyzes the spatial information about assets based on geomatics techniques. GIS is an information technology system that has all the features such as storage of spatial information in the relational database.
GIS stores all the information such as location, spatial, and non-spatial information about a spatial facility in the database that provides a significant advantage in the spatial and temporal analysis [35]. For example, it can store the geotechnical parameter information in a geodatabase that can be used for the spatial distribution for the whole area. For instance, the standard format for exchanging geographical and semantic information for GIS data is City Geography Markup Language (CityGML). CityGML is the open data model and standard format that represent the contextual GIS data in a structured way and can be shared by many application [36].
BIM simulates the physical model in a virtual environment called the building infor- mation model that contains geometric and non-geometric information [37,38]. The BIM model characterizes the graphical model with non-graphical information such as materials information, properties of materials, and the quantities of the materials [38]. By appending this information with the geometry, the engineering analysis can be implemented with ease of decision-making at different stages of the projects [32]. The Industry Foundation Class (IFC) is considered to be an open standard format for exchanging graphical and 3D semantic information for BIM [28,39]. It has an objected-oriented hierarchy containing ge- ometry information with predefined attributes and relationships. In the beginning, the IFC standard targeted building, while it is now extending towards the infrastructure models such as [28] extends the IFC schema for the tunnel infrastructure. The IFC information can be represented with the use of compact and well suited EXPRESS data definition lan- guage [40]. Furthermore, the BIM data representation in IFC format allows the user to view, map, and process the information using IFC viewers or other compatible software [41]. The existing IFC classes and their relationships can be used to store a new type of information under the IfcPropertySet defined in the IFC standard [28,39,42].
BIM model contains detailed information about the object geometry and semantics, however, it lacks the surrounding information [42]. Spatial information is needed in the BIM
Appl. Sci.2021,11, 4004 4 of 22
model such as the topographic information that can be provided by GIS technology [32,43].
The integration of BIM and GIS in construction management is in the initial stages but a fast-developing trend in recent years. BIM and GIS have been integrated for multiple cases such as improving the visualization of supply chain management during construction [44], heritage management [45,46], emergency response and pedestrian route planning [47,48], energy assessment [49], and climate adaption [50]. From previous studies, researchers have put much effort into the integration techniques, and several methods are proposed to address various problems [32,33]. Many researchers have worked on the integration of IFC and GIS model such as CityGML using bi-directional linkage for classes [51,52].
Some of the previous research on the integration of BIM and GIS has been reviewed in the next subsection.
1.3. Previous BIM-GIS Integration
The domain of GIS provides information about existing assets at a different time in a large geographic area, while BIM is merely used for specific construction projects. BIM and GIS were developed for different fields of application. The integrated application of these two systems in the architecture, engineering, and construction (AEC) industry can contribute widely to the practices and theories of sustainable infrastructure [34]. Even though the two systems have overlapping feature, however, it is still very difficult to integrate the system, and transferring the GIS data into BIM is very challenging because of the lack of tools that can successfully manage the BIM data in GIS, differences in data representation schemas, and poorly defined BIM semantics. Three kinds of methods have been adopted in the literature to integrate the two systems [52]: (1) BIM data integration into GIS; (2) GIS data integration into BIM; and (3) integrate BIM and GIS both into a new platform.
Most of the studies have focused on the integration of BIM data into GIS. A 3D se- mantic building model dedicated to urban development was developed by transferring data from BIM industry foundation class (IFC) to GIS (CityGML) [53]. Three software components were developed to integrate BIM information into GIS about geospatial envi- ronment focusing on the site selection and fire response management [54]. In another study, a multi-purpose geometric network model (MGNM) was established to facilitate indoor and outdoor connection for emergency response and pedestrian route planning. Safe route planning in today’s busy urban areas needs comprehensive and consistent information about the existing environment. An ontology-based framework was developed for safe routes to school that collects information from the BIM model and integrated with GIS, which can effectively evaluate the existing walkability [55]. The IFC semantic information was integrated into a CityGML extension called GeoBIM, which concludes the technical transfer of IFC semantic information into CityGML [56]. BIM and GIS have been integrated for indoor spatial analysis. Autodesk Revit was used to model the IFC-based BIM model and exported to ArcGIS using the data interoperability tool [57].
The above studies have focused on the integration of BIM to GIS where information from the BIM model was extracted and integrated with GIS for the different application that shows very effective and positive results. However, there are studies in the literature which integrate GIS information into BIM as GIS contain information about existing or captured facilities in a different time. For example, GIS contains data about the environmental condition that was connected to the BIM for the climatic condition of building analysis [50].
Moreover, GIS has been used to map the supply chain process and a plugin was developed in the BIM, which integrates BIM and GIS that optimizes the construction supply chain management (CSCM) [44]. Also, some studies combine BIM and GIS into a new platform to enhance their abilities and facilitate the construction process. BIM and GIS were connected into a new platform for the district information model (DIM). Revit software was used as a BIM tool and ArcGIS as a GIS tool, which was integrated into Infraworks preserving geometrical and semantic information [58].
BIM and GIS integration has great potential from various aspects that can facilitate to better visualize contextual GIS information in BIM environment, detailed 3D city models, linkage of geography and geometrical information, integration of surface and sub-surface information, and the spatial capability of GIS can support the whole life cycle of the project.
However, the application of BIM and GIS integration are still limited and its use is not fully utilized for the geotechnical modeling and safety zoning for the construction projects.
This paper presents the integration of BIM and GIS for 3D modeling and visualization of geotechnical information and segmentation into zones considering planning for safe construction. The key novelty of this research is the integration of GIS to BIM for the three-dimensional geotechnical parameters modeling and division into safe construction zones. The study provides a detailed novel methodology to combine GIS with BIM, map regional geotechnical parameters, and use this for safe construction zones. Furthermore, the study provides a new concept of utilizing the OSHA soil classification for making safe construction zones that can be used by construction planners and managers to plan the right protective system for worker’s safety in the excavation construction. The use of GIS is obvious for soil mapping, however, its integration with BIM provides the detailed insight to calculate the volume of each sublayer available underground, because it is very important to know the depth of each layer as the safety plan can be changed according to the soil type and condition because an excavation can have a cut through more than one soil type [3,5]. Also, this study attempts to use the entity IfcGeotechnicalAssembly, and their subtypes, IfcBorehole, IfcGeomodel, and IfcGeoslice for the representation of the geotechnical information in BIM. The appropriateness of the proposed method of integrating BIM and GIS for the geotechnical property and safety zoning has been verified using actual geotechnical data of the Peshawar region.
1.4. Scope of Work
The main scope of this paper is to integrate BIM and GIS for the modeling of geotech- nical parameters and use this model for safe construction planning. The GIS technology has been used in this study to spatially interpolate the values and provide geotechnical in- formation along the whole region instead of only boring points as the borehole information provides one-dimensional information about soil condition along the depth having the spatial uncertainty [59]. BIM is integrated with the GIS to facilitate the visualization, details about each subsurface layer, append extra information, and calculate the volume of each soil layer available. The geotechnical investigation data from the in-situ and laboratory tests are used in this study since these tests provide information about the soil properties such as standard penetration test (SPT), cone penetration test (CPT), compressive strength, shear strength, etc., [14,59]. The proposed BIM and GIS integration method is applied to the borehole dataset of the Peshawar region. The application of the proposed BIM and GIS integration provides geotechnical information for the whole region in great detail such as layers type with color code, their distribution, extra semantic properties such as laboratory test parameters information, and the thickness of each layer. Even though the proposed methodology and the results of the geotechnical property modeling can be applied for many purposes, however, the application in the scope of this paper was limited to identify a safe and proper construction type and place for the excavation design according to the OSHA soil classification.
2. Research Methods
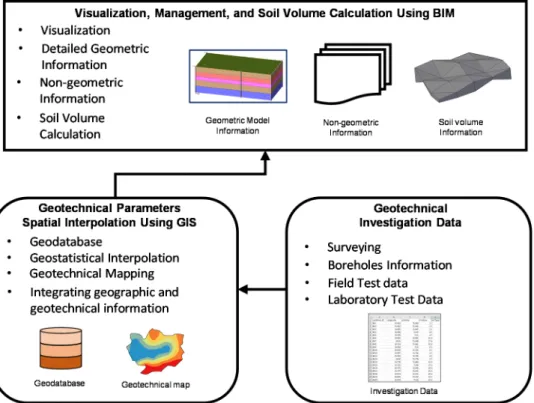
In an effort to support the geotechnical information modeling and safety zoning, integration of BIM and GIS approach is proposed. The steps involved in the proposed method are illustrated in Figure1. The integration of BIM-GIS for the geotechnical property modeling and division into safe construction zones comprises three parts, namely, geotech- nical investigation data collection, three-dimensional spatial interpolation using GIS, and BIM-based visualization, management, and volume calculation. First, to model and evalu- ate the geotechnical properties of the area, the geotechnical investigation data should be
Appl. Sci.2021,11, 4004 6 of 22
surveyed and gathered into a database from the geotechnical and geospatial experts. Any geotechnical parameters obtained from the geotechnical site investigation can be used and not limited to certain parameters. Second, the geospatial interpolation technique is applied using GIS on the collected data to manipulate it statistically for the whole area and combine geographic and geotechnical information in a digital map having a high spatial resolution.
Finally, the geotechnical zonation map is visualized and more parameters are appended to the geotechnical BIM model to enhance its functionality using BIM. Furthermore, the vol- ume of each soil layer is calculated in the BIM environment based on the surface-to-surface method. The spatial interpolation of one-dimension geotechnical investigation data using GIS and its integration with BIM for 3D visualization and management makes it easy and helpful for the practitioners in site selection for safe construction.
Appl. Sci. 2021, 11, x FOR PEER REVIEW 6 of 23
2. Research Methods
In an effort to support the geotechnical information modeling and safety zoning, in- tegration of BIM and GIS approach is proposed. The steps involved in the proposed method are illustrated in Figure 1. The integration of BIM-GIS for the geotechnical prop- erty modeling and division into safe construction zones comprises three parts, namely, geotechnical investigation data collection, three-dimensional spatial interpolation using GIS, and BIM-based visualization, management, and volume calculation. First, to model and evaluate the geotechnical properties of the area, the geotechnical investigation data should be surveyed and gathered into a database from the geotechnical and geospatial experts. Any geotechnical parameters obtained from the geotechnical site investigation can be used and not limited to certain parameters. Second, the geospatial interpolation technique is applied using GIS on the collected data to manipulate it statistically for the whole area and combine geographic and geotechnical information in a digital map having a high spatial resolution. Finally, the geotechnical zonation map is visualized and more parameters are appended to the geotechnical BIM model to enhance its functionality using BIM. Furthermore, the volume of each soil layer is calculated in the BIM environment based on the surface-to-surface method. The spatial interpolation of one-dimension ge- otechnical investigation data using GIS and its integration with BIM for 3D visualization and management makes it easy and helpful for the practitioners in site selection for safe construction.
Figure 1. Concept Overview.
2.1. Geotechnical Investigation Data/Information
The geotechnical investigation of the construction site is necessary for every civil en- gineering and construction project [60]. The site investigation aims to identify the distri- bution of soil layer, groundwater table location, and to know the mechanical and physical characteristics of the site soil. The geotechnical investigation is performed to transfer the nature and behavior of the subsurface information to the designers and managers so they can use it to prepare technical solutions such as planning for the construction or design of the foundation. Information about the soil type, available quantities, and the location of each type of underground geotechnical layer are the key factors to be considered during
Figure 1.Concept Overview.
2.1. Geotechnical Investigation Data/Information
The geotechnical investigation of the construction site is necessary for every civil engineering and construction project [60]. The site investigation aims to identify the distri- bution of soil layer, groundwater table location, and to know the mechanical and physical characteristics of the site soil. The geotechnical investigation is performed to transfer the nature and behavior of the subsurface information to the designers and managers so they can use it to prepare technical solutions such as planning for the construction or design of the foundation. Information about the soil type, available quantities, and the location of each type of underground geotechnical layer are the key factors to be considered during the planning stage of the construction. Furthermore, accurate information about the geological and geotechnical investigation is important regarding the geographic location.
The geotechnical investigation data can be obtained from the results of field tests and laboratory tests. It is the method of gathering, analyzing, managing, and presenting the site geotechnical-related information in the form of geotechnical investigation reports.
The in-situ and laboratory test data provide all the geotechnical information that characterizes the soil. The cone penetration test (CPT), and standard penetration test (SPT) are two widely adopted field tests for the representation of the geotechnical condition [59].
The values of these test data can be obtained from the borehole information. The infor-
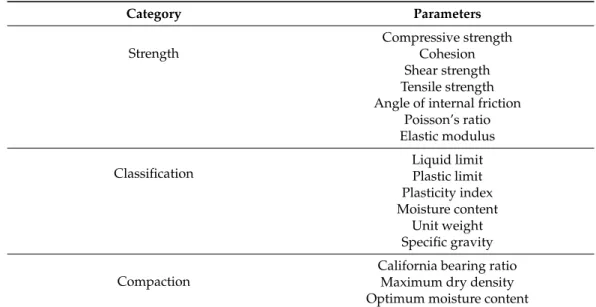
mation obtained from the laboratory test can be divided into different categories such as strength, compaction, and classification. Table1lists all the laboratory test parameters significant to be included that should hold benefits for the users involved in it. In the context of this paper, any geotechnical parameters obtained from the geotechnical site investigation can be used and not limited to certain parameters to develop a geotechnical model. For example, the borehole investigation data used in geotechnical site investigation includes the subsurface geotechnical information such as SPT, water table, etc., can be used to develop a geotechnical model.
Table 1.List of laboratory test parameters considered in this study.
Category Parameters
Strength
Compressive strength Cohesion Shear strength Tensile strength Angle of internal friction
Poisson’s ratio Elastic modulus
Classification Liquid limit
Plastic limit Plasticity index Moisture content
Unit weight Specific gravity Compaction
California bearing ratio Maximum dry density Optimum moisture content
The borehole dataset can be collected from several preselected spatial locations along with different depth intervals. However, it may be required to assess the soil geotechnical properties at the location other than the predefined locations. The geotechnical data analyst is required to assess the data before digital mapping in such a way that a useful and meaningful conclusion can be drawn for practical uses [61]. In this way, the site investigation creates a significant volume of soil information from field tests and laboratory tests. All this information is stored in a database that aids the further processing of the geotechnical property modeling and safety zonation.
2.2. Geotechnical Parameters Spatial Interpolation Using GIS
The collection of the geotechnical information from the borehole dataset is very significant for the geotechnical property modeling and zoning, however, the results of the boreholes are derived at a specific boring point. Boreholes dataset provides one- dimensional information about underground soil thereby causing spatial uncertainties. The metropolitan areas have high variation in geography, geology, and geotechnical information.
The geospatial interpolation technique is applied to the dataset in this part to interpolate the data for the uninvestigated location. The objective of spatial interpolation of the geotechnical information is to determine and provide soil information along the whole area rather than at a single point that can be utilized for planning safe construction zones.
In the data investigation part, any geotechnical parameter can be surveyed or collected, however, the geotechnical parameter data contain only one-dimensional soil information along with the depth. The available geotechnical parameter is spatially interpolated using GIS to provide information around the whole area in this part.
Zoning for safe construction planning based on geotechnical characteristics should be built using the geospatial interpolation method. The geospatial interpolation methods are mainly categorized into two methods, namely, deterministic and geostatistical. The deterministic method such as a triangular irregular network (TIN) and inverse distance
Appl. Sci.2021,11, 4004 8 of 22
weighting (IDW) don’t consider the effect of spatial variation with distance in predicting values at unknown locations and is based on simple empirical or predefined mathematical equations [59]. On the other hand, the geostatistical method such as the kriging method and its variant is very effective across a wide area for interpolating spatial information.
The optimum approach with the highest accuracy should be used for making geotechnical zonation. The probabilistic approaches are ranked to be higher accurate in comparison with the deterministic method for geotechnical property interpolation because of its better uncertainty incorporation [10].
Among the various available geospatial techniques, this approach is employing the kriging method of geostatistical analysis. The kriging technique incorporates the effect of both the distance and direction or degree of variation.
z∗=
∑
n k=1ziλi (1)
The fundamental equation for expressing the kriging method of spatial interpolation is given (1). Wherez* is the estimated value at the unsampled location,ziis the value of know data,λiis the kriging weight, and n shows the number of geotechnical data samples.
ArcGIS is an emerging tool that provides diversified techniques for data interpretation, management, analysis, extrapolation, and interpolation. It provides electronic databases that can store and manage the collected geotechnical parameters. The spatial analysis tool in ArcMap can be utilized to develop geotechnical maps of the study area at different depths.
As the location of the geotechnical investigation site having geotechnical information at the study area is arranged in a mesh grid pattern, the kriging technique can be utilized in the geostatistical analyst toolbox for analysis considering point data information to make a surface representation.
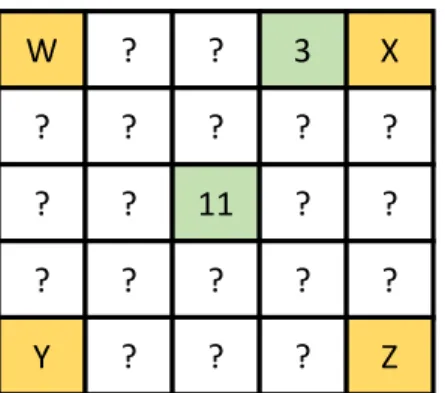
Figure2shows the explanation of the kriging technique adopted in the GIS software for geotechnical property modeling. The values in cells W-Z are predetermined or collected from already available geotechnical data. Linear weight to the known values in these cells is assigned based on their distance and values by the GIS geostatistical analyst tool to predict the unknown value for cell 3. It is now obvious that the value of X gets a higher proportion compared to other cells in the prediction of cell 3 value. Similarly, the weights of the known cells W-Z is considered equal for the prediction of cell 11 value. Thus, a variogram model is generated after statistical interpolation to create the geotechnical surface from these points. The output surface representation is categorized with different colors depicting the characteristics of the underground soil that helps make a critical decision in the future.
Appl. Sci. 2021, 11, x FOR PEER REVIEW 9 of 23
Figure 2. The explanation of kriging analysis employed in ArcGIS for spatial interpolation of ge- otechnical information.
2.3. 3D Visualization, Management, and Soil Volume Calculation Using BIM
This part integrates the digital geotechnical maps developed in the GIS platform with BIM to enhance the visualization of contextual GIS information and enrich each layer with semantic information. The geotechnical model in the BIM platform not only contains de- tailed geometry information about the underground soil but also non-geometric infor- mation. The non-geometric information such as soil type, angle of internal friction, atter- berg limits, etc., with the 3D geotechnical soil model, increases its functionality and ena- bles better control. Furthermore, the volume calculation of each type of soil available in the ground is determined, which is very significant for earthwork projects since it is in- volved in every construction project.
GIS has been employed to develop a surface representation of the geotechnical infor- mation, which is georeferenced with the actual geographic coordinates integrating terrain and below surface information. The georeferencing of the BIM model is necessary before the incorporation of GIS information in BIM for the successful integration. The standard for the BIM model is industry foundation class (IFC), and it is possible to georeferenced IFC file [30]. The use of the IfcSite entity can be selected, which represents the location of the construction area. The coordinates of the real world can be stored in the RefLongitude, RefLatitude, and RefElevation attributes. The attribute longitude and latitude are integer values for degrees, minutes, and seconds, and, optionally, a millionth of seconds with reference to the world geodetic system WGS 84, while the elevation is measured with re- spect to the sea level. Furthermore, it has two more attributes that allow increasing the accuracy of the real-world coordinate to be assigned. The LandTitleNumber assigns a des- ignation to the site within a regional system, and the SiteAddress assigns an address for postal purposes to the site.
The model stores the geotechnical property model in the IFC structure. However, the IFC structure is very generic and contains a lot of information when exported. Therefore, model view definition (MVD), which is a subtype of IFC data containing limited infor- mation that can be used for a specific purpose. Based on the latest version of IFC (IFC 4x3), the paper uses IfcGeotechnicalAssembly, which is the subtype of IfcGeotechnicalElement;
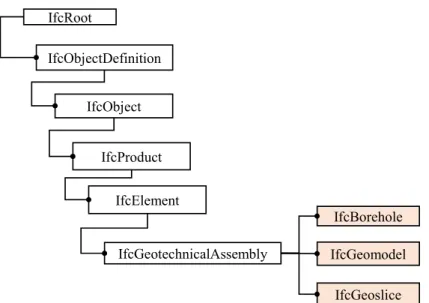
the abstract concept for the representation of the geotechnical or geological properties. As the paper presents the geotechnical information in the form of a borehole, which is the linear profile of soil information, surfaces that present the geotechnical information along the whole area based on the interpolation of borehole point information, and solid repre- sentation containing the volume of the geotechnical model based on the surface-to-surface volume calculation. The IfcGeotechnicalAssembly has three subtypes; including, IfcBorehole, IfcGeomodel, and IfcGeoslice. The linear feature of the borehole can be rep- resented with the use of the IfcBorehole. Furthermore, the IfcGeomodel and IfcGeoslice are utilized for the surfaces, sections, and solid (volumetric) representation. The hierar- chical representation of the entities that have been used in this for the representation of the geotechnical information is illustrated in Figure 3.
W ? ? 3 X
? ? ? ? ?
? ? 11 ? ?
? ? ? ? ?
Y ? ? ? Z
Figure 2. The explanation of kriging analysis employed in ArcGIS for spatial interpolation of geotechnical information.
2.3. 3D Visualization, Management, and Soil Volume Calculation Using BIM
This part integrates the digital geotechnical maps developed in the GIS platform with BIM to enhance the visualization of contextual GIS information and enrich each layer with semantic information. The geotechnical model in the BIM platform not only
contains detailed geometry information about the underground soil but also non-geometric information. The non-geometric information such as soil type, angle of internal friction, atterberg limits, etc., with the 3D geotechnical soil model, increases its functionality and enables better control. Furthermore, the volume calculation of each type of soil available in the ground is determined, which is very significant for earthwork projects since it is involved in every construction project.
GIS has been employed to develop a surface representation of the geotechnical infor- mation, which is georeferenced with the actual geographic coordinates integrating terrain and below surface information. The georeferencing of the BIM model is necessary before the incorporation of GIS information in BIM for the successful integration. The standard for the BIM model is industry foundation class (IFC), and it is possible to georeferenced IFC file [30]. The use of the IfcSite entity can be selected, which represents the location of the construction area. The coordinates of the real world can be stored in the RefLongitude, RefLatitude, and RefElevation attributes. The attribute longitude and latitude are integer values for degrees, minutes, and seconds, and, optionally, a millionth of seconds with reference to the world geodetic system WGS 84, while the elevation is measured with respect to the sea level. Furthermore, it has two more attributes that allow increasing the accuracy of the real-world coordinate to be assigned. The LandTitleNumber assigns a designation to the site within a regional system, and the SiteAddress assigns an address for postal purposes to the site.
The model stores the geotechnical property model in the IFC structure. However, the IFC structure is very generic and contains a lot of information when exported. There- fore, model view definition (MVD), which is a subtype of IFC data containing limited information that can be used for a specific purpose. Based on the latest version of IFC (IFC 4x3), the paper uses IfcGeotechnicalAssembly, which is the subtype of IfcGeotechni- calElement; the abstract concept for the representation of the geotechnical or geological properties. As the paper presents the geotechnical information in the form of a borehole, which is the linear profile of soil information, surfaces that present the geotechnical in- formation along the whole area based on the interpolation of borehole point information, and solid representation containing the volume of the geotechnical model based on the surface-to-surface volume calculation. The IfcGeotechnicalAssembly has three subtypes;
including, IfcBorehole, IfcGeomodel, and IfcGeoslice. The linear feature of the borehole can be represented with the use of the IfcBorehole. Furthermore, the IfcGeomodel and IfcGeoslice are utilized for the surfaces, sections, and solid (volumetric) representation. The hierarchical representation of the entities that have been used in this for the representation of the geotechnical information is illustrated in Figure3.
The BIM tools such as Autodesk Civil 3D supports the georeferencing information required in the IFC file to set the world coordinate system (WCS). The GIS surface informa- tion can be integrated with the help of such tools to visualize the geotechnical surfaces in the BIM environment. The BIM model provides accurate and more detailed information about soil geotechnical information in three-dimensional. It is also possible to calculate the volume of each type of soil in the BIM using the surface-to-surface method. The quantity of each type of soil plays a key role in the planning stage of the construction projects. The surface-to-surface method calculates the volume by overlaying and comparing the surfaces of the same type of soil layer.
Appl. Sci.Appl. Sci. 2021, 11, x FOR PEER REVIEW 2021,11, 4004 10 of 2210 of 23
Figure 3. Abstract supertype for geotechnical entities used in the study for the geotechnical prop- erty representation in BIM.
The BIM tools such as Autodesk Civil 3D supports the georeferencing information required in the IFC file to set the world coordinate system (WCS). The GIS surface infor- mation can be integrated with the help of such tools to visualize the geotechnical surfaces in the BIM environment. The BIM model provides accurate and more detailed information about soil geotechnical information in three-dimensional. It is also possible to calculate the volume of each type of soil in the BIM using the surface-to-surface method. The quan- tity of each type of soil plays a key role in the planning stage of the construction projects.
The surface-to-surface method calculates the volume by overlaying and comparing the surfaces of the same type of soil layer.
3. Implementation on the Peshawar Region Borehole Data 3.1. Study Area and Data Collection
Peshawar is the capital of the one province of Pakistan, Khyber Pakhtunkhwa. It is located in the western Himalayan area at 710°43.4′ N, 330°93.7′ E [62]. Peshawar region is selected for the implementation of the proposed method of integrating BIM and GIS for geotechnical property modeling and zoning. This area is selected due to the availability of the borehole data. Figure 4 illustrates the location of the study area.
Geotechnical exploration data such as boreholes were collected from the soil mechan- ics laboratories and local geotechnical investigation consultants. The boreholes data was collected from the available laboratory testing data distributed all around the study re- gion. Among the in-situ tests, the SPT-N value conducted at multiple intervals along the depth of the borehole to find the variation of soil properties is considered. Also, uncon- fined compressive strength information was collected that shows the strength of the soil.
The total depth of borehole data was 40 m, however, some point data was not available up to 40 m depth (Table 2). The water table information in the study area is also collected.
The water table level varies in the study due to the difference of elevation. So in and around the study area the range of water table level varies.
IfcRoot
IfcObjectDefinition IfcObject
IfcProduct IfcElement
IfcGeotechnicalAssembly
IfcBorehole IfcGeomodel
IfcGeoslice
Figure 3.Abstract supertype for geotechnical entities used in the study for the geotechnical property representation in BIM.
3. Implementation on the Peshawar Region Borehole Data 3.1. Study Area and Data Collection
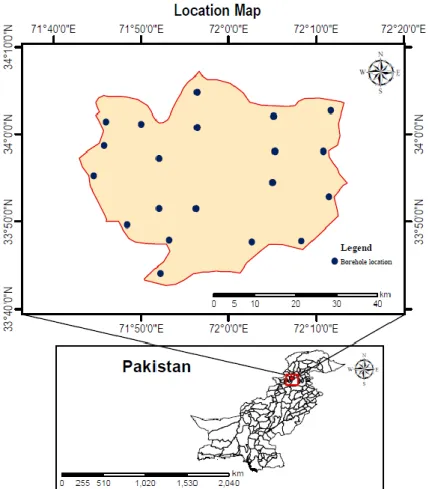
Peshawar is the capital of the one province of Pakistan, Khyber Pakhtunkhwa. It is located in the western Himalayan area at 710◦43.40N, 330◦93.70E [62]. Peshawar region is selected for the implementation of the proposed method of integrating BIM and GIS for geotechnical property modeling and zoning. This area is selected due to the availability of the borehole data. Figure4illustrates the location of the study area.
1
Figure 4 Figure 4.Location map of the study area.
Geotechnical exploration data such as boreholes were collected from the soil mechanics laboratories and local geotechnical investigation consultants. The boreholes data was collected from the available laboratory testing data distributed all around the study region.
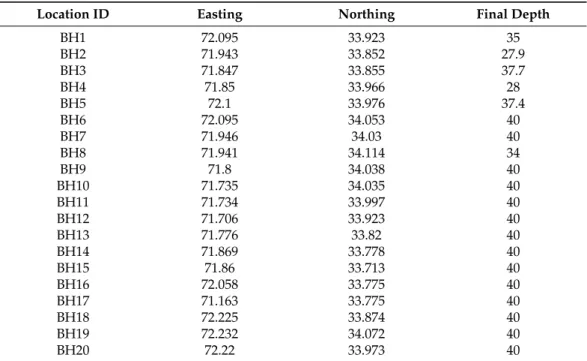
Among the in-situ tests, the SPT-N value conducted at multiple intervals along the depth of the borehole to find the variation of soil properties is considered. Also, unconfined compressive strength information was collected that shows the strength of the soil. The total depth of borehole data was 40 m, however, some point data was not available up to 40 m depth (Table2). The water table information in the study area is also collected. The water table level varies in the study due to the difference of elevation. So in and around the study area the range of water table level varies.
Table 2.The location and final depth of the boreholes.
Location ID Easting Northing Final Depth
BH1 72.095 33.923 35
BH2 71.943 33.852 27.9
BH3 71.847 33.855 37.7
BH4 71.85 33.966 28
BH5 72.1 33.976 37.4
BH6 72.095 34.053 40
BH7 71.946 34.03 40
BH8 71.941 34.114 34
BH9 71.8 34.038 40
BH10 71.735 34.035 40
BH11 71.734 33.997 40
BH12 71.706 33.923 40
BH13 71.776 33.82 40
BH14 71.869 33.778 40
BH15 71.86 33.713 40
BH16 72.058 33.775 40
BH17 71.163 33.775 40
BH18 72.225 33.874 40
BH19 72.232 34.072 40
BH20 72.22 33.973 40
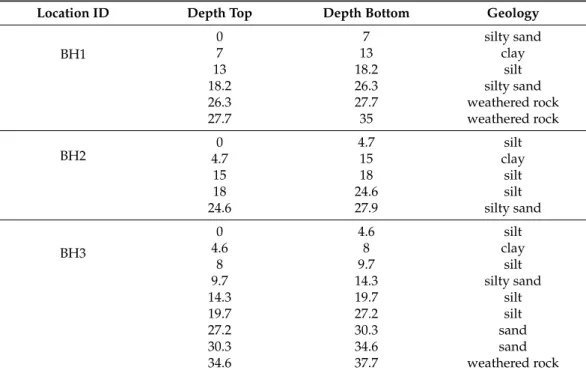
Although this methodology can be adopted for any geotechnical parameter, however, the case study part that shows the implementation of the proof-of-concept of this research uses in-situ test data such as SPT-N information and other laboratory test parameters such as plasticity index and unconfined compressive strength as described in Table1. The authors used SPT-N information, because of the ease of correlation of SPT-N with other geotechnical properties. The proposed method is applied in the Peshawar region, Pakistan where ground response studies such as shear wave velocity profiles are typically calculated using SPT-Vs correlations [8,63]. On the other hand, the study uses geotechnical informa- tion which has been collected from the local consultants. The geotechnical information was easily available with the consultant because almost every building and infrastructure project needs geotechnical investigation data. The SPT-N value is widely used in geotech- nical studies for the representation of the soil condition that can be obtained from the investigated borehole information [59]. The SPT correlation can be used to estimate the geotechnical properties of the soil such as the angle of friction, relative density, and shear modulus [8]. In [7–9], using single soil parameter SPT-N, correlations were developed to estimate the engineering properties of soil such as cohesion, angle of friction, shear wave velocity, and Poisson’s ratio that is helpful and makes it easy for the designers and engineers. The location of boreholes information with the final depth of SPT-N is shown in Table2. The details of some of the boreholes used in this study are presented in Table3.
Appl. Sci.2021,11, 4004 12 of 22
Table 3.Detailed information of some boreholes layer along with the depth.
Location ID Depth Top Depth Bottom Geology
BH1
0 7 silty sand
7 13 clay
13 18.2 silt
18.2 26.3 silty sand
26.3 27.7 weathered rock
27.7 35 weathered rock
BH2
0 4.7 silt
4.7 15 clay
15 18 silt
18 24.6 silt
24.6 27.9 silty sand
BH3
0 4.6 silt
4.6 8 clay
8 9.7 silt
9.7 14.3 silty sand
14.3 19.7 silt
19.7 27.2 silt
27.2 30.3 sand
30.3 34.6 sand
34.6 37.7 weathered rock
A total of 20 boreholes were selected among the dataset that makes a grid pattern throughout the whole region for spatial interpolation. The digital map of the N value of the area can be obtained by applying the kriging technique employing the GIS tool. The SPT-N is defined as the number of blows needed to penetrate a cylindrical sampler up to 30 cm into the ground. However, energy loss occurs during the process of boring. The experimental data collected from the labs and consultant did not incorporate the effect of the energy loss. To calibrate the SPT-N value from the experiments test, the correction formula based on the international standard of 60% efficiency was applied [10,59].
3.2. Geotechnical Parameter Map Generation and Validation
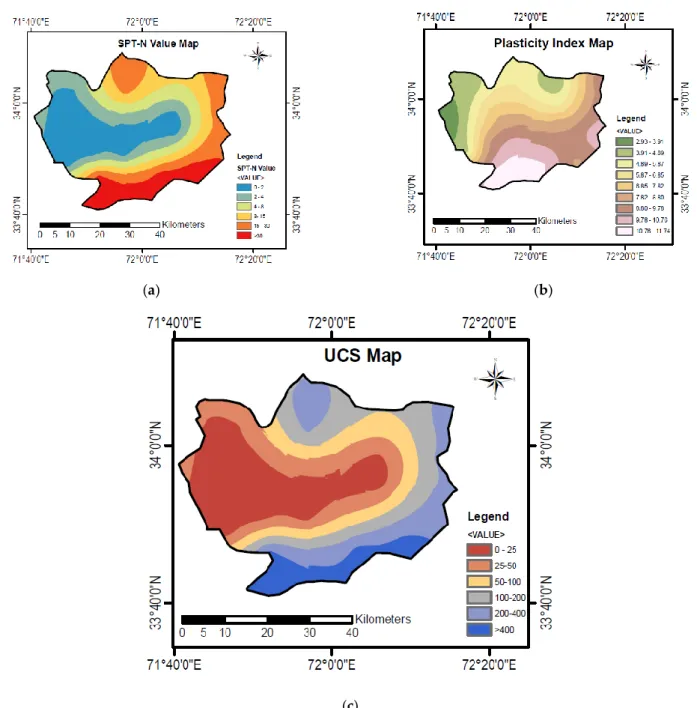
A geodatabase was created in the ArcMap software by incorporating boreholes in- formation before applying a geostatistical approach for interpolation. The 20 borehole dataset used in this study is arranged in a mesh grid pattern that provides at minimum four input data points for cell interpolation. The data provided by consultants include the coordinates of each borehole. The spatial analysis tool in the ArcMap GIS software has been utilized for geotechnical mapping of the study area. The digital mapping employing the GIS tool is based on the procedure explained in Figure2. The digital map presenting the field geotechnical parameter SPT-N value of the area is shown in Figure5a, while Figure5b,c illustrates the variation of laboratory test parameters; plasticity index and unconfined compressive strength. The obtained maps show the variation of the SPT-N value, plasticity index, and unconfined compressive strength all around the study area.
The GIS tools successfully managed and represented the geotechnical information of the area. The representation in the form of digital maps instead of showing in complex tabular form or excel spreadsheet makes it user-friendly and easy to understand. Furthermore, the distribution of the underground information with the geographical location in this way is an innovative approach and provides ready-to-use geotechnical information for the whole area instead of only borehole information that shows geotechnical information along one dimension. The results show that the GIS technique adequately maps the geotechnical parameters that can help the planners and construction manager in the critical decision about safe construction site selection before initiating construction.
2
(a) (b)
(c) Figure 4
Figure 5.Digital map showing the distribution of geotechnical parameters over the study area (a) in-situ parameter SPT-N distribution; (b) Laboratory test parameter plasticity index distribution over the study area; and (c) unconfined compressive strength distribution.
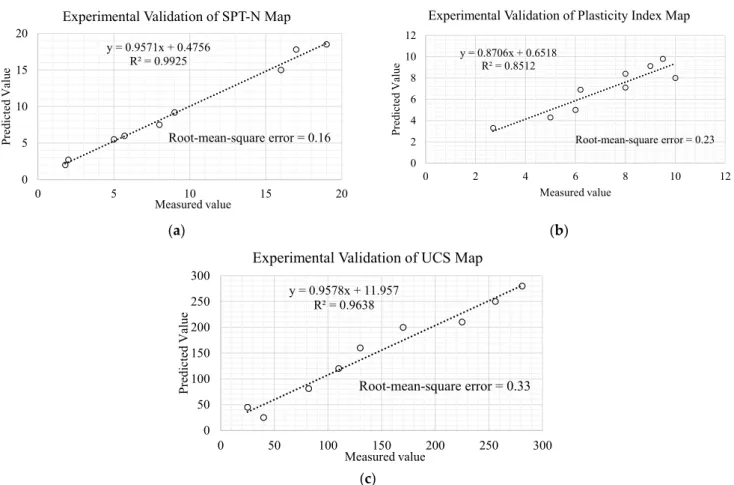
To verify the accuracy of the developed map using the proposed method, additional 9 values of SPT, plasticity index, and UCS at the same depth was collected and comparing the actual test results (laboratory tests results for UCS and Plasticity index and in-situ test results for SPT) with the corresponding values on the developed maps (Figure5). The actual value collected from the consultants was compared with the generated results using the previous 20 boreholes data. The results are presented in Figure6where measured value along the x-axis shows the actual test results and predicted value along the y-axis shows the corresponding value on the developed map.
Appl. Sci.Appl. Sci. 2021, 11, x FOR PEER REVIEW 2021,11, 4004 14 of 2215 of 23
(a) (b)
(c)
Figure 6. Experimental Validation of Generated maps in Figure 5, (a) validation of the SPT map, (b) validation of the plasticity index map, and (c) validation of the UCS map.
Furthermore, the results are compared with the previous study conducted for Poto- har region, Pakistan [9]. In this study [9], the region area is 23,000 km2 and total number of borehole test data used was 75, which means one field test is covering average 306 km2. In comparison, the total area of our study region is 215 km2 and one borehole is covering average 10 km2, which has less uncertainties.
3.3. Visualization, Management, and Volume Calculation
Before integrating the geotechnical map information into a BIM platform to enhance the visualization of the geotechnical information and aids the volume calculation of each soil type available below the ground, setting up the coordinate system is necessary to georeferenced the IFC file. The Autodesk Civil 3D software has been used widely in the architecture, engineering, and construction (AEC) industry for modeling, visualization, managing, and documentation the geometrical information. In addition, it can manage coordinate systems and integrating non-geometric information with the geometric model.
The AutoCAD Map 3D can be opened inside the Civil 3D software that supports the ex- port and import of CityGML based models [64]. Boreholes are represented in the BIM environment providing three-dimensional visualization showing soil layers with differ- ent colors along with the depth (Figure 7). All layers are differentiated by color and type information are stored in the Civil 3D database. As each borehole has its coordinates, so they can be shown on the map on its actual location. Figure 7a shows the visualization of boreholes that contain soil type information with depth. The color shows the different types of soil types.
Geotechnical information was represented in the civil 3D surfaces that interpolate all points of the same soil type and create surfaces (Figure 7b). The points created in the civil 3D are known Coordinate Geometry (COGO) points [65]. The advantage of the COGO is
y = 0.9571x + 0.4756 R² = 0.9925
0 5 10 15 20
0 5 10 15 20
Predicted Value
Measured value
Experimental Validation of SPT-N Map
Root-mean-square error = 0.16
y = 0.8706x + 0.6518 R² = 0.8512
0 2 4 6 8 10 12
0 2 4 6 8 10 12
Predicted Value
Measured value
Experimental Validation of Plasticity Index Map
Root-mean-square error = 0.23
y = 0.9578x + 11.957 R² = 0.9638
0 50 100 150 200 250 300
0 50 100 150 200 250 300
Predicted Value
Measured value
Experimental Validation of UCS Map
Root-mean-square error = 0.33
Figure 6. Experimental Validation of Generated maps in Figure5, (a) validation of the SPT map, (b) validation of the plasticity index map, and (c) validation of the UCS map.
The root-mean-square error (RMSE) that asses the model and tells about the accuracy of the predicted value from the measured one. The RMSE is calculated as 0.16, 0.23, and 0.33 for SPT, plasticity index, and UCS, which shows the generated results are very accurate.
Also, the R-squared (R2) was determined to be 0.9925, 0.8512, and 0.9638 for SPT, plasticity index, and UCS that shows a high level of correlation between the predicted value from the developed map and the measured value from the actual test results.
Furthermore, the results are compared with the previous study conducted for Potohar region, Pakistan [9]. In this study [9], the region area is 23,000 km2and total number of borehole test data used was 75, which means one field test is covering average 306 km2. In comparison, the total area of our study region is 215 km2and one borehole is covering average 10 km2, which has less uncertainties.
3.3. Visualization, Management, and Volume Calculation
Before integrating the geotechnical map information into a BIM platform to enhance the visualization of the geotechnical information and aids the volume calculation of each soil type available below the ground, setting up the coordinate system is necessary to georeferenced the IFC file. The Autodesk Civil 3D software has been used widely in the architecture, engineering, and construction (AEC) industry for modeling, visualization, managing, and documentation the geometrical information. In addition, it can manage coordinate systems and integrating non-geometric information with the geometric model.
The AutoCAD Map 3D can be opened inside the Civil 3D software that supports the export and import of CityGML based models [64]. Boreholes are represented in the BIM environment providing three-dimensional visualization showing soil layers with different colors along with the depth (Figure7). All layers are differentiated by color and type information are stored in the Civil 3D database. As each borehole has its coordinates, so
Appl. Sci.2021,11, 4004 15 of 22
they can be shown on the map on its actual location. Figure7a shows the visualization of boreholes that contain soil type information with depth. The color shows the different types of soil types.
that, in addition to the x, y, and z coordinate information, it support appending of extra information such as points numbering, name, description etc. Borehole points are consid- ered as COGO points that are stored in the COGO point database containing information.
Figure 7a illustrates the detailed information about the borehole with the soil type infor- mation in different color representations. Furthermore, Geotechnical surfaces are visual- ized for all types of soil that are categorized by colors as shown in Figure 7b. The top and bottom layer surface was utilized for the volume calculation using the surface-to-surface volume calculation method. The red color shows the clay layer distributed over the whole area. The quantity of clay available underground is calculated with the surface-to-surface method by overlaying the upper surface layer on the lower layer. Figure 8a shows the overlaying by vertical projection between lower and upper clay layer, while Figure 8b illustrates the prisms created by the projection of the two surfaces.
(a) (b)
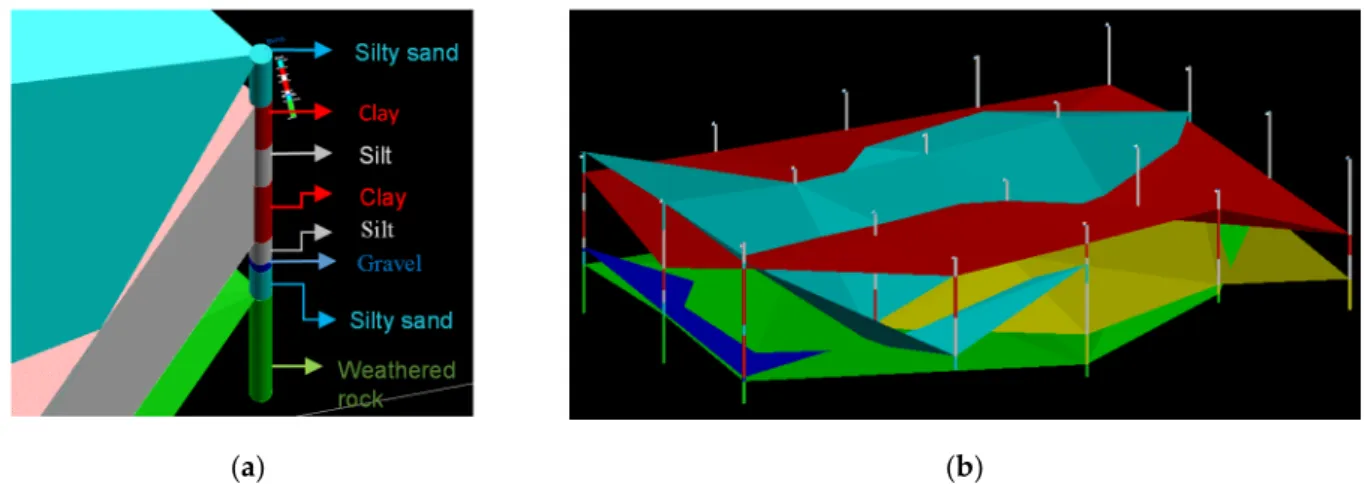
Figure 7. Visualization of geotechnical property models in BIM environment: (a) Three-dimensional borehole visualization showing geotechnical layers with different colors; (b) Interpolation of geotechnical property
It can be seen from the borehole representation (Figure 7a), two clay layers are avail- able. The four surfaces joined by the points of the same type and order are visualized in Figure 8a. Civil 3D has the functionality to extract solid between two surfaces from up to some depth, elevation, or to some target surface. Solids can be extracted from each top and bottom surface. All top and bottom surfaces are created for each type of soil in bore- hole data and categorized in colors. Solids are extracted from clay top and bottom surface shown in Figure 8b and the volume of that solid represents the quantity of the available clay in the site. Extra information is appended to the geotechnical solids in the BIM envi- ronment to enhance the model capability. The understanding of the distribution of the soil layer in the construction site is very significant for the site engineers and managers for deciding on the construction method. The use of BIM for the surface and solid modeling of the underground geotechnical layers provides practitioners and researchers a better approach to visualize, manage, and calculate the volume.
Figure 7.Visualization of geotechnical property models in BIM environment: (a) Three-dimensional borehole visualization showing geotechnical layers with different colors; (b) Interpolation of geotechnical property.
Geotechnical information was represented in the civil 3D surfaces that interpolate all points of the same soil type and create surfaces (Figure7b). The points created in the civil 3D are known Coordinate Geometry (COGO) points [65]. The advantage of the COGO is that, in addition to the x, y, and z coordinate information, it support appending of extra information such as points numbering, name, description etc. Borehole points are considered as COGO points that are stored in the COGO point database containing information. Figure7a illustrates the detailed information about the borehole with the soil type information in different color representations. Furthermore, Geotechnical surfaces are visualized for all types of soil that are categorized by colors as shown in Figure7b. The top and bottom layer surface was utilized for the volume calculation using the surface-to- surface volume calculation method. The red color shows the clay layer distributed over the whole area. The quantity of clay available underground is calculated with the surface-to- surface method by overlaying the upper surface layer on the lower layer. Figure8a shows the overlaying by vertical projection between lower and upper clay layer, while Figure8b illustrates the prisms created by the projection of the two surfaces.
It can be seen from the borehole representation (Figure7a), two clay layers are avail- able. The four surfaces joined by the points of the same type and order are visualized in Figure8a. Civil 3D has the functionality to extract solid between two surfaces from up to some depth, elevation, or to some target surface. Solids can be extracted from each top and bottom surface. All top and bottom surfaces are created for each type of soil in borehole data and categorized in colors. Solids are extracted from clay top and bottom surface shown in Figure8b and the volume of that solid represents the quantity of the available clay in the site. Extra information is appended to the geotechnical solids in the BIM environment to enhance the model capability. The understanding of the distribution of the soil layer in the construction site is very significant for the site engineers and managers for deciding on the construction method. The use of BIM for the surface and solid modeling of the underground geotechnical layers provides practitioners and researchers a better approach to visualize, manage, and calculate the volume.
Appl. Sci.2021,11, 4004 16 of 22
Appl. Sci. 2021, 11, x FOR PEER REVIEW 17 of 23
(a) (b)
Figure 8. (a) Surface-based visualization of the available clay layers; (b) Solid-based representation of the available clay.
After extracting and creating solids from the surfaces of the same soil type that has been visualized using different colors, the additional properties defined in the method section are defined and appended to each of the geotechnical solids in the civil 3D. The properties are defined as a property set with three sets; strength, classification, and com- paction. The geotechnical model in the BIM environment is such that, whenever a solid is selected, all its defined properties are listed in the properties dialogue box (Figure 8b).
This further ensures that the geotechnical solid representing a specific kind of soil stores all the laboratory test and in-situ test parameters in the BIM database.
All the appended geotechnical information is stored in the IFC file. The values of these parameters use IfcPropertySingleValue that is grouped under IfcPropertySet. Auto- desk Civil 3D supports the export and import of IFC data. When the geotechnical property model is exported from the civil 3D, it contains the geotechnical elements such as IfcBore- hole, IfcGeoslice, and IfcGeomodel, and the properties attribute also in three different sets.
Figure 9a shows the geotechnical model in the BIM vision software, which is an open- source tool to view and analyze the IFC file. While, Figure 9b presents the part of the IFC- STEP physical format (IFC-SPF), which describes the storing and managing of geotech- nical information in the IFC file. Geotechnical element definition (i.e., #23772) has assigned a Global Unique Identification Number (GUID), which uniquely describes each of the ge- otechnical elements having 22 characters according to the standards [66]. The strength category information are defined (#24171, #24173, #24175, #24177, #24179, #24181), which are grouped under IfcPropertySet (#24169). Furthermore, the relationship between the ge- otechnical element definition (#23772) and the IfcPropertySet (#24169) is created using the IfcRelDefinesByProperties (#24183). It is clear from the results that the proposed method successfully stored and managed the geotechnical information in the IFC format that en- hances the collaboration and allows the exchange of geotechnical information through a standard format among different stakeholders.
Figure 8.(a) Surface-based visualization of the available clay layers; (b) Solid-based representation of the available clay.
After extracting and creating solids from the surfaces of the same soil type that has been visualized using different colors, the additional properties defined in the method section are defined and appended to each of the geotechnical solids in the civil 3D. The properties are defined as a property set with three sets; strength, classification, and com- paction. The geotechnical model in the BIM environment is such that, whenever a solid is selected, all its defined properties are listed in the properties dialogue box (Figure8b). This further ensures that the geotechnical solid representing a specific kind of soil stores all the laboratory test and in-situ test parameters in the BIM database.
All the appended geotechnical information is stored in the IFC file. The values of these parameters use IfcPropertySingleValue that is grouped under IfcPropertySet.
Autodesk Civil 3D supports the export and import of IFC data. When the geotechnical property model is exported from the civil 3D, it contains the geotechnical elements such as IfcBorehole, IfcGeoslice, and IfcGeomodel, and the properties attribute also in three different sets. Figure9a shows the geotechnical model in the BIM vision software, which is an open-source tool to view and analyze the IFC file. While, Figure9b presents the part of the IFC-STEP physical format (IFC-SPF), which describes the storing and managing of geotechnical information in the IFC file. Geotechnical element definition (i.e., #23772) has assigned a Global Unique Identification Number (GUID), which uniquely describes each of the geotechnical elements having 22 characters according to the standards [66].
The strength category information are defined (#24171, #24173, #24175, #24177, #24179,
#24181), which are grouped under IfcPropertySet (#24169). Furthermore, the relationship between the geotechnical element definition (#23772) and the IfcPropertySet (#24169) is created using the IfcRelDefinesByProperties (#24183). It is clear from the results that the proposed method successfully stored and managed the geotechnical information in the IFC format that enhances the collaboration and allows the exchange of geotechnical information through a standard format among different stakeholders.
(a) (b)
Figure 9. (a) Visualization of IFC-based geotechnical property model in open BIM tool; and (b) Part of EXPRESS code showing the strength category information stored in the IFC format.
3.4. Soil Classification Map According to OSHA for Safe Construction Zoning
Although the proposed methodology of integrating BIM and GIS for geotechnical property modeling and zoning can be applied for many purposes, however, the applica- tion in the context of this paper was limited to identify a safe and proper construction type and place for the excavation design. In the construction works, more than 800 workers die each year in the U.S, while 40 construction workers die in the excavation works due to which is considered, a dangerous construction type [5]. It is very important to know the soil type before initiating excavation construction as it will help to prevent construction hazards. Furthermore, safe construction techniques such as sloping, benching, and shor- ing can be adopted. Therefore, it is recommended by the occupational safety and health administration (OSHA) that the construction team must determine the type of soil avail- able on the site.
The OSHA has classified soil into stable rock, soil type A, type B, and type C and the support system can be planned according to the soil type available on site. Soil can be either granular or cohesive. Granular soil contains coarse particles such as gravel and sand, while cohesive soil contains fine particles such as clay that has enough binding to stick together preventing cave-in during excavation. Type A is cohesive such as clay, silty clay, and sandy clay, and considered stable. Type B soil is also stable but has medium- strength such as silt, angular gravel, and silt loam. The least stable soil type is C that is mainly granular soil such as sand and gravel and cohesive soil with lower strength.
Figure 10 depicts the soil classification map according to the OSHA regulation for safe excavation construction. The study area has all three type of soil, while the rock is also available that can be seen in Figure 7b. Soil type A is represented in red color, which is cohesive soil and has high-unconfined compressive strength. This further shows that it can be cut with a higher slope because of its stability. Soil type B is dominant in the central Figure 9. (a) Visualization of IFC-based geotechnical property model in open BIM tool; and (b) Part of EXPRESS code showing the strength category information stored in the IFC format.
3.4. Soil Classification Map According to OSHA for Safe Construction Zoning
Although the proposed methodology of integrating BIM and GIS for geotechnical property modeling and zoning can be applied for many purposes, however, the application in the context of this paper was limited to identify a safe and proper construction type and place for the excavation design. In the construction works, more than 800 workers die each year in the U.S, while 40 construction workers die in the excavation works due to which is considered, a dangerous construction type [5]. It is very important to know the soil type before initiating excavation construction as it will help to prevent construction hazards. Furthermore, safe construction techniques such as sloping, benching, and shoring can be adopted. Therefore, it is recommended by the occupational safety and health administration (OSHA) that the construction team must determine the type of soil available on the site.
The OSHA has classified soil into stable rock, soil type A, type B, and type C and the support system can be planned according to the soil type available on site. Soil can be either granular or cohesive. Granular soil contains coarse particles such as gravel and sand, while cohesive soil contains fine particles such as clay that has enough binding to stick together preventing cave-in during excavation. Type A is cohesive such as clay, silty clay, and sandy clay, and considered stable. Type B soil is also stable but has medium-strength such as silt, angular gravel, and silt loam. The least stable soil type is C that is mainly granular soil such as sand and gravel and cohesive soil with lower strength.
Figure10depicts the soil classification map according to the OSHA regulation for safe excavation construction. The study area has all three type of soil, while the rock is also available that can be seen in Figure7b. Soil type A is represented in red color, which is cohesive soil and has high-unconfined compressive strength. This further shows that it can be cut with a higher slope because of its stability. Soil type B is dominant in the central part, while soil type C soil is prominent at the other side of the study covering more area