1. Introduction
Drought is a temporary feature resulting from pro- longed absence, or deficiency or poor distribution, of
precipitation (Ogallo, 1994). Although numerous interpretations of drought have been offered, the most significant determinant of drought is the amount of precipitation an area gets compared to
* This study was financially supported by the NASA Headquarters under Earth System Science Fellowship Program (NGT5-30404).
** Post-doctoral research fellow, Kansas Applied Remote Sensing Program, University of Kansas, U.S.A., [email protected]
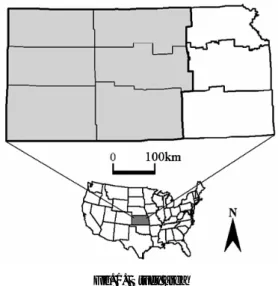
Influences of Physical Soil Properties on Drought Severity in the Central Great Plains Based on Satellite Data and
a Digital Soil Database*
Sunyurp Park**
인공위성자료와 디지털 토양자료를 통해 분석한 미중부 대평원 지역 가뭄정도에 미친 물리적 토양특성의 영향*
박 선 엽**