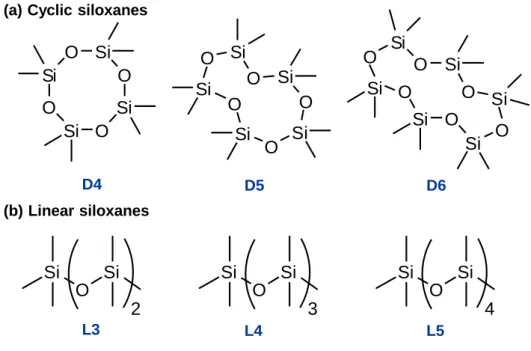
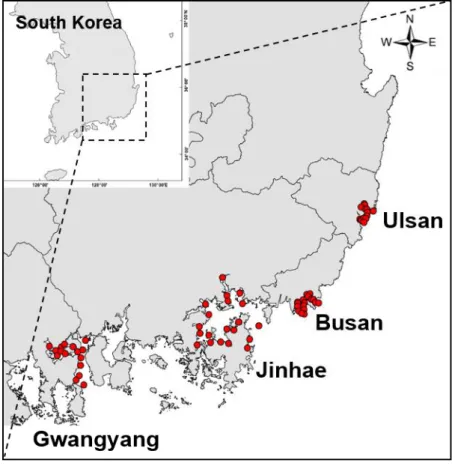
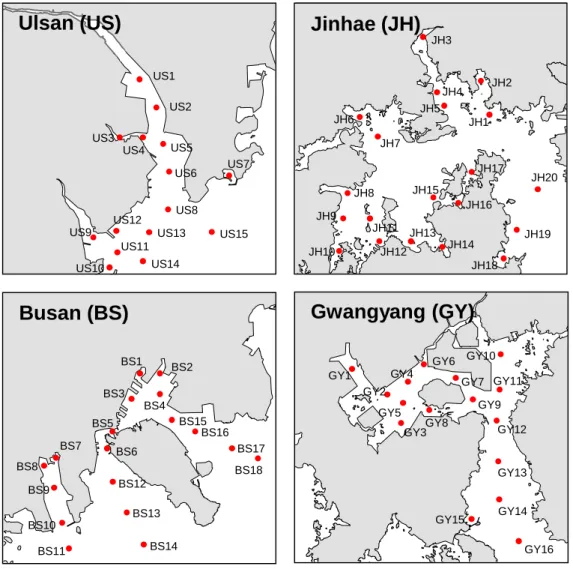
Moreover, previous studies have detected the high levels of siloxanes in various environmental matrices, which can lead to negative effects on the ecosystem. In this study, 6 cyclic siloxanes (D4–D9) and 13 linear siloxanes (L3–L15) were analyzed in coastal sediment collected from southeastern industrial bays in Ulsan, Busan, Jinhae, and Gwangyang, South Korea (March–April 2016). Based on the results, the contamination levels, spatial distribution and correlation of siloxanes in coastal sediment were investigated.
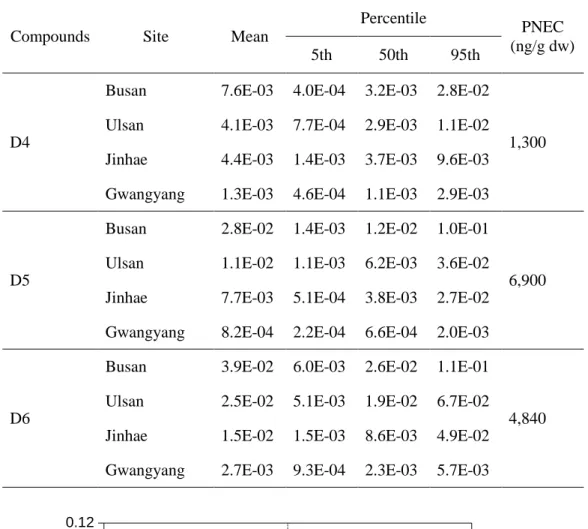
There are significant correlations between the concentrations of siloxanes, the concentrations of persistent organic pollutants (POPs) and the content of TOC in sediment. Hazard quotients (HQs) for siloxanes in coastal sediment were less than 1, indicating no risk to organisms from exposure to siloxanes in coastal sediment. Mean and 95th percentile of HQs of three cyclic siloxanes in sediment of the four.
INTRODUCTION
Therefore, the main emission routes of siloxanes are evaporation into the atmosphere or disposal after discharge from sewage treatment plants (WTP). The proportion of siloxanes adsorbed on suspended organic matter is released as effluent to the aquatic environment. To date, there is no legislation in South Korea to limit the concentration levels of siloxanes in environmental matrices and products.
Therefore, the main route of exposure for siloxanes in aquatic systems is likely via sediment (Mackay et al., 2015). Therefore, this study aimed to investigate the concentration levels and spatial distribution of siloxanes in coastal sediment collected from southeastern industrial bays in South Korea with an appropriate analytical method. Finally, the ecological risk of siloxanes in coastal sediment to organisms was assessed based on probabilistic distributions of hazard quotients.

MATERIALS AND METHODS
- Sampling of sediments
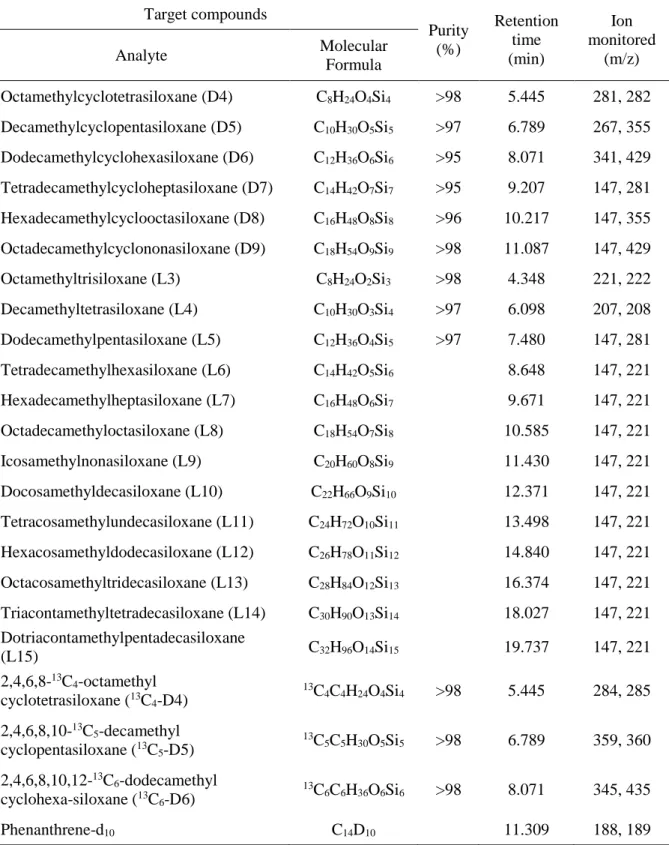
- Chemical and reagents
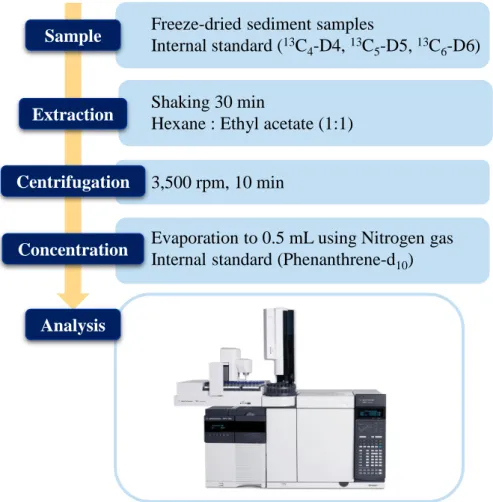
- Extraction methods for sediment
- Instrumental analysis
- Quality assurance and quality control
- Risk assessment
- Statistical analysis
The dominant industrial products of the bay are petrochemical products, non-ferrous metals, automobiles and ships (Choi et al., 2012). The coastline of the bay has shipyards, electronics, chemical fertilizer and steel manufacturing plants (Moon et al., 2008). The WWTP accelerates the pollution of the coastal environment in Masan Bay (Kannan et al., 2010).
Commercial and fishing ports, shipyards, and shellfish farms are located along Jinhae Bay (Kim et al., 2014). The bay is used for steelmaking and petrochemical facilities on the inner coasts (Kim et al., 2008). The PDMS mixture used as a standard for the identification and quantification of the linear siloxanes.
To calculate the limits of detections (LODs) and limits of quantifications (LOQs), the signal-to-noise ratio (Lee et al., 2014; . Tran et al., 2015) and the procedural blank concentration (Hong et al., 2014) were generally used. PNEC was calculated with toxicity data, LC50 (median lethal dose), EC50 (half maximal effective concentration) or NOEC (no observed effect concentration) of sediment dwelling organisms. The evaluation factors, which fill the gap of animal toxicity values and different experimental conditions, were adapted from the previous study (Evaluation factor: 10 (D4 and D5), 100 (D6); Homem et al.
For the worst-case scenario, concentrations of siloxanes below detection limits were replaced by half the detection limits, the lowest NOEC values (D4: 13 mg/kg dw (worms), D5: 69 mg/kg dw (midge), and D6: > 484 mg/ kg body weight (worms)) were obtained from a previous study (Redman et al., 2012). However, risk assessment using single-point values can result in high uncertainty, while Monte Carlo simulation, which results in a probabilistic approximation, can reduce the uncertainty of estimates (Fakhri et al., 2018). Concentrations of siloxanes were assumed to follow a log normal distribution to generate hazard quotient distributions with 5000 simulation replicates.
This probabilistic distribution hazard quotient approach was also applied in other studies to evaluate the risk assessment of polycyclic aromatic hydrocarbons (PAHs) in water in China (Guo et al., 2012) and of heavy metals due to ingestion of instant noodles in Iran ( Guo et al., 2012). Tajdar-Oranj et al., 2018), and onions in Iran (Fakhri et al., 2018).
RESULTS AND DISCUSSION
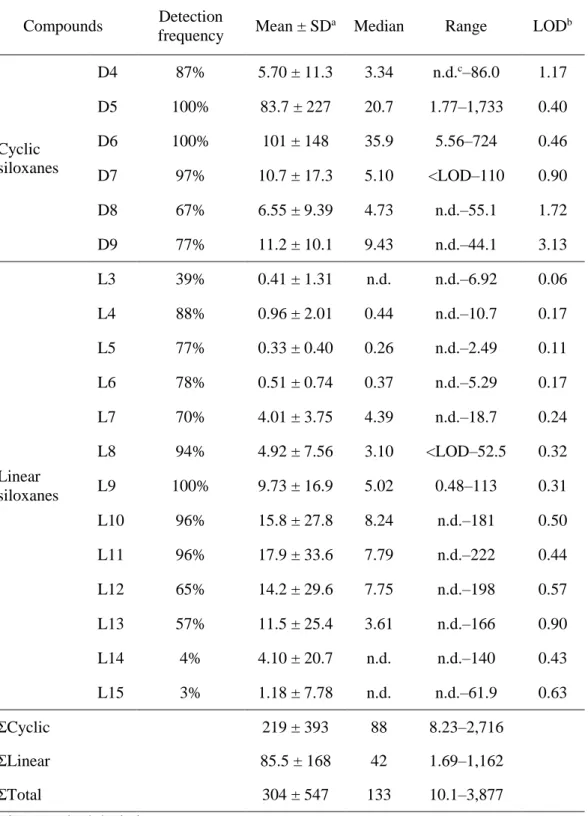
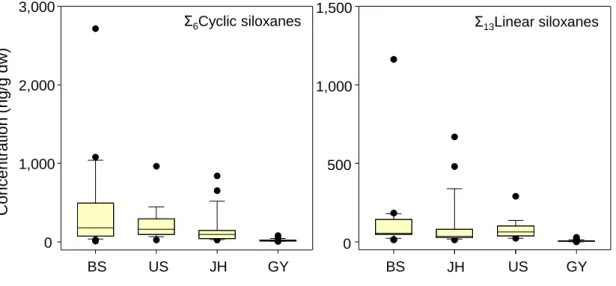
Levels of siloxanes in coastal sediment
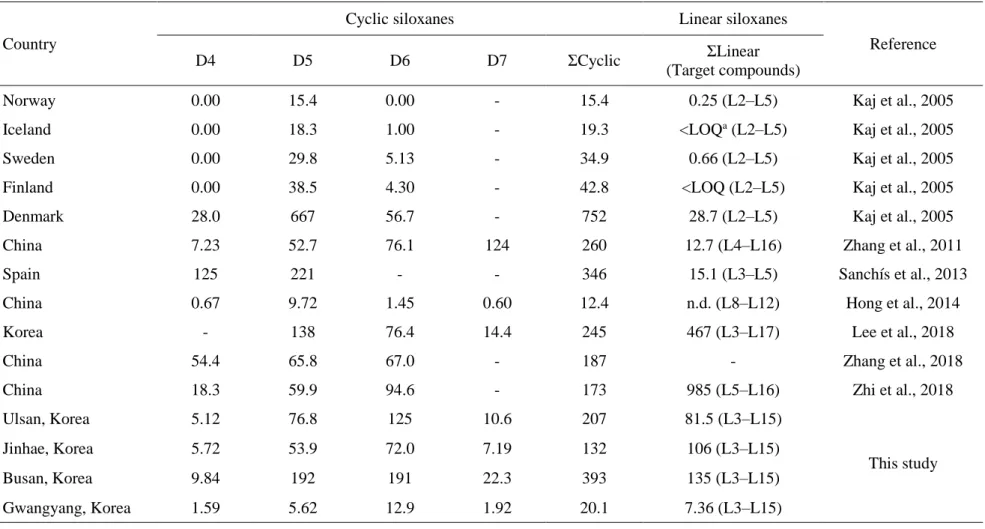
Global comparison of cyclic siloxane concentrations (ng/g dw) in sediment samples between this study and a previous study.
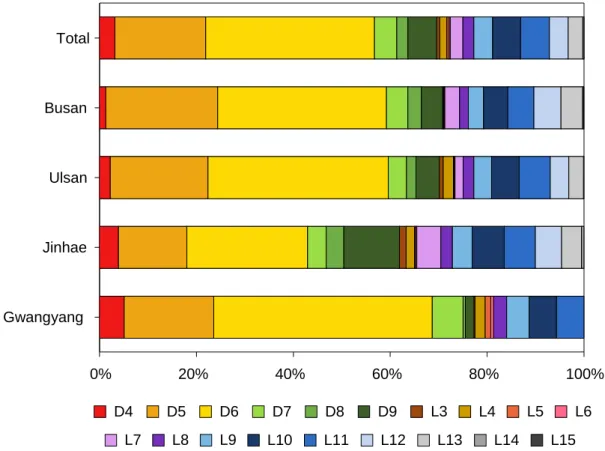
Profile of siloxanes in coastal sediment
The composition fraction of linear siloxanes in the four sampling areas increased from L6 to L11 and decreased from L12 to L15. A previous study estimated solid–liquid partition coefficients, which are the indices of the sorption capacity of siloxanes (Bletsou et al., 2013). In the results, the coefficients of linear siloxanes generally increased from L5 to L9 and decreased from L10 to L14, showing a similar pattern to the concentration distributions of siloxane in this study.
However, these increasing and decreasing trends are shown in the binding affinities of perfluoroalkyl substances (PFCAs) to serum proteins (Zhang et al., 2013), suggesting that binding affinities increase with increasing specific chain lengths and then decrease with changes physical properties of compounds. In the four zones, cyclic siloxanes (D4–D9) represented 70% of the total siloxane concentrations, while linear siloxanes (L3–L15) represented only 30%. This abundant distribution pattern of cyclic siloxanes can be explained by the fact that cyclic siloxanes have a higher consumption than linear siloxanes (Lee et al., 2018; Lee et al., 2014).
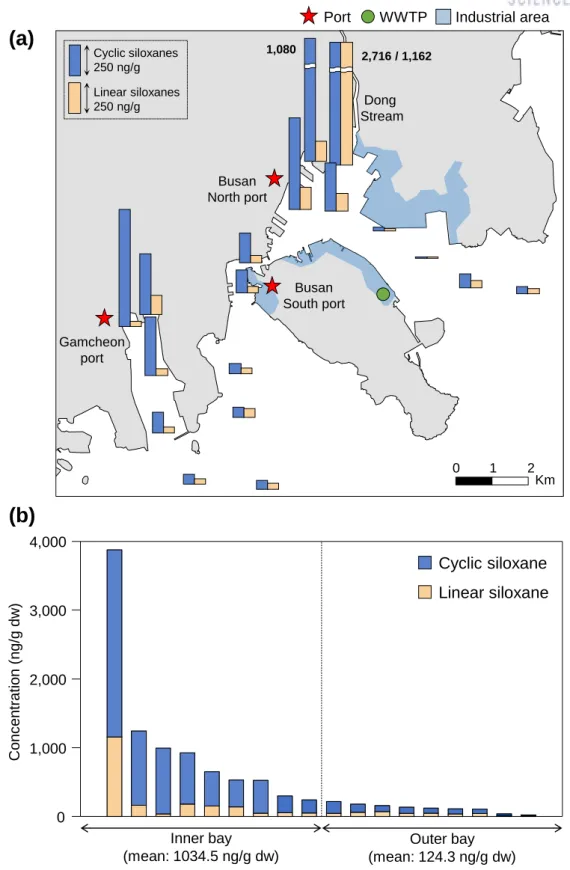
In Busan samples, cyclic siloxanes, D5 and D6, accounted for 23% and 35% of the total siloxane concentrations, and the linear siloxanes (L3–L15) accounted for 29%. In general, industrial products contain a higher fraction of linear siloxanes than PCPs (Horii and Kannan, 2008; Xu et al., 2015). Therefore, the high fraction of linear siloxanes in Jinhae can be explained by the effects of specific industrial activities at this location.
Spatial distribution and pollution sources of siloxanes in coastal sediment
Therefore, the high fraction of linear siloxanes in Jinhae can be explained by the effects of specific industrial activities in this place. a) Spatial distribution of Σ6cyclic siloxanes and Σ13linear siloxanes in coastal sediment collected from Busan, Korea. The spatial distribution and profiles of cyclic and linear siloxanes in Ulsan are shown in Figure 12. In general, siloxane concentrations in Ulsan tend to decrease from the estuary to the sea, which is consistent with the siloxane distribution pattern of the previous study (Hong et al., 2014).
The highest concentration of siloxanes was detected downstream of the Taehwa River, which is affected by both industrial and domestic activities, and near Ulsan Port surrounded by petrochemical and automotive facilities. We compared the spatial distribution of Ulsan found in our study with that of a previous study (Lee et al., 2014). Their results on the spatial distribution trends in Ulsan are consistent with our study, indicating that industrial activities along the estuary and Taehwa River may significantly contribute to siloxane pollution. a) Spatial distribution of Σ6cyclic siloxanes and Σ13linear siloxanes in coastal sediment collected from Ulsan, Korea.
The spatial distribution and profiles of cyclic and linear siloxanes in Jinhae are shown in Figure 13. Linear siloxanes in this bay had a high fraction and the second highest levels next to Busan Bay. It is known to play an important role in the distribution of pollution in Masan Bay (Kannan et al., 2010), suggesting that the treatment plant directly contributed to the high levels of siloxanes in Masan Bay.
As mentioned before, Jinhae Bay had a higher fraction of linear siloxanes than other bays, indicating that Jinhae sites were more affected by industrial activities. Indeed, sampling sites near WWTPs (JH2, JH4 and JH5) showed high fractions of linear siloxanes (45%), suggesting that WWTP activities act as a major factor in increasing linear siloxane concentrations . a) Spatial distribution of Σ6cyclic siloxanes and Σ13linear siloxanes in coastal sediment collected from Jinhae, Korea. The average total concentration of siloxanes in Gwangyang Bay is about 20 times lower than that in Busan Bay.
Spatial distribution and profiles of cyclic and linear siloxanes in Gwangyang are shown in Figure 14 .
Correlations of siloxanes in coastal sediment
Correlation is significant at the 0.01 level (two-tailed) and *Correlation is significant at the 0.05 level (one-tailed). The Stockholm Convention regulates PCDD/Fs, PCBs and PCNs as persistent organic pollutants (POPs) due to their persistence in the environment, bioaccumulation, toxicity and long-range transport (Rodan et al., 1999). Three POPs were analyzed in the same sediment samples used in our study (Son et al., unpublished data).
From the data, we examined the correlation between concentrations of siloxanes and POPs in Table 5. The POPs have similar physicochemical properties to siloxanes, in that they have hydrophobic and lipophilic properties (Herbert et al., 2004; Nguyen et al., 2016). . In addition, both siloxanes and POPs showed high concentration levels near commercial ports, WWTPs and downstream of industrial complexes, indicating that the mix of industrial activities rather than a specific industry are the main contamination sources of the contaminants.

Principal component analysis
Probabilistic distributions of hazard quotients
Mean and 95th percentile of the headquarters of three cyclic siloxanes in sediment from the four regions.
CONCLUSIONS
Mass loading and fate of linear and cyclic siloxanes in a wastewater treatment plant in Greece. Concentrations of cyclic volatile methylsiloxanes in European cosmetics and personal care products: condition for human and environmental exposure assessment. Concentrations and distribution of synthetic musks and siloxanes in sewage sludge from wastewater treatment plants in China.
Occurrence of linear and cyclic volatile methylsiloxanes in wastewater, surface water and sediments of Catalonia. Determination of cyclic and linear siloxanes in soil samples by ultrasonically assisted extraction and gas chromatography-mass spectrometry. Distribution, elimination and rearrangement of cyclic volatile methylsiloxanes in oil-contaminated soil from the Shengli oil field, China.
An indoor survey of cyclic and linear siloxane dusts and their implications for human exposure in twelve countries. Determination of cyclic volatile methylsiloxanes in water, sediments, soil, living organisms and biosolids by high volume gas injection chromatography and mass spectrometry. Determination of linear and cyclic volatile methylsiloxanes in the blood of turtles, cormorants and seals from Canada.
Review of recent advances in research on the toxicity, detection, occurrence and fate of cyclic volatile methylsiloxanes in the environment. Concentrations of cyclic volatile methylsiloxanes in biosolids amended soil, influent, effluent, receiving water and sediment from wastewater treatment plants in Canada. Mapping of cyclic and linear siloxanes in sediment from the songhua river and in sewage sludge from sewage treatment plants, northeast China.
2] Danbi Lee, Min-Kyu Park, In-Seok Lee, Sung-Deuk Choi*, "Distribution of siloxanes in coastal sediments collected from industrial bays in South Korea", In preparation.