CHAPTER 6
Evaluating Exposures
Evaluating Exposures
Potential Multimedia Exposure Pathways of Concern p y
http://www.epa.gov/ttnmain1/fera/data/risk/vol_1/chapter_20.pdf
Conceptual Model Diagram for Exposure p g p of Piscivorous Birds to Air Toxics
piscivorous: a.【동물】 물고기를 먹는 invertebrate: a 【동물】 무척추 동물의
http://www.epa.gov/ttnmain1/fera/data/risk/vol_1/chapter_23.pdf invertebrate: a.【동물】 무척추 동물의
Generalized Conceptual Model for Air Toxics Risk Assessments
http://www.epa.gov/ttnmain1/fera/data/risk/vol_1/chapter_06.pdf
The Detailed Air Toxics Risk Assessment Process
Population Characteristics
http://www.epa.gov/ttnmain1/fera/data/risk/vol_1/chapter_05.pdf
Generic Conceptual Model of How Air Toxics Releases May Result in Injury or Disease
May Result in Injury or Disease
http://www.epa.gov/ttnmain1/fera/data/risk/vol_1/chapter_03.pdf
Generic Conceptual Model of How Air Toxics Releases May Result in Injury or Disease
May Result in Injury or Disease
http://www.epa.gov/ttnmain1/fera/data/risk/vol_1/chapter_03.pdf
Q ti Add d b th E P fil Questions Addressed by the Exposure Profile
• How may exposure occur?
h b d?
• What may be exposed?
• How much exposure may occur?
• When and where may exposure occur?
• How may exposure vary? How may exposure vary?
• How uncertain are the exposure estimates?
• What is the likelihood that exposure will occur?
• What is the likelihood that exposure will occur?
http://www.epa.gov/ttnmain1/fera/data/risk/vol_1/chapter_24.pdf
C t t Contents
6.1 Introduction 6.1 Introduction
6.2 Occupational Exposures: recognition, Evaluation and Control
6 3 Exposure Assessment for Chemicals in 6.3 Exposure Assessment for Chemicals in
the Ambient Environment
6.4 Designing Safe Chemicals:
R d i d /T i it
- Reducing dose/Toxicity
6.1 Introduction
(http://www.epa.gov/ppt/exposure)
The human health risk associated with a chemical
( p p g pp p )
e u e s ssoc ed w c e c
is dependent on
the rate at which the chemical is released
the rate at which the chemical is released,
the fate of the chemical in the environment,,
human exposure to the chemical,
human health response resulting from t th h i l
exposure to the chemical
6.1 Introduction
(http://www.epa.gov/ppt/exposure)
The methods for estimating exposure will be separated into
( p p g pp p )
g p p
two sections - occupational and community.
Occupational exposure
Occupational exposure
~ occur in workplace by inhalation of workplace air,
ingestion of dust or contaminated food, or from
contact of the chemicals with the skin of eyes
contact of the chemicals with the skin of eyes.
6.1 Introduction
(http://www.epa.gov/ppt/exposure)
Community Exposure
( p p g pp p )
y p
Chemical releases to rivers, lakes, and streams may accumulate
i fi h d th i lif hi h b tl d
in fish and other marine life, which are subsequently used as a source of food, or may be ingested by persons using the downstream reaches of rivers as a supply of potable water.pp y p
Person living downwind of a chemical manufacturing facility may be exposed to fugitive and point source releases of chemical be exposed to fugitive and point source releases of chemical toxins to the atmosphere.
Disposal of solid and hazardous wastes on the land, either in repositories such as landfills or into subterranean strata by injection into wells may result in contamination of potable injection into wells may result in contamination of potable groundwater is not isolated from the water supplies.
stratum:【지질】 지층;층
6.1 Occupational Exposure
Recognition, Evaluation and Control Basic Assessment Items
Recognition, Evaluation and Control
Basic Assessment Items
Recognize all sources of exposure to chemicals
- developing a list of sources of chemical exposure in the - developing a list of sources of chemical exposure in the
work environment
Determine if the exposure is within permissible limits - level and duration (Table 6.2-1) ( )
Control those exposures that exceed permissible limits - require on the source, pathway, workers exposed
(control by process change, adjustment in ventilation systems,
protective equipment, etc.)
OSHA PEL
OSHA P i ibl E Li i f Ai C i
OSHA Permissible Exposure Limits for Air Contaminants
- Set by OSHA (Occupational Safety and Health Administration), a division of the U.S. Department of Labor.
- Listed in Title 29, Part 1910.1000 of the code of Federal Regulations)
- Hydrogen Cyanide (known poison) and Ammonia (irritating but nontoxic) are the basis for relative toxicity
- Expressed as time-weighted averages for the chemical substance in any 8-hour work shift of a forty-hour work week.
- For PELs the action level is not the actual PEL but one-half the PEL, meaning action must be taken at this level to reduce the emission
meaning action must be taken at this level to reduce the emission.
Table 6.2-1
OSHA Permissible Exposure Limits for Air Contaminants
Ammonia
Hydrogen Cyanide
OSHA O ti l S f t d H lth Ad i i t ti OSHA: Occupational Safety and Health Administration,
a division of the U.S. Department of Labor.
6.2.1 Characterization of the Workplace
The first step in an occupational exposure assessment is to characterize the work place.
Description of Workplace: Schematic or Written Description
Schematic Description
- Identification of unit operations where exposure may occurIdentification of unit operations where exposure may occur
(process flow diagram, production activities, process chemistry, identify ventilation, other mechanism reduce exposure)
Written description
release and exposure from transportation disposal - release and exposure from transportation, disposal - area and location where chemical exposure may occur
- component stream, concentration, operating temp and pressures
f t ti i t til ti t l
- use of protective equipment, ventilation, open-top vessels - frequency and duration of sampling events
- duration of batch processes
- type and frequency of transfer operation
- number of workers involved in each operation
6.2.1 Characterization of the Workplace
Detailed Description
- A relative complete inventory of chemicals that encountered in workplace - The rate or generation of each chemical
C ll t h i l t d t (b )
- Collect physical property data (b.p., v.p., …)
- PSD of solid particles (airborne fraction) will give the potential respirable.
- MSDS (nuisance, irritant, toxicity, carcinogenicity, birth defects) will
provide occupational exposure guidelines established by regulatory or consensus organization.
- These include
The Occupational Safety and Health Administration PELs
The American Conference of Governmental Industrial Hygiene Chap 8
The American Conference of Governmental Industrial Hygiene Associations’ Threshold Limit Values (TLVs)
The American Industrial Hygiene Association’s
Workplace Environmental Exposure Level (WEEL) guides
Chap. 8
Workplace Environmental Exposure Level (WEEL) guides
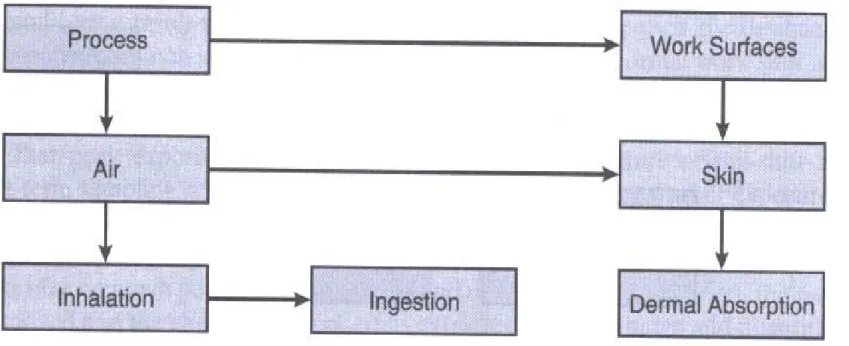
6.2.1 Exposure Pathways
Exposure to Chemicals in Work Environment can occur through inhalation, skin absorption, or ingestion.g , p , g
Exposure pathway model from process to worker (Fig. 6.2-1)
Inhalation is most significant route (volatilize, evaporate)
Fig. 6.2-1 Exposure pathway model
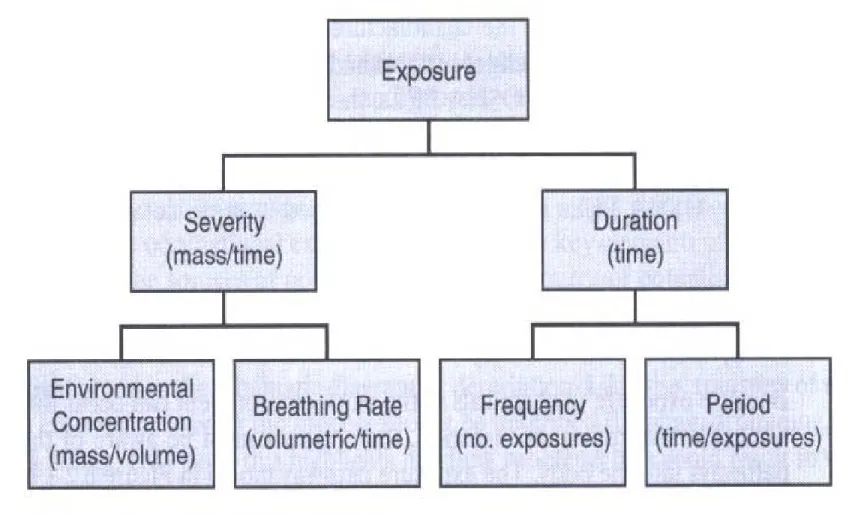
Framework for Calculating Exposure by Inhalation
Exposure
(mass)= Severity of exposure Duration of exposure
(mass/time) (time)
(mass/time) (time)
Severity (mass/time)
= Environ-Concentration Breathing rate
(mass/volume) (volume/time)
(mass/volume) (volume/time)
Duration (time)
= Frequency Period
(No. of exposure) (time/exposure)
A separate estimate of the rate of absorption of inhaled materials is necessary to calculate the intake of a chemical into body
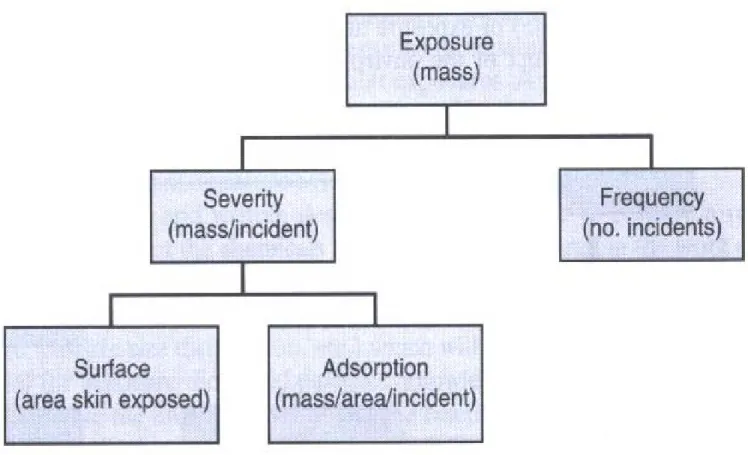
Framework for Dermal Contact and Oral Ingestion
Exposure
(mass)Exposure
(mass)= Severity Frequency
(mass absorbed/incident) (number of incidents)
Dermal exposure
(mass absorbed/incident) (number of incidents)
rea absorbed/a skin Mass
exposed area
Surface
Severity
Incident skin
exposed area
Surface
Severity
Dermal intake into the body requires a separate estimate of y the rate of uptake of the chemical from exposed skin surface.
O Oral Ingestion (relatively minor route), however, may be an important route of exposure that accumulate
i th b d l i d f ti
Oral Ingestion
in the body over long periods of time
i i
Fig. 6.2-2 Inhalation exposure framework
Fig 6 2-3 Dermal exposure framework
Fig. 6.2 3 Dermal exposure framework
Monitoring Worker Exposure g p
Monitoring objectives can be grouped into three categories:
Baseline Monitoring ( 기준 감시 )
- Evaluate the range of worker exposure
Baseline date are to determine the acceptability of exposures - Baseline date are to determine the acceptability of exposures
to chemicals and the need for controls to reduce exposures
Diagnostic Monitoring ( 진단 감시 )
- Identify principal sources and tasks contributing to exposure to specific chemicals
to specific chemicals
- Used to select appropriate control strategies for reducing exposure to known sources
Compliance Monitoring ( 준수 감시 )
- Demonstrate conformance with government regulations g g
- Monitor the most exposed worker using a collection device
attached to worker near his breathing zone
Monitoring Methods: Personal Monitoring
Personal Monitoring g
- Characterize the exposure of a worker to the chemical substances of interest
Common Method Common Method
- Breathing zone measurement (battery-powered pump is g ( y p p p attached to the worker to draw air through a collection tube) - Two common sampling averaging times:
8 h f l k hift
8 hrs for a normal work shift
15-min for a common short-term exposure time limit
- By patch testing skin absorption also can be quantified
- By patch testing, skin absorption also can be quantified
Monitoring Methods: Personal Monitoring
Inhalable Samplers
PM Sampler
AEROTRAK™ 9000 Nanoparticle Aerosol Monitor
Monitoring Methods: Area Monitoring
A M it i f bi t i i d t
Area Monitoring of ambient air is used to
- To measure background level of chemical contaminants
- To warn of toxic concentrations of acutely hazardous chemicalsy - To demonstrate the effectiveness of ventilation controls by
measuring the level of chemical contaminants before and after measuring the level of chemical contaminants before and after the controls are installed
Id tif d fi i i i i t ti f t l t
- Identify deficiencies in maintenance or operation of control system - Includes investigation of surface contamination by wipe test method
(useful for tracking level of contaminations by dermal route)
6.2.4 Modeling Inhalation Exposures
- It is not always possible for new process to undertake a monitoring program to
g p
It is not always possible for new process to undertake a monitoring program to determine airborne concentrations of chemicals
- Rapid estimate of potential worker exposure is needed
Mass Balance Model (Box Model)
k i d l d b i hi h th
~ work area is modeled as a box in which the contaminant is uniformly distributed
) ( C C kQ
dC G V
C : airborne contaminant in work area(mass/L3) V : work area volume (L3)
t : time duration which contaminants emitted
) ( C C
0kQ
dt G
V
t : time duration which contaminants emittedG : emission rate of contaminant to air(mass/time) Q : ventilation rate (L3/time)
k : mixing factor account for incomplete mixing k : mixing factor account for incomplete mixing C0: initial concentration
6.2.4 Modeling Inhalation Exposures
If G and Q are constant, C will reach a steady state
g p
kQ G
C
C
0 / (6-2)
At times, emissions are episodic. Consider a work area that initially
contains contaminant at concentration C0. At some time, t=0, an emission source releasing contaminant at rate G is placed in the work area
source, releasing contaminant at rate G, is placed in the work area.
Rise of Contaminant Concentration by Box Model
Assume ventilation rate is constant
)]
/ exp(
1
0 G [ kQt V
C
C 0 [1 exp(kQt /V )]
(6 3)
C kQC
k (mixing factor) = 0.3~0.7 in small room without fan
(6-3)
0.5 in work area with average ventilation 0.1 in work area with poor ventilation
6.2.4 Modeling Inhalation Exposures
P t ti M d l t D t i G (E l 6 2 1)
g p
Penetration Model to Determine G (Example 6.2-1)
Assume that the source is a pool of liquid Assume that the source is a pool of liquid
that is evaporating at constant rate
5 0 25
0 883
0
) )(
)(
(
) ](
) 29 / 1 /
1 )[(
)(
10 ( 79
.
8
0.05 0.5 0.55 . 0 25
. 0 883
. 0 5
P x
T
v MW
VP MW
A G
(6-4)
G : evaporation rate(g/sec)
A : surface area of the pool/air interface A : surface area of the pool/air interface
MW : molecular weight of the evaporating species(g/mole) VP : vapor pressure of evaporating contaminant (atm)
v : air velocity parallel to the surface of the evaporating liquid (cm/sec) y p p g q ( ) T : surface temperature (K)
x : length of the evaporating pool in the direction of air flow P : ambient pressure (atm)
Box Model for Non-Ventilatory Removal
When exposure may be mitigated by adsorption of chemical to wall and other surface in the work room
rC C
C kQ dt G
V dC (
0)
(6-5) dt
r : non-ventilatory removal coefficient of airborne contaminant
(6 5)
If ventilation and emission rates are constant, box model predicts a stead state concentration of
a steady state concentration of
0
G
C kQC ( kQ r ) (6 6)
C (6-6)
Modified Box Model
Modified Box Model~ work area is divided into 2 zones
(one near the source and the other is removed from the source)
)
( B Q
C G
(6 7)
) (
) (
BQ
C Q (6-7)
C : near the source
G : rate of vaporization of contaminant(m/time) B : rate of exchange of air between the zones B : rate of exchange of air between the zones
Q : ventilation rate of the zone removed from the source
Example 6 2-2
Example 6.2-2
6.2.4.2 Dispersion Models
S d f th t i t i id d b th ti
p
- Spread of the contaminant is aided by the convective mass transfer driven by the ventilation system
- Describe the variation of contaminant concentration with Describe the variation of contaminant concentration with distance from the source
dr
rdc dr
d r
D dx
u dC
2(6-8)
dr dr
r dx
u : wind velocity in x direction(L/time) u : wind velocity in x direction(L/time)
C : concentration of airborne contamination D : diffusion coefficient (L
2/time)
x : distance downwind from the source
r : distance from the source to the sampling point
6.2.4.2 Dispersion Models p
Concentrations from emissions into infinite space
)]
)(
2 / exp[(
4 u D r x
Dr
C G
(6-9)
4 Dr
G : contaminant emission rate from the source
Evaluated ranges of a uated a ges o D (Diffusion coefficient) ( us o coe c e t) 0.05~11.5 m
2/min, with 0.2 m
2/min being a typical value indoor industrial environments
(Example 6.2-3)
6.2.5 Assessing Dermal Exposures g p
Dermal hazards : damage the skin and chemicals can enter the body and cause toxic effects in other organs
acids, alkalis and corrosive chemicals
Mechanism of Dermal Exposures
Di t t t f l hi i i
Direct contact from splashing or immersion
Transfer of a chemical from a contaminated surface to skin following direct contact
Deposition or impaction on the skin as a vapor or aerosol
Assessing Dermal Exposures g p
Measurement Methods
Direct methods (absorbed pads, clothing, wipe sampling of contaminated s rface)
of contaminated surface)
C t i d i l i ith fl t hit i
Computerized image analysis with fluorescent whitening agents
Control devices (gloves, apron, clothing, etc)
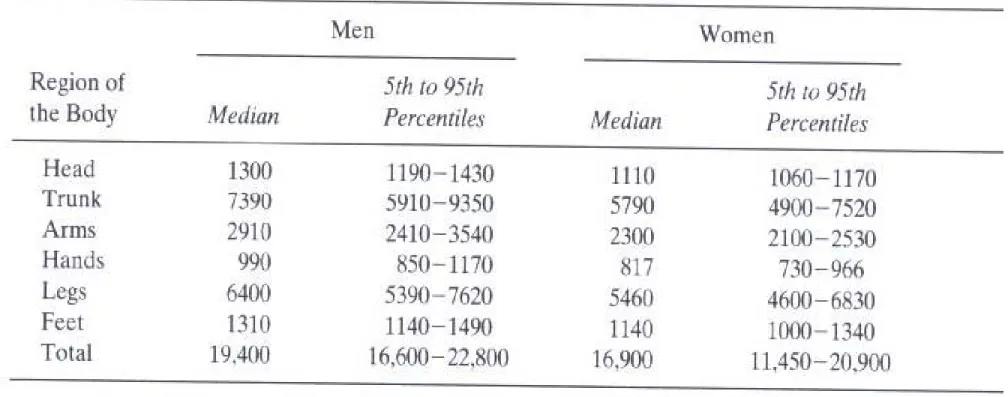
Table 6.2-2 Table 6.2 2
Surface area by region of the body for adults in cm
2Modeling Dermal Exposures
T ti t th t h i l th t i b b d th h ki
g p
To estimate the exposure to a chemical that is absorbed through skin
DA (S) (Q) (N) (WF) (ABS)
DA = (S) (Q) (N) (WF) (ABS)
(6-10)DA : dermal absorbed dose rate of the chemical (m/time) S : surface area of the skin contacted by the chemical Q : quantity deposited on the skin/event (m/L2/event)
Q q y p ( )
N : number of exposure events / day
WF : weight fraction of the chemical in the mixture
ABS : fraction of applied dose absorbed during the eventS : act o o app ed dose abso bed du g t e eve t
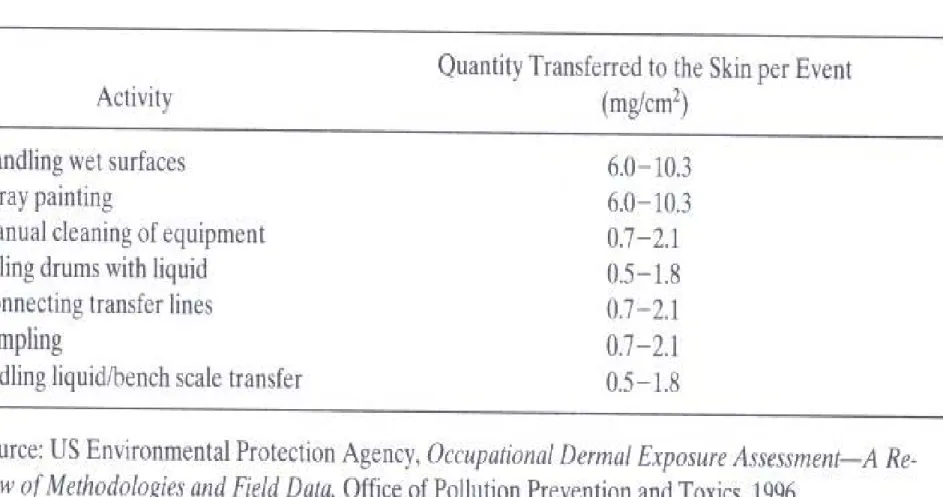
In the absence of monitoring data, value in Table 6.2-3 g may be y
used to estimate dermal exposure to liquids in plant operation
Table 6.2-3 Table 6.2 3
Q: Quality of chemical deposited on the skin per exposed event
Modeling Dermal Exposures
Th ki i i t t h d hili t l bl h i l d
g p
The skin is resistance to hydrophilic or water soluble chemical and permeability constant is unlikely to exceed 0.001 cm/hr.
Hydrophobic compounds are more readily absorbed and the penetration of organic solvents such as toluene and xylene may
(6-10)
penetration of organic solvents such as toluene and xylene may
approach 1 cm/hr.
Uptake Absorbed through the skin
Estimate the uptake of a chemical that is absorbed through the skin Estimate the uptake of a chemical that is absorbed through the skin when evaporation and organic solvent carrier effects are negligible.
DA = (S) (K
P) (ED) (WF) ( )
(6-11)DA : dermal absorbed dose of the chemical (M)
S : surface area of the skin contacted by the chemical (L2)
K
P: permeability coefficient for the chemical (L/time)
ED d i ( i )
ED : exposure duration (time)
WF : weight fraction of the chemical in the mixture (-)
: density of the mixtures (M/L
3)
: density of the mixtures (M/L
3)
Permeability Coefficient
B d diff i f i i l ti th h th
y
Based on diffusion of organics in aqueous solution through the skin (US EPA 1992)
) (
0061 .
0 )
log(
71 . 0 72
. 2 )
log( K
P K
OW MW
(6-12)KP : permeability coefficient of the chemical through the skin (cm/hr) KOW : oil-water partition coefficient (-)
MW : molecular weight of the chemical of concern (mass/mole) MW : molecular weight of the chemical of concern (mass/mole) (Example 6 2-5)
(Example 6.2-5)
6.3 Exposure Assessment
for Chemicals in the Ambient Environment
Exposure to Toxic Air Pollutants
for Chemicals in the Ambient Environment
Exposure to Toxic Air Pollutants
Four-Step Process
Four-Step Process
1
st- Step: identify pollutants likely to be in ambient air
(factories, consumer goods, wastes can be released toxic pollutants to air)
2
nd- Step: estimate the quantities of pollutants released by point, area and mobile sources
area, and mobile sources
- Point sources : plants, mills, refineries, waste incinerators, etc. (sites with specific location)
- Area sources : many small sources releasing pollutants to air in a definedArea sources : many small sources releasing pollutants to air in a defined area (dry cleaner, metal plating operations, gas stations, etc)
- Mobile : automobiles, buses, etc. (important sources of NOx, SOx, HCs, etc )
etc.)
6.3 Exposure Assessment
for Chemicals in the Ambient Environment
Exposure to Toxic Air Pollutants
for Chemicals in the Ambient Environment
Four-Step Process
3
rdd- Step: estimate the concentration of toxics at the location where exposure occurs
- Dispersion of air pollutants is a function of wind direction, speed, and terrain shapes such as hill, flat, mountains, etc.
( Gaussian Dispersion Model )
4
th- Step : estimate the number of persons exposed to a toxic air pollutant
- Demographers can estimate the number of persons living in source areas
- Combining the concentration estimates and the census data, one
ti t b f l d t t i i ll t t
can estimate numbers of people exposed to toxic air pollutants
(http://www .epa.gov/enviro/index.java.html )
Gaussian Dispersion Model
h t i th dil ti f t i i ll t t ith di t f th
characterize the dilution of toxic air pollutants with distance from the source
) 5
. 0 exp(
)
(
1
2 2 Q
x yU H
zC
C : concentration of toxic air pollutant (g/m3) Q : source release rate ((g/sec)
U : mean wind speed at the stack height (m/s)p g ( ) H : effective height of release above the earth (m) y : distance in a direction transverse to the wind Z : height at which the observation is made
Z : height at which the observation is made
: standard deviation of the concentration
b b ( d l)
b z
y
ax
A, b : constant ( nondimensional)x : distance downwind from the source(length)
Parameters are in Table 6.3-1 (Example 6.3-2)
T bl 6 3 1 R i ti f di i ffi i t
Table 6.3-1 Regression equations for dispersion coefficients
Dermal Exposure to Chemicals
i bi i
A ti iti C D l E
in ambient environment
Activities Cause Dermal Exposure
Swimming (in river, lake, stream) : high frequency
(low frequency : water skiing fishing standing in the rain) (low frequency : water skiing, fishing, standing in the rain)
Frequency of swimming in natural surface water : number and duration
duration
Exposure Scenarios
Inherent assumption: clothing prevents dermal contact and
Inherent assumption: clothing prevents dermal contact and subsequent absorption of contaminants
Swimming and bathing scenarios, past exposure assessments g g p p have assumed that 75~100 % skin surface is exposed.
Data on surface area of body : Table 6.2-1
Example 6.3-3
Effect of Chemical Release to Surface Waters on Aquatic Biota
Wastewater Contaminant and Treatment Wastewater Contaminant and Treatment
Contain a fraction of chemical produced and raw materials
They must be either treated by facilities at the plant site, or at a They must be either treated by facilities at the plant site, or at a publicly owned treatment works (POTW)
Removal of chemicals during wastewater treatment follows
1. Adsorption to suspended solids in the primary clarifier, aeration basin, and secondary clarifier
2. Volatilization through surface vaporization in the primary and 2. Volatilization through surface vaporization in the primary and
secondary clarifiers and through air-stripping in aeration basins 3. Biodegradation by aeration microorganisms, commonly in an
d l d b
activated sludge basin
Models to Predict chemical Fate in a POTW
Fugacity approach Clark et al 1995 (Table 6 3 2)
Fugacity approach , Clark et al , 1995 (Table 6.3-2)
( http://www.usgs.gov/usa/nwis/sw)
Table 6.3-2
Removal efficiencies in a POTW Calculated by Clark et al , 1995
Models to Predict Chemical Fate in a POTW
S f i f h h i l f
Surface water concentrations of the chemical of concern in free flowing rivers and streams
WWT/100) ] [Release (1
SWC ]
StreamFlow [Release
SWC
SWC : surface water concentration (mass/volume)
Release : quantity of chemical released in wastewater (mass/time) WWT : percent removal in wastewater treatment
Stream flow : measured or estimated flow of the receiving
stream (volume/time) (Example 6 3 4)
stream (volume/time) (Example 6.3-4)
Ground Water Contamination
Typical Solid waste Treatments
land disposal or landfills
less commonly surface impoundments and land treatment
less commonly, surface impoundments and land treatment (problems)
1. Chemicals may leach from the wastes carry into soils
l bili yi t d i ki t y
solubilize in water drinking water
2. Not discovered until long after the actions leading to the contamination is occurred (delay in detection) ( y )
Drinking Water Standards
US National primary Drinking Water Standards by EPA p y g y (Table 6.3-3)
Modeling Contaminants Migration in Groundwater
Equations governing flow, physical equilibrium and chemical rxn.
Modeling Contaminants Migration in Groundwater
Equation for convection and dispersion for dissolved, non-reactive constituents in a homogeneous sediment
t C u C
D C
2 2
t x
x
2C : concentration of dissolved solute in the groundwater (mass/volume) D h d d i di i it i th fl di ti (l th2/ti )
D : hydrodynamic dispersivity in the flow direction (length2/time) U : average interstitial groundwater velocity (length/time)
x : distance along the flow path (length) T : the temporal variable (time)
Hydrodynamic dispersion is due to mixing of groundwater and
l l diff i f th di l d i
molecular diffusion of the dissolved species
u D D
: dynamic dispersivity of porous media (length, typical value is 0.1) D*: coefficient of molecular diffusion of the solute (length2/time)
t C x
u C x
D C
2 2
Boundary Condition and Analytical Solution
0 ,
) , 0 (
0 ,
0 )
0 , (
0
t C t
C
x x
C
0 ,
0 )
, (
, )
,
(
0
t t C
Solution for saturated, homogeneous porous media
]}
) 4
/(
) [(
) / exp(
] ) 4
/(
) [(
{ )
,
(x t C0 erfc x ut Dt 1/2 u D erfc x ut Dt 1/2
C
erfc : complementary error function tabulated in data books
S l ti f t i ti i i d f th i
Solution for contamination is carried away from the source in x- direction, the concentration distribution from instantaneous
l f M i
release of mass M is
]}
4 / [ ] 4 / [ ] 4 / ) [(
2exp{
/ ]1 3[
/ )2 ( 8 ) , , ,
( x ut 2 Dt y2 D t z2 Dt
D D D t
t M z y x
C x y z
) [ ]
(
8 Dz
Dy Dx
t
- Maximum occurs where x = ut, y = 0, z = 0
- Zone in which 99 7% of the contamination mass occurs is Zone in which 99.7% of the contamination mass occurs is
described by ellipsoid of d
i= (2D
it)
1/2(Example 6.3-5)
6.4 Designing Safer Chemicals
A challenge for chemical engineers is to the general principle in g g g p p designing chemicals that will reduce toxicity. The semi-quantitative principle and guideline (DeVito, 1996) that can be used in designing safer chemicals
safer chemicals.
In designing safer chemicals, it is useful to think about modifying properties so that
persistence and dispersion in the environment are minimized, reducing exposures
t k b th b d i i i i d d i d d
uptake by the body is minimized, reducing dose, and
toxicity is minimized
This section will consider property modifications that can lead to
reduced exposure, dose, and toxicity.
6.4 Designing Safer Chemicals
6.4.1 Reducing Dose
Converting an exposure (e.g., inhaling a chemical) into a dose (e.g.,
6.4.1 Reducing Dose
g p ( g , g ) ( g ,
absorption by the blood through the lung membrane) generally involves the transport of a chemical across a membrane.
The three primary membranes of interest are
the lung, which controls uptake of chemicals that are inhaled;
the skin, which controls uptake of chemicals from dermal exposures;
the gastrointestinal tract, which controls uptake of chemicals that are ingested.
S f h h i i f h b li d i T bl 6 4 1
Some of the characteristics of these membranes are listed in Table 6.4-1.
Table 6.4-1
Characteristics of membranes that control chemical uptake by the body
It is apparent that pp
the gastrointestinal tract has one of the greatest surface areas available
for uptake of chemicals
gastrointestinal: a. 위장(胃腸)의
for uptake of chemicals by the body.
6.4 Designing Safer Chemicals
6.4.1 Reducing Dose
The uptake of chemicals across this membrane is controlled by
lipid solubility, water solubility, dissociation constant and molecular size.
High water solubility enhance uptake through gastrointestinal tract because water soluble materials are more easily mobilized in the large and small
i t ti d th t i l th f i l t f i t
intestine and the materials therefore experience less mass transfer resistance in migrating to the intestine wall.
I hi h li id l bili h k d h
In contrast, high lipid solubility enhance uptake and transport across the membrane. Thus, the compounds that are likely to be transported from the gastrointestinal tract into the blood streams are compounds with moderate water solubility and moderate lipid solubility.
Highly water soluble (lipid insoluble) and highly lipid soluble (log Kow > 5,g y ( p ) g y p ( g , water insoluble) compounds are less likely to be taken up through the gastrointestinal tract.
6.4 Designing Safer Chemicals
6.4.1 Reducing Dose
Molecular weight also plays a role in determining uptake through the gastrointestinal tract. A general guideline is that molecules with molecular
i h l h 300 h b h d li id l bl ll b b d
weight less than 300 that are both water and lipid soluble are well absorbed, and those with molecular weights in excess of 1000 are sparingly absorbed.
The lung also provides a relatively large surface area for uptake of chemicals. The lung is a relatively thin membrane and because the
b i thi li id l bilit l l f l i h i l t k
membrane is so thin, lipid solubility plays less of a role in chemical uptake than for the gastrointestinal tract. High water solubility will promote uptake through the lung, as will the delivery of the compound on fine particlesg g, y p p (less than 1 micron in diameter). Small particles can be inhaled deeply and will deposit deep in the lung, allowing the chemicals adsorbed on or dissolved in the particles to reside in the lung for very long periods
dissolved in the particles to reside in the lung for very long periods.
6.4 Designing Safer Chemicals
6.4.1 Reducing Dose
The skin presents a formidable barrier to chemical transport. For a chemical to be taken up through the skin, it must pass through multiple layers. As with the gastrointestinal tract moderate lipophilicity (log K < 5) with the gastrointestinal tract, moderate lipophilicity (log Kow < 5) promotes absorption through skin because transport must occur through both largely lipid and largely aqueous layers.
Finally, note that once a compound is absorbed into the blood stream, it must still reach a target organ. Many organs have their own barrier to
k h i fl d ( h bl d b i b i i il
uptake that may influence dose (e.g., the blood-brain barrier is more easily crossed by lipophilic materials).
In addition, chemicals may be removed by the body through urine and feces before the target organ is reached (water solubility enhances elimination via this mechanism).)
6.4 Designing Safer Chemicals
6.4.2 Reducing Toxicity
Design safer chemicals by reducing toxicity requires knowledge of the
g y
mechanisms by which compounds exert a toxic effect. While these mechanisms are not known in many cases, there are a few general
h i f t i it th t b i d l di t f h i l
mechanisms for toxicity that can be examined, leading to safer chemical designs.
One group of mechanisms associated with toxic effects are the reactions of electrophilic species with nucleophilic substituents of cellular macromoleclues such as DNA, RNA, enzymes, and proteins. Table 6.4-2 presents the possible effects of a number of common electrophilies.
Table 6.4-2 examples of Electrophilic substituents and reactions they
undergo with biological nucleophilies, and the resulting toxicity g g p g y
6.4 Designing Safer Chemicals
Id ll h f h ld b id d h i h
6.4.2 Reducing Toxicity
Ideally, the use of these groups would be avoided, however, in many cases the electrophilic groups are necessary to produce a desired property.
For example, for the case of the unsaturated carbonyls, the Michael additionp , y , reaction that causes the toxic effect may be the desired commercial property.
Nevertheless, the toxic effects can sometimes be reduced by introducing selected s bstit ents
substituents.
For example, the addition of a methyl substituent to ethyl acrylate reduces potential health effect. Isocyanates present another example. In this case, the electrophilic nature of the isocyanate can be masked in some applications by converting the material to a ketoxime derivative The ketoxime derivative is then removed in situ material to a ketoxime derivative. The ketoxime derivative is then removed, in situ, during the use of the componds. This reduces potential exposures and the resultant toxicity.
Case study of structural modification leading to reduce toxicities (http://www.epa.gov/greenchemistry/gces.htm)
Biokinetics of Nano-sized Particles.
Biokinetics of Nano-sized Particles.
Biokinetics of Nano-sized Particles.
While many uptake and translocation routes have been demonstrated, others still are hypothetical and need to be
i ti t d L l k t l ti t ll
investigated. Largely unknown are translocation rates as well as accumulation and retention in critical target sites and their underlying mechanisms
underlying mechanisms.
These as well as potential adverse effects will be largely dependent on physicochemical characteristics of the surface and core of nano-sized particles. Both qualitative and quantitative changes in nanosized particles' biokinetics in a diseased or compromised organism need also to be
id d
considered.
US Presidential Green Chemistry Challenge 1996: Designing Safer Chemicals Award g g
Sea Nine™ Biocide
Example of fouling