Basic Research Report 19-09
Assessing the Performance of Korea’s GHG Emissions Trading Scheme in Phase Ⅰ
Insung Son
Research Staff
Head Researcher: Insung Son, Associate Research Fellow Outside Participants: Young-Hwan Ahn, Sookmyung Women’s
University
Su-Yol Lee, Chonnam National University
ABSTRACT
The human capacity has increased significantly compared to before the Industrial Revolution. The expanded human capacity requires a lot of energy, and we have mainly relied on fossil fuels to supply a lot of energy cheaply and easily. However, the use of fossil fuels results in social costs due to acid rain caused by nitrogen oxides (NOx) and sulfur oxides (SOx), and climate change caused by greenhouse gas emissions such as carbon dioxide. Greenhouse gases, in particular, accumulate in the Earth's atmosphere, causing climate change across the planet in the long run.
Therefore, one nation's efforts alone cannot solve the problem of the entire planet.
Climate change mitigation has the properties of a public good. This makes it difficult for any country to make voluntary and proactive efforts to reduce greenhouse gas emissions.
Countries from all over the world began to discuss reduction of greenhouse gases and solutions to climate change, and as a result, the United Nations Framework Convention on Climate Change (UNFCCC) in 1992 and the Kyoto Protocol in 1997 were adopted.
Meanwhile, in line with such international efforts, Korea introduced the possibility of an emissions trading scheme through the Framework Act on Low Carbon and Green Growth in 2010, with actual introduction taking place in 2015 after five years of preparation. Since 2015 was before the Paris Agreement was adopted and entered into force, Korea was not obliged to reduce greenhouse gas emissions as a UNFCCC non- Annex I country. Nevertheless, Korea decided to introduce its emissions trading scheme to proactively respond to climate change and greenhouse gas reduction and to foster and support low-carbon industries as new growth engines.
The adoption of the Paris Agreement in 2015 and its early entry into force in 2016 has led to a major change in the international framework for mitigating climate change. Under the Paris Agreement, reducing greenhouse gas emissions is no longer the only responsibility of developed countries. All countries have to nationally set and faithfully implement greenhouse gas reduction targets. Korea also presented an ambitious goal to reduce its greenhouse gas emission forecast by 37 percent in 2030 from the Business As Usual (BAU) through the INDC (Integrated Nationally Determined Distribution) submitted to the UNFCCC in 2015.
Given that emissions from companies subject to emissions trading account for about 70 percent of the country's total emissions, the emissions trading scheme is one of the most important means to achieve the 2030 greenhouse gas reduction target.
Currently, the country's emissions trading scheme has wrapped up the first phase from 2015 to 2017, and the second phase has been in operation since 2018. At the end of the first phase, the results of the emissions trading scheme, its impact on greenhouse gas emissions, and its impact on covered companies will be analyzed to assess the operational performance of the emissions trading scheme in the first phase so that the implications for its future operation can be derived.
1. Purpose for analysis
Greenhouse gas reduction activities always involve the costs of installing and operating reduction facilities, replacing facilities to convert low-carbon fuels, and streamlining production processes. In addition, the cost of reducing greenhouse gas emissions includes profits abandoned due to reduced production activities as opportunity costs.
Greenhouse gas reduction policy, such as the emissions trading scheme, due to the cost of reducing greenhouse gas emissions causes many concerns and discussions about its impact on the national economic and industrial sector competitiveness.
Therefore, it is important to minimize the costs of reducing greenhouse gas emissions or achieving emission targets to minimize the negative impact on the competitiveness of the national economy and the industrial sector.
The greenhouse gas emissions trading scheme is one of the ways to achieve a set amount of emissions or reductions for minimum cost. However, an efficient, fully competitive market is needed to achieve cost-effective greenhouse gas reduction, which is the purpose of introducing the emission trading scheme.
This study therefore set the greenhouse gas reduction performance of the emission trading scheme (related to (A) in [Figure Summary-1], the efficiency of the emission trading market (relevant to (B) in [Figure Summary-1]) as a precondition for achieving cost effectiveness, and the impact on the competitiveness of the allocation companies in introducing the emission trading scheme (C) in [Figure Summary-1].
Figure Summary-1. Subject of Analysis: Conceptual Map
In addition, each analysis target was statistically verified of the greenhouse gas reduction performance resulting from the introduction of the emission trading scheme, and analyzed whether the emission trading market was operated efficiently and how the emission trading scheme affected corporate competitiveness. Finally, based on the results analyzed from three perspectives, the implications for the efficient operation of the future greenhouse gas emissions trading scheme (see Figure Summary-2).
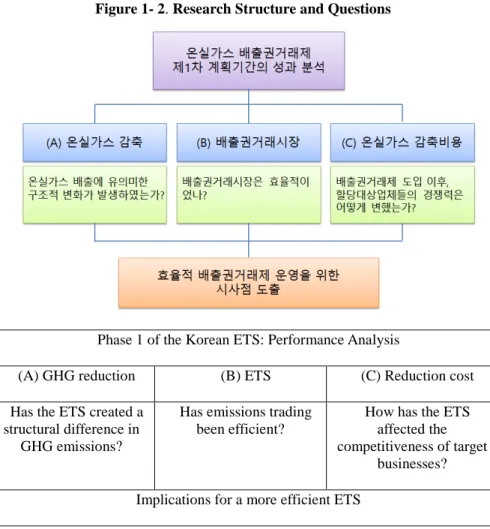
Figure Summary-2. Research Structure and Questions
2. Analysis results
2.1. Greenhouse gas reduction performance
According to the ‘Basic Plan for Emissions’, which was announced in 2014, the first phase was aimed at accumulating experience in the emission trading scheme and settling the system (Planning Finance Ministry, 2014). During the first phase, the total emissions of the companies to be allocated stood at 98.76% of the total emissions allowance (1,689.9 million CO2e. tons) during the first phase. This can also be assessed to have played a major role in reducing greenhouse gas emissions and curbing the increase in greenhouse gas. However, it is not sufficient to assess whether the emissions trading scheme has contributed to the reduction of greenhouse gases by simply comparing the total emission allowance and the certified emissions.
In this study (Chapter 2) for assessing the performance of greenhouse gas reduction during the first phase of the emission trading scheme, the company chose a method to confirm quantitatively whether the relationship between adjusted tangible assets and greenhouse gas emissions as surrogate variables for energy use, sales and capital of each industry has improved since the introduction of the emission trading scheme.
Although the statistical analysis of all industries could not be performed due to limitations of data, the transition team, steel, petrochemicals, semiconductors, displays, electronics, and automobile industries checked whether there had been statistically significant reduction results since the introduction of the emission trading scheme. The analysis results were very different for different sectors and industries.
First of all, the relationship between energy use and sales volume of greenhouse gas emissions has worsened since the introduction of the emission trading scheme, while the effect of adjusted tangible assets has been improved in a way that contributes to the reduction of greenhouse gas emissions. In the case of petrochemical industries, which are representative multitem industries, no statistically significant changes have been found in the effects of major variables on greenhouse gas emissions since the introduction of the emission trading scheme.
Meanwhile, the steel industry and the semi-d-autonomous industries were the ones with the most clear reduction results. The steel sector saw its impact on greenhouse gas emissions improved both in energy use and sales, but the impact of adjusted tangible assets worsened, the report showed. The impact of energy use on greenhouse gas emissions has improved in semi-d, digital and industrial sectors, and the impact of sales has worsened. However, considering both the greenhouse gas emission characteristics and the data used in this analysis, it is deemed that the reduction in greenhouse gas emissions per unit energy in the semi-d, de-d, and specialty sectors is attributable to the reduction of process emissions.
Finally, it was found that the effect of sales and adjustment tangible assets has
changed statistically significantly since the introduction of the emission trading scheme. But each direction of change was reversed. While the impact of sales on greenhouse gas emissions has been improved, the impact of adjusted assets has been shown to have worsened
There is something to be noted about the interpretation of the analysis results in this chapter. First of all, it should not be interpreted that industries that do not statistically significantly show the effect of introducing emission trading schemes in terms of greenhouse gas emissions have made any effort to reduce emissions. It should be considered that the companies to be allocated have been directly regulated from the greenhouse gas and energy target management system before the emission trading scheme. Therefore, what can be found in the analysis in this chapter is whether the transition from a target management system to an emission trading scheme resulted in additional reduction results.
2.2. Emissions Market Efficiency
Next, the biggest reason why emissions trading schemes are preferred over other direct regulations is that it is possible to achieve cost-effective reduction targets. In order to achieve the cost effectiveness of the emissions trading scheme, the emissions and reductions of all companies must be determined so that the marginal costs of reducing among the allocated companies are all equal. Under the emission trading scheme, the cost-effectiveness of all companies is met because the cost of limit reduction is equal based on the market price of the emission rights. However, this requires an efficient emission trading market.
It is impossible to assess the cost effectiveness achieved by assessing the marginal cost of all allocated companies. Instead, it is possible to assess the achievement of cost effectiveness indirectly by analyzing whether the emission trading market was efficient and assessing whether the prerequisites for achieving the cost effectiveness of the emission trading scheme have been achieved. Chapter 3 evaluated whether the emission trading market for the first phase was efficient through statistical verification methods.
弱形 Efficient Market Hypothesis (EMH) was approved using the Variance Ratio (VR) test to verify the efficiency of the local emission trading market. In the process, the first emission trading market in Korea reflected various characteristics of a thin market, which does not have many transactions. In this study, we conducted a separate analysis based on the price at the opening date as well as the price at which the transaction actually occurred, applied a modified AR(1) process on revenue, analyzed weekly data as well as daily data, and conducted a separate analysis on 2017 when transactions were relatively active during the first period. Lastly, the KAU18
transaction was also analyzed to see if there was any change in the efficiency of the emission trading market in the second period.
As a result, it was found that during the first phase, there was no support for the hypothesis that the emission trading market was efficient. Although the first implementation year of the second phase, 2018 was not fully supported, it was analyzed that support for Random Walk Hypothesis (RWH) was relatively high compared to the first phase. The relatively higher efficiency in 2018 compared to the first phase (2015-2017) is attributed to the relatively lower uncertainty over the price of emission rights.
2.3. Effects of ETS on Firms’ Competitiveness
Although emissions trading is known as a more flexible system than carbon tax or reduction regulations, companies and industries have been perceived as just another form of regulation, raising concerns about rising regulatory compliance costs and lower competitiveness in the market. Similar debates continued in the EU ETS and various studies were conducted on the impact of ETS on industry and corporate competitiveness. EU studies have shown that ETS’ impact on businesses and industries at micro-levels is in a wide variety of forms, with positive, negative, or insignificant consequences depending on industry, product and time, and thus fail to produce a consistent conclusion.
There was the same debate when Korea introduced the ETS, and the negative effects of the ETS were largely highlighted in the pre-predictive. The end of the first phase is a good opportunity to demonstrate the effect of ETS on the industrial and corporate competitiveness.
To this end, this study (Chapter 4) analyzed the impact of ETS on businesses and industries in three aspects. First, changes in the financial performance and output indicators of regulated entities before and after the ETS was implemented were statistically verified. Contrary to the negative concerns about the implementation of the ETS, the analysis showed that the financial situation of the company did not deteriorate after the implementation of the ETS. Many financial indicators have improved from a significant level. The reduced cost ratio of manufacturing costs to sales increased efficiency, while the total assets increased, while the debt-to-equity ratio decreased, improving overall financial conditions.
Second, regression analysis was performed to analyze the net effect of ETS.
Statistical verification of the ETS' explanatory power by controlling high-impact descriptive variables has shown that the effect of ETS is not statistically significant.
The effect of ETS was significant in terms of the ratio of sales costs, which contributed
to improving the efficiency of the company’s operations.
Third, a double-difference analysis was performed to verify the effectiveness of the ETS policy. According to the analysis of ETS regulated companies (experimental groups) and non-regulated companies (comparative groups) as the population of listed companies in Korea, the effect of the ETS system was not statistically significant.
There are limitations that cannot be called a rigorous analysis of the effectiveness of a plan because the comparator group for analysis does not exist in reality.
3. Implications and Policy Proposals
3.1. Inducing investment in reducing greenhouse gas emissions
To reduce greenhouse gas emissions, the cost of reducing greenhouse gases, including direct and opportunity costs, are incurred. Given both the opportunity cost of shrinking production activities and the economic impact on regional and fore-aft industries, investment for the introduction of reduction facilities or technologies must be brisk in order to reduce greenhouse gas emissions.
Therefore, the government's support for reducing greenhouse gas emissions should be made in three aspects. First, the government should support development of facilities and technologies that can be introduced by businesses to reduce greenhouse gas emissions, such as facilities and technologies for reducing greenhouse gas emissions, high-efficiency energy facilities, and processes for producing low-emission gases. Next, the government's policy should provide sufficient incentives to help greenhouse gas reduction investments actively take place. All investment activities are determined by comparing the investment costs with the benefits that will arise from the investment. Therefore, the government should set the direction of support to reduce the cost burden from investments in reducing greenhouse gas emissions and maximize the benefits from investments in reduction.
3.1.1. Development of Greenhouse Gas Reduction Technology
First of all, the government should set short and medium- and long-term directions for development of facilities and technologies for reducing greenhouse gas emissions and implement them separately. First, in the short term, support for technology development that is immediately applicable is needed to reflect the demand for technology development by allocating companies. The government can support the development of technologies and facilities that can be developed and applied in a short period of time by reflecting the demand for technology development by the companies
to be allocated, contributing to the actual performance of reducing greenhouse gas emissions and easing the burden on the companies to develop technologies, reduce greenhouse gas emissions, and purchase emission rights.
In the mid- to long-term, support for source technologies is needed. The nation relies mostly on overseas production facilities, processes and devices. In this case, the problem is that it is difficult for allocating companies to arbitrarily change facilities and processes to reduce greenhouse gas emissions. This is because if the companies to be allocated arbitrarily change their production facilities and processes, they will not receive guarantees and services from suppliers in the event of problems with future production facilities and processes. Therefore, securing original technologies for production facilities and processes in the long term could be the basis for the introduction of active greenhouse gas reduction facilities and technologies in the future.
3.1.2. Support for Investment Costs
Next, the government should expand the size of the greenhouse gas reduction support project, which is currently being carried out through the government offices, by utilizing the proceeds from the auction of paid dividends. On the other hand, for some projects, the upper limit should be mitigated or removed as it may limit support for projects that are costly but have significant reduction effects.
3.1.3. Reinforce incentives to invest in greenhouse gas reduction
The allocation method should be changed in such a way that it would benefit companies that have reduced emissions by proactively implementing greenhouse gas reduction investments. To that end, the government plans to increase the benchmark allocation. However, there is also something to be noted about benchmarked allocation. When benchmarks are set for each industry, the number of companies to be allocated for each industry is often limited. We need to think more about how to set up benchmarks for a small number of companies. And setting benchmarks by process that are common across industries, rather than by industry benchmarks, could also be an alternative.
In the application of benchmarking methods, equity among industries should also be considered. In setting benchmarks, some industries will be able to benefit a relatively large number of companies, while others will not be able to set relatively high benchmarks to allow many in the industry to be pressured to reduce.
Flexible operation of the system is required to effectively utilize the incentive system for investment in greenhouse gas reduction introduced from the second phase in order to increase the benefits of investment in reducing greenhouse gases and induce investment in reducing them under the emission trading scheme. This reduction incentive scheme increases the allocation of emission rights by providing the certified reduction performance in the last phase in addition to the expected emissions when allocating the emission rights for the next phase. However, controversy has been raised over the effectiveness of the method for verifying the reduction performance, saying that the certification rate of the actual reduction performance is not high due to excessive strictness. Therefore, it is necessary to flex its methodology for certifying reduction performance through close communication with companies subject to allocation.
In addition, the recognized reduction results will not be recognized during the next phase because the benefits will be applied only to the next phase. However, rather than uniformly applying the duration of the application of the reduction performance, more long-term benefits should be provided in consideration of the life of the reduction facilities and technologies, the size of the investment in the reduction, and the duration of the reduction performance.
Finally, most newly introduced facilities use high-efficiency equipment at the time of introduction, or most of them introduce reduction facilities. Nevertheless, the current allocation method for new facilities requires a certain percentage reduction by applying the adjustment factor. However, this would weaken the need to introduce high-efficiency or reduction facilities in the introduction of new facilities, thus delaying investment to the future for real greenhouse gas reduction. Therefore, the guidance should be changed so that new facilities can be excluded from the application of the adjustment factor considering the facility efficiency and the introduction of the facility.
3.2. Improving Emissions Market Efficiency
To increase the efficiency of the local emissions trading market, the government should increase liquidity and lower information costs in the market. So far, the government has mainly increased liquidity through changes to market rules, such as restrictions on carryovers. However, frequent changes in market rules reduce the transparency and consistency of information, thereby increasing information costs for companies participating in the market, which can eventually lead to market inefficiencies. Therefore, in the future, it is desirable to improve market efficiency by actively utilizing government holdings, expanding the role of market makers, introducing emission price caps, and introducing futures markets rather than changing market rules.
3.3. Changing the perception of policymakers and businesses
The analysis results provide policymakers and business practitioners with the following policy and strategic implications: First, consistent implementation of the emissions trading scheme is required. In addition, the ETS can induce innovation and improvement in the targeted enterprise and should orientate the implementation of the scheme in that direction. The continuing concern about the economic impact of the ETS, especially its possible impact on the industry, could undermine the consistency of the implementation of the scheme. Pre-predictive models based on static modeling can overemphasize the negative effects of ETS, encouraging excessive policy changes and intervention. There was no negative impact of ETS on businesses and industries during the first phase. The direct effects of the ETS have not been confirmed, but it has been shown that the operating efficiency of the target companies has improved steadily during the implementation of the plan. If the ETS can become an innovation engine for regulated businesses like the system features, it is also fully possible to pursue the intended reduction of greenhouse gas emissions and corporate competitiveness at the same time. Porter and van der Linder (95) is leaving open the possibility of being confirmed in carbon policy.
Second, a shift in perception of ETS by businesses and industries is required. A strategic approach is needed to recognize ETS as another environmental regulation that can be used as an opportunity for improvement and innovation, rather than a negative and passive response. The government should develop and implement strategies to secure competitiveness by reducing manufacturing costs through improved process efficiency, increasing sales through development of low-carbon products, improving reputation through active response to climate change and reducing potential risks. Efforts should also be made to integrate ETS with the entity’s original management activities so that it can take full advantage of the flexible system utilizing market mechanisms.
Table of Contents
ABSTRACT ... 3
1. Purpose for analysis ... 4
2. Analysis results ... 6
2.1. Greenhouse gas reduction performance ... 6
2.2. Emissions Market Efficiency ... 7
2.3. Effects of ETS on Firms’ Competitiveness ... 8
3. Implications and Policy Proposals ... 9
3.1. Inducing investment in reducing greenhouse gas emissions ... 9
3.2. Improving Emissions Market Efficiency ... 11
3.3. Changing the perception of policymakers and businesses ... 12
Chapter I. Introduction ... 21
1. Preface... 21
2. Subject of Analysis ... 24
3. Research Structure and Questions ... 25
Chapter II. Performance of GHG Emissions Reduction ... 29
1. Introduction ... 29
1.1 Research Purpose and Background ... 29
1.2. Analytical Approach and Composition of the Chapter ... 30
2. Allocation of Emission Permits and Trend in Amounts of Certified Emissions ... 31
2.1. Transition Sector ... 32
2.2. Industrial Sector ... 35
3. Model of Analysis ... 43
3.1. Literature Survey ... 43
3.2. Model of Analysis ... 45
3.2. Data ... 47
4. Results of Analysis ... 50
4.1. Transition Sector ... 51
4.2. Industrial Sector... 57
5. Chapter Conclusion ... 74
Chapter III. Market Efficiency under the First Phase of the Korean ETS .... 77
1. Introduction ... 77
2. Transaction Volume of the First Phase and Literature Review ... 78
2.1. Volume and Characteristics of Transactions in the First Phase ... 78
2.2. Literature Review ... 84
3. Efficiency of the Korean ETS during the First Phase ... 86
3.1. Method ... 86
3.2. Data ... 89
3.3. Results ... 90
3.4. Discussion ... 93
4. Chapter Conclusion ... 97
Chapter IV. Impact of the ETS on Business Competitiveness ... 98
1. Research Purpose and Background ... 98
4. Literature Review ... 98
2.1. EU ETS ... 98
2.2. Korean ETS ... 101
3. Impact of the Korean ETS on Business Competitiveness ... 102
3.1. Method of Analysis ... 102
3.2. Findings... 104
5. Chapter Conclusion ... 111
Chapter V. Conclusion ... 113
1. Results ... 114
1.1. Performance of GHG Emissions Reduction ... 114
1.2. Efficiency of the Emissions Trading Market ... 115
1.3. Effect on Business Competitiveness ... 115
2. Policy Implications ... 116
2.1. Fostering Investment towards Reducing GHG Emissions ... 116
2.2. Enhancing Efficiency of the Emissions Market ... 119
2.3. Changing the Perception of Policymakers and Businesses ... 120
References ... 121
Appendix ... 128
List of Tables
Table 2- 1. Original and Revised Lists of ETS-Targeted Sectors and Industries ... 31
Table 2- 2. Final Emissions Allowances and Certified Emissions: Transition Sector ... 32
Table 2- 3. Emission Permit Trading, Submissions and Carryforwards: Transition Sector (2015-2017) ... 33
Table 2- 4. Trend in Certified Emissions: Transition Sector ... 34
Table 2- 5. Final Emissions Allowances and Certified Emissions by Industry: Industrial Sector (1) ... 36
Table 2- 6. Final Emissions Allowances and Certified Emissions by Industry: Industrial Sector (2) ... 36
Table 2- 7. Emission Permit Trading, Submissions and Carryforwards: Industrial Sector (1) (2015-2017) ... 38
Table 2- 8. Emission Permit Trading, Submissions and Carryforwards: Industrial Sector (2) (2015-2017) ... 39
Table 2- 9. Trend in Certified Emissions: Industrial Sector (1) ... 41
Table 2- 10. Trend in Certified Emissions: Industrial Sector (2) ... 42
Table 2- 11. Trend in Certified Emissions: Industrial Sector (3) ... 43
Table 2- 12. Dataset for Analysis ... 48
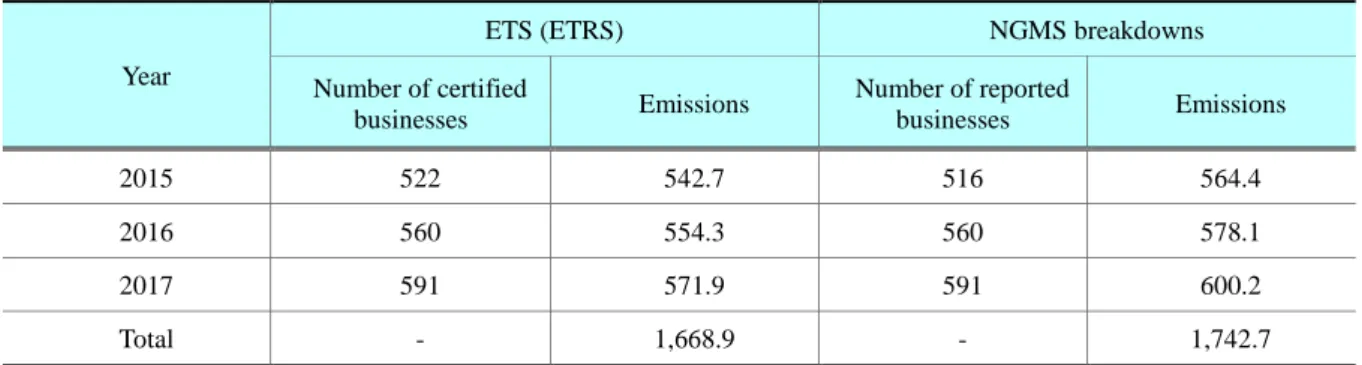
Table 2- 13. Emissions from Subject Businesses as Indicated in Different Sources 49 Table 2- 14. Analysis of Estimated Coefficients ... 51
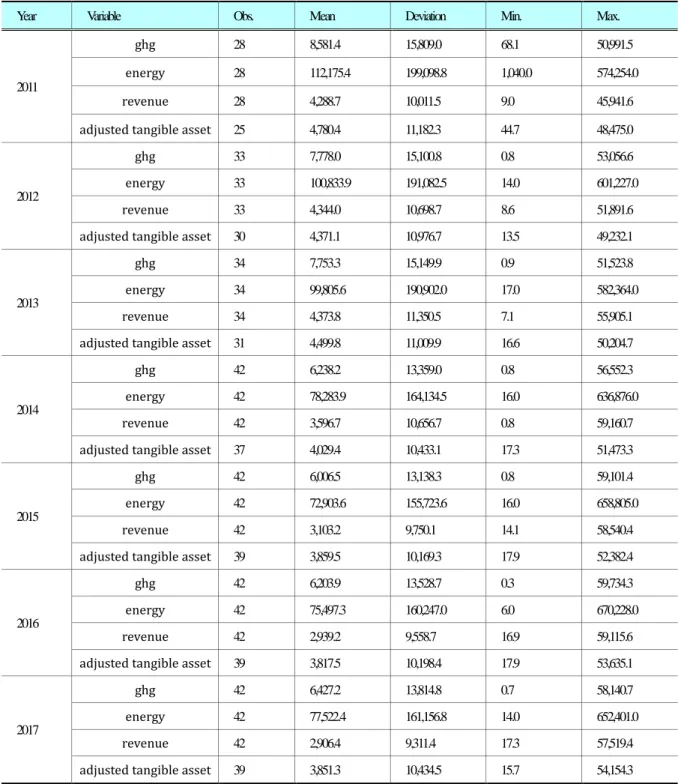
Table 2- 15. Major Variables and Descriptive Statistics: Transition Sector ... 52
Table 2- 16. Model Test Results: Transition Sector ... 53
Table 2- 17. Analysis Results: Transition Sector ... 55
Table 2- 18. Sources of Energy for Power Generation in Korea ... 57
Table 2- 19. Descriptive Statistics of Major Variables: Steel Industry ... 58
Table 2- 20. Model Test Results: Steel Industry ... 59
Table 2- 21. Analysis Results: Steel Industry ... 61
Table 2- 22. Descriptive Statistics of Major Variables: Petrochemical Industry ... 62
Table 2- 23. Model Test Results: Petrochemical Industry ... 63
Table 2- 24. Analysis Results: Petrochemical Industry ... 64
Table 2- 25. Descriptive Statistics of Major Variables: SDE Industry ... 66
Table 2- 26. Model Test Results: SDE Industry ... 67
Table 2- 27. Analysis Results: SDE Industry ... 69
Table 2- 28. Descriptive Statistics of Major Variables: Automobile Industry ... 71
Table 2- 29. Model Test Results: Automobile Industry ... 72
Table 2- 30. Analysis Results: Automobile Industry ... 73
Table 3- 1. Emission Permit Trade by Year ... 79
Table 3- 2. Average Prices of Emission Permits Per Unit Weight by Year ... 79
Table 3- 3. Number of Transactions by Year ... 80
Table 3- 4. Average Quantity of Emissions Per Transaction ... 81
Table 3- 5. Quantity of Emissions Traded in KAUs by Year ... 82
Table 3- 6. Number of KAUs Traded by Year ... 82
Table 3- 7. Average Price of Emissions Per Unit Weight: KAU Transactions ... 83
Table 3- 8. Summary of Major ETS Studies ... 86
Table 3- 9. Summary Statistics 1 ... 89
Table 3- 10. Summary Statistics 2 ... 90
Table 3- 11. KAU15-17 (Number of Open Days): VR Test Results ... 91
Table 3- 12. KAU15-17 (Number of Transaction Days): VR Test Results ... 91
Table 3- 13. KAU15-17 (Number of Open Weeks): VR Test Results... 92
Table 3- 14. KAU17 (Number of Transaction Days): VR Test Results ... 92
Table 3- 15. KAU17 (Number of Transaction Days): VR Test Results ... 93
Table 4- 1. Sample Distribution by Sector and Industry ... 103
Table 4- 2. Variables and Datasets ... 104
Table 4- 3. Pre- and Post-ETS Financial Performance of Targeted Businesses (T-Test) ... 105
Table 4- 4. Pre- and Post-ETS Financial Performance (T-Test): Transition Sector 106 Table 4- 5. Pre- and Post-ETS Financial Performance (T-Test): Manufacturing Sector ... 107
Table 4- 6. Pre- and Post-ETS Average Revenue: Manufacturing Sector ... 107
Table 4- 7. Impact of the ETS on Revenue and Cost: Regression Analysis ... 108
Table 4- 8. Impact of the ETS on Financial Performance and Employment: Regression Analysis ... 109
Table 4- 9. Compared Groups for DID Analysis on Effects of the ETS ... 110
Table 4- 10. Net Effect of the ETS: DID Analysis ... 111
Appendix Table 1. Model Test Results (Fixed- or Random-Effect): F&B ... 128
Appendix Table 2. Equation (2) Estimates: F&B ... 129
Appendix Table 3. Model Test Results (Fixed- or Random-Effect): Paper ... 130
Appendix Table 4. Equation (2) Estimates: Paper ... 131
Appendix Table 5. Model Test Results (Fixed- or Random-Effect): Glass/Ceramics ... 132
Appendix Table 6. Equation (2) Estimates: Glass/Ceramics ... 133
Appendix Table 7. Model Test Results (Fixed- or Random-Effect): Cement ... 134
Appendix Table 8. Equation (2) Estimates: Cement ... 135
Appendix Table 9. Model Test Results (Fixed- or Random-Effect): Non-Iron Metals ... 136
Appendix Table 10. Equation (2) Estimates: Non-Iron Metals ... 137
Appendix Table 11. Statistical Thresholds for Non-Revenue-Adjusting Analysis: KAU15-17, Number of Open Days (n=880) ... 138
Appendix Table 12. Statistical Thresholds for Non-Revenue-Adjusting Analysis:
KAU15-17, Number of Open Days (n=879) ... 139 Appendix Table 13. Statistical Thresholds for Non-Revenue-Adjusting Analysis:
KAU15-17, Number of Open Days (n=385) ... 140 Appendix Table 14. Statistical Thresholds for Non-Revenue-Adjusting Analysis:
KAU15-17, Number of Open Days (n=384) ... 141 Appendix Table 15. Statistical Thresholds for Non-Revenue-Adjusting Analysis:
KAU15-17, Number of Open Days (n=171) ... 142 Appendix Table 16. Statistical Thresholds for Non-Revenue-Adjusting Analysis:
KAU15-17, Number of Open Days (n=170) ... 143 Appendix Table 17. Statistical Thresholds for Non-Revenue-Adjusting Analysis:
KAU17, Number of Open Days (n=249) ... 144 Appendix Table 18. Statistical Thresholds for Revenue-Adjusting Analysis: KAU17,
Number of Open Days (n=248) ... 145 Appendix Table 19. Statistical Thresholds for Non-Revenue-Adjusting Analysis:
KAU18, Number of Open Days (n=153) ... 146 Appendix Table 20. Statistical Thresholds for Revenue-Adjusting Analysis: KAU18, Number of Open Days (n=152) ... 147
List of Figures
Figure 1- 1. Subject of Analysis: Conceptual Map ... 24
Figure 1- 2. Research Structure and Questions ... 26
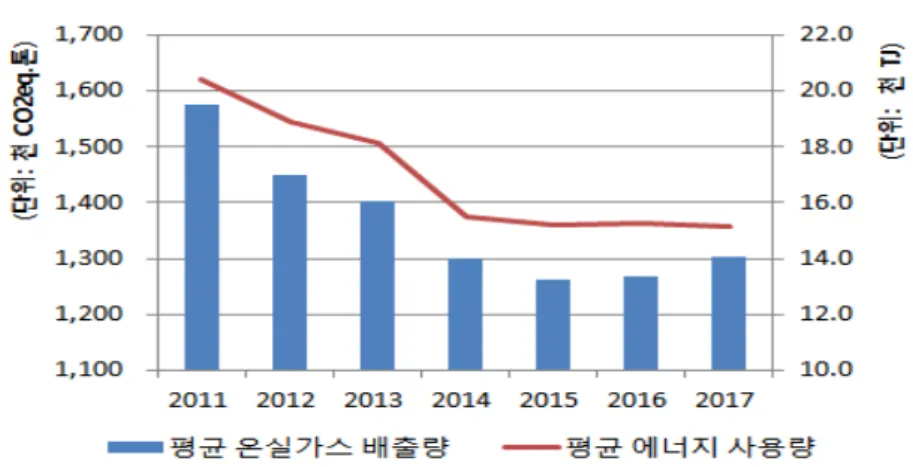
Figure 2- 1. Average GHG Emissions and Energy Demand per Business ... 50
Figure 2- 2. Electricity Demand in Korea by Sector ... 56
Figure 2- 3. GHG Emissions and Energy Demand: SDE Industry... 68
Figure 2- 4. GHG Emissions and Energy Demand Trend Since 2014: SDE Industry ... 70
Figure 3- 1. EU ETS1: Trend and Distribution of Return Rates ... 94
Figure 3- 2. EU ETS 2: Trend and Distribution of Return Rates ... 94
Figure 3- 3. Korean ETS 1: Trend and Distribution of Return Rates ... 95
Figure 3- 4. Korean ETS 1: Trend and Distribution of Return Rates in KAU18 ... 95
Figure 5- 1. Policy Support for Reducing GHG Emissions ... 117
Chapter I. Introduction
1. Preface
The human capacity to productively create things has been growing without limits since the Industrial Revolution. The relentless advancement of technology has enabled humans to do things they never imagined prior to industrialization. The radical growth of human capacity, however, has also dramatically increased the demand for energy to an increasingly unsustainable extent. Humankind has resorted to abundant and relatively cheap fossil fuels to satiate this growing demand for energy.
The growth of human capacity, aided by technology, and concomitant increases in dependence on fossil fuels have benefitted humankind to an unprecedented extent. Such benefit, though, has not come free of cost. In addition to direct expenses—mining, processing, and transporting—involved in their use, fossil fuels also extract an environmental cost to entire societies, including acid rain and climate change. Only recently have people begun to consider these long-overlooked, societal costs.
Governments worldwide have responded to the new concern about the rising societal cost of fossil fuels through a variety of policy measures. These include regulating the amounts of chemicals that can be used so as to prevent acid rain, and also requiring manufacturers to install devices that reduce harmful emissions such as nitrogen oxides (NOx) and sulfur oxides (SOx). The US government and others have also adopted emissions trading schemes (ETSs) on sulfur dioxides (SO2) and other such gaseous chemicals in an attempt to financially incentivize solutions.
Greenhouse gas (GHG) emissions accumulate in the atmosphere and cause long-term climate change around the globe. A problem of this magnitude cannot be resolved by a single state’s efforts. Reducing GHG emissions and crafting a variety of responses to climate change should therefore be regarded as a public good, i.e., alleviating the adverse impact of climate change for the global public. This means that, when climate change worldwide is abated through the conscious efforts of one state to reduce GHG emissions, this will also benefit other states that have not made such efforts. It is not possible for the effort-making state to prevent other states from benefitting from its work.
The public-good nature of such responses to climate change, paradoxically, is what prevents states from taking the initiative in leading the worldwide movement to reduce GHG emissions.
For this reason, states worldwide launched a series of dialogues in a concerted search for solutions to climate change, culminating in the 1992 United Nations Framework Convention on Climate Change (UNFCCC). The UNFCCC provides an overarching framework to guide individual state efforts and international talks on handling climate change, laying down long-term goals, differentiated the responsibilities of developed and developing countries, and facilitating the support needed to help developing countries reduce and adjust their GHG emissions (UN, 1992).
The UNFCCC, however, lacks specific and substantial measures on how GHG emissions are to be reduced. Accordingly, governments worldwide continued with follow-up talks in search for such measures, adopting the Kyoto Protocol in 1997. The Kyoto Protocol determined the target amounts by which developed states were to reduce their GHG emissions (UN, 1998).
The Clean Development Mechanism (CDM), the Joint Implementation (JI), and market mechanisms have also been introduced to enable developed states to achieve cost-effective reductions in emissions (UN, 1998). With the goal of fulfilling the emissions reduction quotas imposed by the Kyoto Protocol, the states listed on Annex I to the UNFCCC1 began to introduce a series of novel measures. Those in the European Union (EU), in particular, introduced the EU Emissions Trading Scheme (EU-ETS) in 2005 to that end (EU, 2003).
The South Korean government hinted at adopting a similar measure when it promulgated the Framework Act on Low-Carbon Green Growth (FALCGG) in 2010.2 After five years of preparation, the Korean government launched its own ETS in 2015. At the time, the Paris Climate Agreement (PCA) had not yet been proposed, and Korea was therefore a non-Annex I country that was not bound by the international treaties to reduce GHG emissions.
Nevertheless, the Korean government decided to implement the ETS in an
1 Annex I lists the developed countries that bore the obligation to reduce GHG emissions, through policy and other necessary actions, and the countries transitioning into the market economy at the time.
2 Paragraph (1), Article 46 (Introduction of Cap and Trade System): “The Government may operate a system for trading emissions of greenhouse gases by utilizing market functions in order to accomplish the State’s target of reducing greenhouse gases” (NLIC, 2019a).
effort to take a more proactive approach to climate change and foster low- carbon industries as new engines of the country’s economic growth (NLIC, 2019a).
Introduction of the PCA in 2015 and its effectuation in 2016 transformed the international framework on climate change actions. Under the PCA, reducing GHG emissions was no longer the exclusive lot of developed countries. All nations were urged to set their GHG emissions reduction targets and carry out effective actions to that end voluntarily.
The Korean government responded to this change by announcing an ambitious intended nationally determined contribution (INDC) to the UNFCCC in 2015 that it would reduce business-as-usual (BAU) GHG emissions by 37 percent by 2030. This was followed this up in 2016 with announcement of the National Roadmap on Reducing Greenhouse Gas Emissions 2030. The roadmap, after some revision, was confirmed and adopted in 2018 (Republic of Korea Government, 2016 and 2018). The emissions reduction targets were centrally featured on subsequent energy- related national initiatives, including the Eighth Electricity Demand and Supply Master Plan and the Third Energy Master Plan (MOTIE, 2017 and 2019).
Since setting the emissions reduction target for 2030, the Korean government has been implementing a broad array of measures to promote and support this reduction. The Korean ETS, in particular, is one of the most important means to achieving the 2030 reduction target, as the target businesses together emit nearly 70 percent of all nationwide GHG emissions.
Phase 1 of the Korean ETS began in 2015 and came to a close in 2017. The second phase has been in effect since 2018. Now that the first phase is over, we are able to assess and analyze how the ETS fared during that period of time, in terms of the outcomes of trading, the effect on GHG emissions, and the effect on the target businesses, with a view to finding implications for improving the ETS in the future. This study statistically analyzes the emissions-reducing performance of the Korean ETS, and assesses how efficiently it was run and what effects it exerted on the competitiveness of Korean businesses during its first phase. This study reviews the findings of this analysis and identifies policy implications for more efficient management of the Korean ETS in the future.
2. Subject of Analysis
The performance of an ETS can be assessed using a variety of metrics, including its effect on reducing GHG emissions, its cost-effectiveness, its effect on encouraging investment in emissions-reducing technology, and its effect on the competitiveness of subject businesses. This study analyzes the performance of the Korean ETS during its first phase in terms of the effect on reducing GHG emissions (Box (A) of Figure 1-1), its efficiency as a precondition for cost-effectiveness (Box (B)), and the effect on the competitiveness of the target businesses (Box (C)).
Figure 1- 1. Subject of Analysis: Conceptual Map
(A)온실가스 감 감 (A) GHG reduction
감 감 감 감 감 감 감 감 Cost of reduction
감 감 감 감 감 감 감 감 Direct cost of reduction activities 감 감 감 감 감 감 감 감 감 감 Opportunity cost of production
forgone (B)감 감 감 감 감 감 감-감 감 감
감 감 감 감
(B) ETS – Market price of emission permits
감 감 감 감 감 Cost-effectiveness
Activities to reduce GHGs inevitably extract costs. These activities include installing and operating emissions-reducing devices, switching from high- emission to low-carbon fuels, optimizing the production process to minimize energy demand, and so forth. These activities, whether they directly or indirectly reduce GHG emissions, involve the expenses of introducing,
replacing, and improving machinery.
Businesses that generate so much in emissions that cannot be reduced by these direct reduction measures may have to readjust their production to reduce emissions to the required extent. The net revenue they lose by scaling down or forgoing production constitute the opportunity cost of GHG reduction.
The inevitable cost of GHG reduction has been a subject of much contention and debate because of its substantial impact on industry and the national economy. In meeting reduction quotas, it is therefore critical to minimize the cost of GHG reduction so as to minimize adverse impact on the national economy and industrial competitiveness.
The ETS is widely understood as one of the best ways to reduce GHGs at a minimal cost. To reduce GHG emissions in a cost-effective way, which is the aim of the ETS, it is important to provide the target businesses with an efficient and perfectly free emissions trading market. In order to reduce emissions in a given nation or system to a specific extent at minimum cost, the amount by which each business is to reduce its emissions should be decided so that the marginal cost of emissions reduction is equal between businesses. On an efficient and perfectly competitive emissions market, all participating actors would decide the amount of emissions they will generate and reduce that amount so that their marginal reduction costs become equal to the market price of emissions. In other words, the nation- or system-wide cost of GHG reduction becomes minimal when the marginal reduction costs of each target business equal the market price of emissions.
With this theory in the background, this study sets out to analyze the first phase of the Korean ETS with respect to: the effect on reducing GHG emissions, the principal aim of the ETS; efficiency of the emissions trading market as a measure of cost-effectiveness; and the competitiveness of subject companies as a measure of the cost of reducing GHGs (Figure 1-1).
3. Research Structure and Questions
Figure 1-2 sums up the subject of this analysis and the main questions around which it is structured.
Figure 1- 2. Research Structure and Questions
Phase 1 of the Korean ETS: Performance Analysis
(A) GHG reduction (B) ETS (C) Reduction cost
Has the ETS created a structural difference in
GHG emissions?
Has emissions trading been efficient?
How has the ETS affected the competitiveness of target
businesses?
Implications for a more efficient ETS
According to the Master Plan for Emission Permits (2014), the foremost objective of the first phase of the ETS was to help participants experience emissions trading and solidify the ETS as an institution (MOSF, 2014). During this period, target businesses together emitted 98.76 percent of the total emissions allowance for the first phase, which was 1.6889 billion tCO2eq.
Emissions trading thus appears to not only have achieved the stated objective of the first phase, but to also have played a significant role in inhibiting increases in GHG emissions. Nevertheless, we should not fixate on a simple
comparison of the total emissions allowance and the certified emissions (emission permits submitted). First, there are numerous factors that may have hindered participating companies from generating less in emissions than the allowance. Second, the drop in emissions may have more to do with decreases in production rather than the ETS. There is, of course, the possibility that participating businesses were able to reduce their GHG emissions or slow down the rate of increase in their emissions through conscious and sustained effort.
We need to examine data on the amount of GHGs emitted by individual businesses and control production-related variables in order to determine whether the ETS has indeed made a statistically significant difference. In Chapter II, we shall therefore examine the correlation between the GHG emissions of target businesses on the one hand, and their energy demand or business record, on the other, and verify whether the difference in total emissions indeed is due to the ETS.
The ETS is also preferred to other, direct forms of regulation because it enables society to meet its emissions reduction target in a cost-effective manner. In order for an ETS to facilitate this cost-effectiveness, the emissions and reduction quotas of individual businesses should be decided in a way that their marginal reduction costs all become equal. Under an ETS, the marginal reduction costs of all participating businesses become equal based on the market price of emissions, insofar as the scheme is backed by an efficient emissions trading market.
It is beyond the scope of this study to assess whether the marginal cost reduction has been set for every single target business and satisfied the requirement of cost-effectiveness. Instead, this study analyzes whether the emissions trading market in Korea was efficient during the first phase of the ETS, and whether the precondition for cost-effectiveness of the ETS was thus achieved. Chapter III introduces statistical tests to that end and discusses their results.
The numerous discussions held in the lead-up to introduction of the ETS focused mainly on the policy’s potential effect on the economy. Under the ETS, target businesses can generate GHG emissions corresponding to their emission permits. Target businesses should therefore either strive to reduce their emissions internally or trade emission permits on the emissions trading market. Because costs will be incurred either way, the ETS has been expected
to exert at least some effect on the financial performance of the target businesses. The ideal method to verify whether such effects have been exerted would involve estimating or calculating the direct costs of emissions reduction that each business and/or industry has had to bear and thereby analyze how the ETS has affected the competitiveness of these businesses and industries. It is impossible, however, to estimate the direct cost of reduction in a reliable manner on the basis of presently available data. Chapter IV therefore traces and estimates the effect of the ETS on participating business competitiveness in inference from the indicators of business financial performance.
The last chapter of this study renders a comprehensive summary of the findings and conclusions of the preceding chapters, and delineates policy implications for the future and more efficient management of the ETS in Korea.
Chapter II. Performance of GHG Emissions Reduction
1. Introduction
1.1 Research Purpose and Background
Technological progress and economic growth have radically increased demand for energy, compelling humankind to resort to fossil fuels for the most part to satisfy that demand. Fossil fuels have indeed broadened the horizon of human activity to an unprecedented extent, but also generated immense societal costs in the form of acid rain due to the nitrogen and sulfur oxides they produce as byproducts, and climate change due to carbon dioxide and global warming.
The burning of fossil fuels, widely blamed for today’s climate crisis, is not the only source of greenhouse gases (GHGs). Technological progress has enabled humankind to invent and apply a wide variety of manmade substances that did not exist in nature. Of these, perfluorocarbons (PFCs), hydrofluorocarbons (HFCs), and sulfur hexafluorides (SF6) have played far greater roles in accelerating global warming than carbon dioxide.
Acid rain, climate change, and GHG emissions from industrial facilities are all negative externalities of fossil fuel demand that the market has failed to correct. Governments can resort to a variety of measures to control and regulate behavior or substances that cause negative externalities. Examples include setting limiting standards on the chemical compounds that may be produced as byproducts of burning fossil fuels, and requiring manufacturers to install devices that reduce nitrogen and sulfur oxide emissions. The US government introduced an emissions trading scheme (ETS) primarily to reduce the amount of sulfur dioxide emitted into the atmosphere and thereby reduce acid rain.
Economists have been leading proponents of financial and economic incentives to change economic actor behavior and thereby resolve negative externalities. The ETS and emission charges are examples of such incentives. Between these two, the Korean government opted for the former as they afford a chance to regulate total emissions more directly, while the latter could potentially be perceived as a new tax the public would likely resist.
Upon promulgating the Framework Act on Low-Carbon, Green Growth in 2010, the Korean government revealed to the public that it could very well introduce an ETS to limit the total quantity of GHG emissions being generated.3 Enactment of the Act on the Allocation and Trading of Greenhouse Gas Emission Permits (AATGGEP) and its Enforcement Decree ensued in May 2012, paving the way for launching the ETS. Pursuant to the Enforcement Decree to the AATGGEP, the Korean government established a Master Plan for the Emission Trading Scheme (MPETS) in January 2014, and the National Emission Permit Allocation Plan for the First Phase (2015 to 2017) of the ETS in September the same year (MOSF, 2014; ME, 2014). The first phase of the Korean ETS thus began in 2015, targeting 525 businesses.
According to the MPETS of 2014, the foremost objective of the scheme’s first phase was to enable participating businesses to experience emissions trading and solidify the scheme as a new institution (MOSF, 2014). Of the 1.6899 billion tCO2eq permitted as the total emissions allowance during the first phase, 1.6863 billion tCO2eq were emitted through allocation and an additional 4.9 million tCO2eq through public bidding on emission permits as part of efforts to stabilize the emissions trading market.
Target businesses also managed to reduce emissions by 15.4 million tCO2eq through external projects,
3 Paragraph (1), Article 46 (Introduction of Cap and Trade System): “The Government may operate a system for trading emissions of greenhouse gases by utilizing market functions in order to accomplish the State’s target of reducing greenhouse gases” (NLIC, 2019a).
which they converted into additional emission permits. In the first phase of the ETS, emission permits totaling 1.7066 billion tCO2eq were circulated on the market. Of these, 1.6689 billion tCO2eq were submitted as certified emissions, while 37.7 million tCO2eq were carried forward into the next phase.
The amount of emissions for which businesses failed to produce permits during the first phase amounted to a mere 34,000 tCO2eq.
During the first phase, target businesses together generated only 98.76 percent of the 1.6899 billion tCO2eq permitted as the total emissions allowance. The first phase of the ETS therefore appears to have achieved more than the objective stated in the MPETS and indeed contributed to reducing GHG emissions in Korea.
A simple comparison of the total emissions allowance and the certified amount of emissions generated, of course, does not give us the whole picture of how the ETS has affected GHG emissions in Korea. There can be a variety of factors accounting for this outcome. First, the total emissions allowance may have been more than what the target businesses were capable of generating any way.
Second, the drop in GHG emissions may be attributable more to the decrease in production than to the ETS itself. Finally, it is also possible that GHG emissions, or the rate at which they grew, took a drop thanks to the conscious and sustained efforts of the target businesses.
In this chapter, we shall examine whether the ETS indeed made a statistically significant difference to target business GHG emissions when production-related variables at those businesses, identified on the basis of their emissions data, are controlled.
1.2. Analytical Approach and Composition of the Chapter
The performance of an ETS can be assessed according to a variety of metrics. Existing literature on the EU ETS, for example, measures ETS performance as the difference between the counterfactual BAU emissions that would have been generated in the absence of the scheme and actual BAU emissions.
There are numerous other indirect indicators with which we can evaluate the emissions-reducing performance of an ETS, such as the amount of emissions generated, the rate of increase, the amount of emissions per unit of energy, the amount of emissions per unit of output, and the like. These indicators are used to confirm whether introducing an ETS has made a structural difference to emissions, and, if it did, whether it has consistently served to reduce emissions.
Given the limits to the available data and the Korean ETS practice that also includes indirect emissions, this study takes the latter approach. The correlation between amount of emissions and business activity indicators (energy demand and revenue) was examined, and whether the ETS made structural differences to both the amount of emissions and the business activity indicators analyzed to arrive at an indirect assessment of Korean ETS performance.
Whereas much of the existing literature focuses on measuring and evaluating how the ETS has reduced overall emissions, this study looks into how the ETS differed in effect on emissions for each industry. In setting up an equation on the correlation between emissions and business activity, this study considers the differences in production and emission processes across industries. This means setting up multiple equations to account for the different characteristics between industries. A single equation based on the averages of different industries would be ill-suited to reflecting their differences.
This chapter is structured as follows. Section 2 discusses the allocation of emission permits across the transition and major manufacturing industries during the first phase of the ETS, and the amount of certified emissions they generate. Section 3 applies panel data on individual businesses to estimation of
the correlation between GHG emissions and the main indicators of business activity, and verifies whether being subjected to the ETS made a statistically significant difference to that correlation. This study concludes with a summary of the findings of the statistical analysis and identification of policy implications for future management of the ETS.
2. Allocation of Emission Permits and Trend in Amounts of Certified Emissions
Businesses subject to the ETS were initially divided into five sectors and 26 industries and were allocated emission permits reflecting the emission projections for their respective industries. The changes to the emission permit allocation plan in 2017 involved refining industrial classification, with some industries changing sectors. For ease of analysis, this study focuses on the transition and industrial sectors. Of the latter, the focus is on manufacturing and does not include mining and communications.
Industrial clusters, which are also part of the industrial sector, were reassigned to the transition sector as their energy use bears greater similarity to others in that sector, such as power generation and collective energy. In this section, we shall compare the final emissions allowances and the certified emissions by industry to examine the pressure each industry faced toward reducing emissions during the first phase of the Korean ETS. Next, we shall evaluate the trend in certified emissions by industry.
Table 2- 1. Original and Revised Lists of ETS-Targeted Sectors and Industries
Original Revised
Sector Industry Sector Industry
Transition Power generation, energy Transition Power generation energy
Collective energy
Industrial
n/a
Industrial
Industrial clusters
Mining Mining
Food and beverage (F&B) F&B
Textile Textile
Wood Wood
Paper Paper
Oil refining Oil refining
Petrochemical Petrochemical
Glass and ceramics Glass
Ceramics
Cement Cement
Steel Steel
Non-iron metal Non-iron metal
Machinery Machinery
Semiconductor Semiconductor
Display Display
Electronics Electronics
Automobile Automobile
Shipbuilding Shipbuilding
Construction Communications Communications
Construction Construction Construction
Public/waste Water and wastewater
Public/waste Water and wastewater
Waste Waste
Transportation Aviation Transportation Aviation
Source: Government of the Republic of Korea (2017).
2.1. Transition Sector
Table 2-2 shows the final emissions allowance and certified emissions of the transition sector during the first phase. The transition sector produced more certified emissions than the final allowance throughout the first phase, generating 777.1 million tCO2eq in total emissions, three percent more than the final allowance. This is because the power generation energy industry, which accounts for the bulk of business activity in the sector, generated more emissions than the allowance. It produced 714.9 million tCO2eq in emissions in the first phase, 3.8 percent greater than the final allowance. The collective energy industry, by contrast, managed to keep its emissions at 23.3 million tCO2eq, 18.8 percent short of the final allowance. Industrial clusters, too, exceeded the final allowance by 4.9 percent, producing 38.9 million tCO2eq in certified emissions (Table 2-2).
Table 2- 2. Final Emissions Allowances and Certified Emissions: Transition Sector
(Unit: Million tCO2eq)
Year
Power generation energy Collective energy Industrial clusters Sector-wide Final
allowance
Certified emissions
Final allowance
Certified emissions
Final allowance
Certified emissions
Final allowance
Certified emissions
2015 229.3 231.2 7.1 6.0 10.9 11.9 247.3 249.1
2016 226.0 237.4 8.9 7.6 10.7 12.7 245.6 257.8
2017 233.3 246.2 12.7 9.6 15.5 14.3 261.5 270.2
Total 688.6 714.9 28.7 23.3 37.1 38.9 754.4 777.1
Note: Industrial clusters were reassigned to the transition sector from the industrial sector for this analysis.
Sources: GIR (2019), pp. 37-39 and ETRS (2019), compiled and edited by the author.
The excess in certified emissions likely exerted pressure on target businesses, particularly those in the power generation energy industry, to lower their emissions. Businesses in this industry thus solved the problem by purchasing additional emission permits on the emissions trading market and also converting their external reductions into Korean Credit Units (KCUs) (Table 2-3).
During the first phase, the power generation industry needed permits for an additional 26.3 million tCO2eq. The industry thus purchased Korean Allowance Units (KAUs) for 46.3 million tCO2eq and converted their reduction records into KCUs as well as purchasing KCUs. The industry ended up selling its surplus KAUs worth 9.2 million tCO2eq to other industries. Overall, the industry bought itself room for 10.9 million tCO2eq, slightly less than the combined amount of its KCU conversions and purchases, by the end of the first phase, which was then carried forward to the first year (2018) of the second phase (Table 2-3). The power generation energy industry accounted for significant amounts of both emission permit inflows in the form of KAU purchases and KCU conversions and also emission permit outflows by way of KAU sales and carryforwards. These transactions suggest that some businesses in the industry