저작자표시-비영리-변경금지 2.0 대한민국 이용자는 아래의 조건을 따르는 경우에 한하여 자유롭게
l 이 저작물을 복제, 배포, 전송, 전시, 공연 및 방송할 수 있습니다. 다음과 같은 조건을 따라야 합니다:
l 귀하는, 이 저작물의 재이용이나 배포의 경우, 이 저작물에 적용된 이용허락조건 을 명확하게 나타내어야 합니다.
l 저작권자로부터 별도의 허가를 받으면 이러한 조건들은 적용되지 않습니다.
저작권법에 따른 이용자의 권리는 위의 내용에 의하여 영향을 받지 않습니다. 이것은 이용허락규약(Legal Code)을 이해하기 쉽게 요약한 것입니다.
Disclaimer
저작자표시. 귀하는 원저작자를 표시하여야 합니다.
비영리. 귀하는 이 저작물을 영리 목적으로 이용할 수 없습니다.
변경금지. 귀하는 이 저작물을 개작, 변형 또는 가공할 수 없습니다.
의학박사 학위논문
소변 내 세균 유래 소포체로 분석한
정상인과 만성폐쇄성폐질환의 체내 미생물체의 차이
The difference of bodily microbiota between COPD and healthy population using bacteria-derived extracellular vesicles in urine
울 산 대 학 교 대 학 원 의 학 과
박 신 희
[UCI]I804:48009-200000286984 [UCI]I804:48009-200000286984
소변 내 세균 유래 소포체로 분석한
정상인과 만성폐쇄성폐질환의 체내 미생물체의 차이
지 도 교 수 오 연 목
이 논문을 의학박사 학위 논문으로 제출함
2020 년 1 월
울 산 대 학 교 대 학 원 의 학 과
박 신 희
박신희의 의학박사 학위 논문을 인준함
심사위원 심태선 ( 인 ) 심사위원 오연목 ( 인 ) 심사위원 이세원 ( 인 ) 심사위원 이재승 ( 인 ) 심사위원 이보영 ( 인 )
울 산 대 학 교 대 학 원
2020 년 1 월
요약
배경: 미생물체(microbiome)는 면역체계의 발달과 염증 반응 등을 조절하며, 만성 염증성 질환의 발생에 기여하는 것으로 알려져 있다. 선행 연구들에서 특정한 세 균의 소포체를 주입했을 때 염증반응의 증가 및 폐기종의 발생이 관찰되었고, 만 성 폐쇄성 폐질환이 있는 환자에서 정상인에 비해 폐의 미생물체 구성이 다르다 는 점이 알려져 있다. 그러나, 만성 폐쇄성 폐질환(COPD) 환자에서 체내 미생물 체의 구성에 대한 정보는 잘 알려져 있지 않다.
연구방법: 본 연구는 후향적 코호트 연구로, 한국인 유전체역학조사 사업(Korean Genome Epidemiology Study, KoGES)의 일환으로 구축된 지역사회 기반 코호트 자 료를 이용하였다. 소변 내에 분비되는 소포체(extracellular vesicles)의 메타유전체분 석을 통해 만성 폐쇄성 폐질환이 있는 환자에서 정상인에 비해 더 많이 나타나 는 균이 있는지를 비교해보았다.
결과:2001년부터 모집된 환자 중 14년간 추적한 3484명을 분석하였고, COPD의
유병률은 3.0%로 관찰되었다. 14 년의 추적 기간 동안 COPD 는 144 명(5.0%)에서
발생하였다. COPD 군은 정상군에 비해 나이가 많고, 남성이 많았으며, 흡연자 및 과거 흡연자의 비율도 높았다. COPD 군에서 미생물의 다양성이 정상군에 비해 감소되었고, COPD군의 미생물체 조성은 정상군과 달랐다. 성향점수 매칭된 동수 의 정상군과 비교했을 때에도 COPD 군에서 39 개의 균(taxon)이 정상군보다 자주 관찰되었다. Actinobacteria 문(phylum)이 가장 빈번하게 관찰되었으며, 그 다음으로 Firmicutes, Bacteroidetes 순이었다. 23 개의 종이 더 자주 발견되었고, Cellulomnas, Rothia, Lactobacillus 종과 family Enterobactericeae 가 포함되었다. 상대존재비 분석
에서 COPD 군에서 정상군에 비해 Firmicutes 문이 더 많았고,
Firmicutes/Bacteroidetes 비가 낮았다.
결론: 정상인의 미생물체 구성은 COPD 가 있는 사람과 다르고, 특정문의 균들이 더 자주 관찰되었다. 신체의 미생물체 구성의 차이가 만성폐쇄성폐질환의 이환에 영향을 줄 가능성이 있다.
차 례
국문요약··· i
도표목차··· ii
영문요약··· iii
서론··· 1
연구방법··· 3
결과··· 8
고찰··· 11
결론··· 15
참고문헌··· 16
도표목차
표1··· 20
표 2··· 21
표 3··· 22
표 4··· 23
표 5··· 27
표 6··· 29
그림 1··· 30
그림 2··· 32
그림 3··· 33
그림 4··· 35
Abstract
BACKGROUND: The microbiome has an important role in maintaining health and
regulating the various inflammatory responses. Bacteria excrete extracellular membrane
vesicles (EVs) which can promote airway inflammation and induce emphysema. Lung
microbiota of healthy subjects is different from that of chronic obstructive lung disease
(COPD). However, is not well understood whether the composition of bodily microbiota in
COPD has distinct characteristics compared to a healthy population.
OBJECTIVE: To evaluate the difference in microbiome composition between the patients
with COPD and healthy population.
DESIGN: A retrospective cohort study.
RESULTS: We included 3,484 patients with a 14-year follow up period since 2001 from
pre-existing population-based cohort built in Ansan. COPD prevalence was 3.0%. During
follow up, COPD occurred in 5.0% of the participants. COPD patients were older and had
lower BMI. They had a higher proportion of males and smokers and worse pulmonary
function compared to the normal group. In COPD patients, the diversity of the microbial
community was decreased. The microbial composition of COPD patients was different from
that of the healthy population. Compared with propensity score-matched cohort, 39 taxa
were more frequently detected in COPD. Actinobacteria was the most abundant phylum,
followed by Firmicutes and Bacteroidetes. We observed an increased portion of the
Bacteroidetes phylum among identified genera. Twenty-three genera were more frequently
found in COPD including genus Cellulomonas, Rothia, Lactobacillus, and family
Enterobactericeae. The relative abundance of phylum Firmicutes was increased and
Firmicutes/Bacteroidetes ratio was decreased in COPD.
CONCLUSIONS: The microbial composition of COPD was different from those of healthy population. The difference in bodily microbiota composition may affect morbidity of COPD.
Introduction
Chronic obstructive pulmonary disease (COPD) is the third leading cause of death among
non-communicable diseases (1). COPD is characterized by an airflow limitation that is not
fully reversible and caused by an abnormal inflammatory response of the airways to noxious
inhaled gases and particles. The best example of this noxious insult is smoking, however, a
only fraction (9~31%) of smokers develop COPD (2). Moreover, airway inflammatory
response is not fully recovered in COPD patients who no longer smoke (3). These findings
suggest that there is more to it than noxious stimuli such as smoking to cause COPD. Recent
evidence indicate that disrupted innate and adaptive immune response contributes to the
pathogenesis of COPD, but the causative factors are remained poorly understood (4).
The human microbiome is one of the factors, which has an important role in maintaining
health and regulating various inflammatory responses (5). The human microbiome can be
described as the sum of all forms of microorganisms and their genomes, residing in an
individual, at a given time (6). Microbiota moderates the dynamic process of development
and regulation of the immune system that lies beneath the pathogenesis of COPD (7).
Bacteria excrete extracellular membrane vesicles (EVs), also called outer membrane vesicles
(OMVs), to communicate with other cells. EVs are nano-sized particles, 20–200 nm in
diameter, excreted by Archaea, bacteria to eukaryotic cells and they contain various bioactive
molecules which play an important role in intercellular communication (8).
Previous studies showed that bacteria-derived EVs can promote airway inflammation and
induce emphysema in animal models (9, 10). Evidence suggests that EVs circulate
systemically and secreted to urine. Jang and colleagues demonstrated in mice experiment
that intraperitoneally injected EVs were rapidly distributed throughout the body with
accumulation in the liver, lung, spleen, and kidney (11). We hypothesized that urinary
derived EVs would reflect bodily microbiome of a host since EVs can be detected in various
bodily fluids and is very stable (12).
We conducted a retrospective cohort study to investigate the microbiome that is
distinctively found in COPD which may have a role in the pathogenesis of the disease. We
identified microbiota from extracted the bacteria-derived EVs in urine samples of COPD and
healthy subjects and compared the frequency of each microbiota between COPD and healthy
subjects.
Methods
We conducted a retrospective cohort study to evaluate the difference in urine microbiome
composition between the patients with COPD and healthy population.
Study population and design
The study cohort is included in an ongoing nationwide cohort study, The Korean Health and
Genome Study (KoGES), which started in 2001 (13). The aim of the KoGES is to discover
the genetic and environmental etiology of common chronic diseases in Koreans and to
reduce the burden of chronic diseases. As part of this project, a population-based cohort was
built in Ansan, an industrialized city with a population of 710,000. The baseline study was
conducted from June 25, 2001, to January 29, 2003. Participants of the study cohort
consisted of 5,015 male and female Korean aged 40 to 69 years, and they had a
comprehensive health examination including routine anthropometric measurements, blood
and urine samples, and pre- and post-bronchodilator spirometry and on-site interviews at
Korea University Ansan Hospital at enrollment (14). The participants have been followed up
biennially with structured questionnaires and tests including spirometry.
We retrieved data from 3,879 participants with a 14-year follow-up period, including
baseline age, sex, body-mass index (BMI), smoking history, comorbidities, dietary patterns
and pulmonary function tests at baseline and each follow-up visits. We used a baseline urine
sample to identify urinary EVs excreted by the various microbiome. We excluded 11 subjects
with missing anthropometric data, 269 subjects with confirmed asthma or wheezing, and 13
patients with urinary tract infection. A total of 3,484 participants was eligible for analysis.
During a 14-year follow-up period, a part of the healthy population developed COPD. We
excluded those who developed COPD during the follow-up period from healthy control
group.
We compared baseline characteristics, microbiome composition and difference of COPD
patients with the healthy population.
Spirometry and diagnosis of COPD
Spirometry was conducted by a specially trained pulmonary technician abide by the 1994
ATS recommendations, using a spirometer (Vmax-229, Sensor-Medics, Yorba Linda, CA,
USA) for all subjects (15). The predicted forced expiratory volume in one second (FEV1)
and forced vital capacity (FVC) were obtained using the method of Morris; the patients try
forced expiratory maneuvers until three measurements met the ATS guideline specifications
(16). Two doses of fenoterol hydrobromide (Berotec®, Boehringer Ingelheim, Ingelheim,
Germany) 200 μg were administered 1–2 min apart. The forced expirations were repeated
15 min after the administration of the bronchodilator.
COPD was defined as a post-bronchodilator FEV1/FVC < 0.7 according to the GOLD
criteria (17). COPD prevalent cases were defined as subjects who had COPD at enrollment.
COPD incident cases were defined as participants who developed COPD during follow-up
visits which were excluded from the healthy population in statistical analysis.
Dietary Assessment
Dietary information was obtained using a semi-quantitative food frequency questionnaire
(FFQ), which was developed and evaluated for validity by the Korea Centers for Disease
Control and Prevention (Seoul, Korea) (18). For analysis deriving dietary patterns, the 103
food items from the FFQ were classified into 27 food groups similarly used in a previous
study (19), which investigated dietary patterns among Koreans. The average frequency of
consumption for a specific food group was calculated by adding up frequencies for all of the
food items that belong to the food group. Food groups were used for factor analysis to
generate major dietary patterns and factor loadings. Based on the factor loading scores
(greater than 0.6), Factor 1 was characterized by high intake of noodles and flour products;
factors 2 by high intake of milk and dairy products; factor 3 by high intake of red meats and
chickens; factor 4 by high intake of grains; and factor 5 by high intake of vegetables.
Preparation of EVs and DNA extraction from urine samples
The differential centrifugal method was used for the isolation of bacteria-derived EVs
from the urine samples as previously described (20). In brief, urine samples were centrifuged
at 10,000 × g for 10 min at 4 ℃. The supernatant was filtered through a 0.22-μm membrane.
Isolated EVs were dissolved in 100 μl PBS based on the protein amount. The DNA
extraction process was described previously (21, 22). Briefly, isolated EVs were boiled at
100℃ for 15 min, centrifuged at 10,000 g for 20 min, and the supernatants were collected.
For collected samples, a DNA extraction kit (PowerSoil DNA Isolation Kit, MO BIO,
Carlsbad, CA, USA) was used to extract bacterial DNA. Isolated DNA was quantified by
using the QIAxpert system (QIAGEN, Hilden, Germany).
16S rRNA gene-based metagenomic sequencing and assignment of taxonomic unit
The method for bacterial DNA preparation is described previously (22). DNA was used
for PCR amplification of the V3-V4 hypervariable regions in the 16S ribosomal RNA genes
using the primer set of 16S_V3_F (5ʹ-TCGTCGGCAGCGTCAGATGTGTATAAGAGACA
GCCTACGGGNGGCWGCAG-3ʹ) and 16S_V4_R (5ʹ-GTCTCGTGGGCTCGGAGATGTG
TATAAGAGACAGGACTACHVGGGTATCTAATCC-3ʹ). 16S rDNA gene libraries were
constructed using the PCR products that were used for the construction of following the
MiSeq System guidelines (Illumina Inc., San Diego, CA, USA). The 16S rRNA gene
libraries for each sample were measured using QIAxpert (QIAGEN, Hilden, Germany) and
the equimolar amount was used for pyrosequencing with the MiSeq System (Illumina Inc.,
San Diego, CA, USA) following manufacturer’s recommendations.
Raw pyrosequencing reads were filtered on the basis of the primer sequences using MiSeq
Control Software version 1.1.1 (Illumina Inc., San Diego, CA, USA). The taxonomical
assignment of the sequence reads was done using the MDx-Pro ver.1 profiling program (MD
Healthcare Inc., Seoul, Korea). Operational taxonomic units (OTUs) were identified using
UCLUST (23) and assigned using QIIME (24) against the 16S rRNA sequence database, the
GreenGenes 8.15.13 (25). Taxonomic assignments were achieved based on the sequence
similarities at the following levels: genus, >94% similarity; family, >90% similarity; order,
>85% similarity; class, >80% similarity; and phylum, >75% similarity. In cases where
clustering was not possible at the genus level due to a lack of sequence information at the
database or redundant sequences, the taxon was named based on the higher-level taxonomy
with brackets.
Statistical analyses
Statistical analyses for baseline characteristics were performed by SPSS statistics version
21. Analysis of categorical variables was done using the chi-square test and Fisher’s exact
test and continuous variables were analyzed by independent t-test and Mann-Whitney U test.
A p-value of < 0.05 was considered statistically significant.
Major dietary patterns were generated from food groups with the Varimax rotation method.
After evaluation of eigenvalues (greater than 1.0) and the Scree test, five factors, which were
labeled based on the nature of food groups loading highly on a factor, were determined and
factor scores for each factor were calculated for each individual.
The alpha diversity of samples was estimated using the Shannon index and Simpson index
(26). The beta-diversity of the samples was analyzed using distance matrices generated using
the Jaccard index for community membership (27). Principal component analysis (PCA) was
used to visualize the similarities between groups. Multiple logistic regression analysis was
used to analyze the difference in microbiome between COPD patients and healthy population.
Microbiome with detection rate under 2 % were excluded for analysis.
Results
A total of 3,484 subjects were eligible for analysis and 105 (3.0 %) participants had COPD
at the time of enrollment. Among whose spirometry at enrollment was normal, 144 (4.2 %)
persons developed COPD after a 14-year follow-up period.
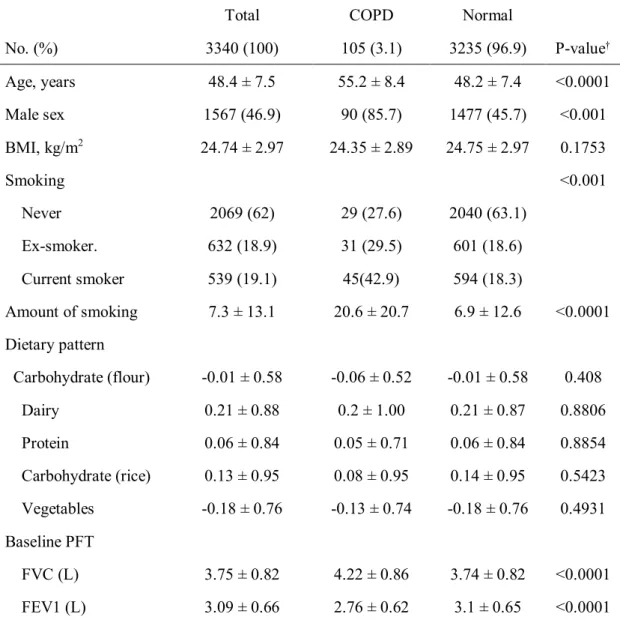
Baseline characteristics of COPD and healthy subjects
We compared baseline characteristics of subjects who had COPD at enrollment and subjects
who stayed normal throughout the follow-up period, excluding COPD incident cases (Table
1). The patients with COPD was older and male predominant than the normal subjects.
They had more current and ex-smokers than the normal population. Dietary patterns and
BMI were not significantly different between the two groups. FVC was higher in COPD
patients than the normal population, but FEV1, FEV1/FVC was lower in COPD patients than
the normal population.
COPD occurred in 144 patients during follow-up. The overall incidence of COPD among
the study population was 5.0 %. We compared baseline characteristics of COPD incident
cases and healthy subjects (Table 2). The patients who developed COPD were older and
77.1 % of them were male. They had lower BMI and had more current and ex-smokers than
healthy subjects. Dietary patterns were not significantly different between the two groups.
Spirometry results at the time of enrollment were compared between COPD incident cases
and healthy subjects. FVC, percent achieved of the predicted value of FEV1, and FEV1/FVC
were lower in COPD incident cases than healthy subjects, even they did not have COPD at
enrollment.
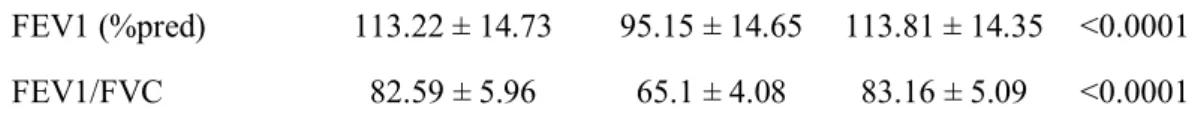
We selected 105 healthy subjects using propensity score matching. Table 3 shows a
comparison of the baseline characteristics of the COPD and propensity score-matched
healthy subjects.
Biodiversity and cluster analysis of samples
The alpha diversity measured using Shannon index and Simpson index did not show
statistical difference among healthy subjects, COPD prevalent and incident cases (Figure 1,
A and C). However, alpha diversity indices were significantly lower in propensity score
match healthy subjects than COPD prevalent cases, indicating less diverse bacterial
community in COPD prevalent cases (Figure 1, B and D).
The Jaccard index of healthy subjects, COPD prevalent and incident cases were not
significantly different (Figure 2, A). COPD prevalent cases showed significantly lower
Jaccard index than propensity score-matched population, meaning more dissimilar
composition of bacterial community from that of the normal population.
The result of PCA is shown in Figure 3. PCA did not reveal distinct clusters of bacterial
communities in COPD patients.
Comparison of microbiome between COPD and healthy subjects
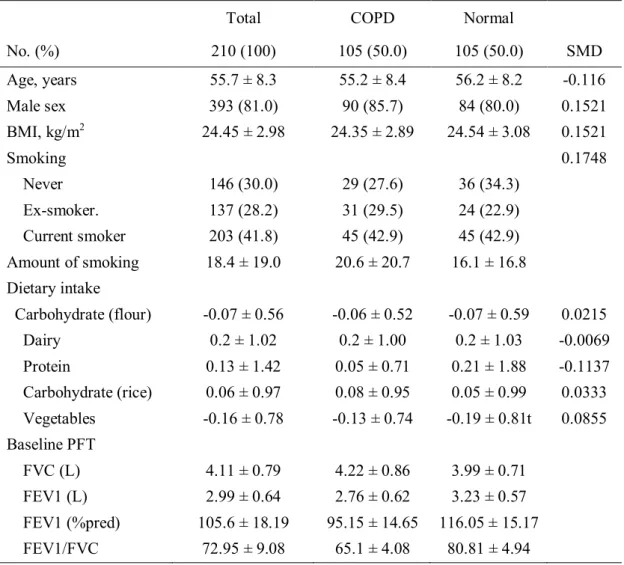
We found 129 taxa that are more frequently detected in COPD prevalent cases than healthy
population which is shown in Table 4. A total of 73 Genera were more frequently found in
COPD than in healthy subjects. When classified into the phylum they belong, Proteobacteria
was the most abundant phylum followed by Actinobacteria, Firmicutes, and Bacteroidetes.
They showed an extreme odds ratio and the taxa identified were microbiomes that are
commonly found in environment.
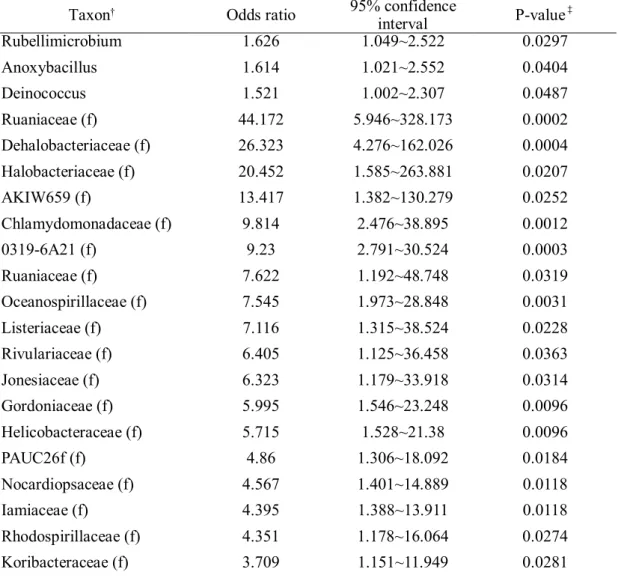
We found 35 taxa that are more frequently detected in COPD patients than in propensity
score-matched healthy population. There were 23 genera that more frequently found in
COPD patients than healthy subjects, including genus Cellulomonas, Rothia, Lactobacillus,
and family Enterobactericeae.
Figure 4 shows more frequently detected taxa in COPD patients compared to healthy
subjects which were classified by the phylum they belong to. There were 5 major identified
phyla; Proteobacteria, Actinobacteria, Firmicutes, Bacteroidetes, and Acidobacteria.
Compared with the propensity score-matched cohort, the phylum Actinobacteria was the
most abundant phylum in COPD followed by Firmicutes and Bacteroidetes.
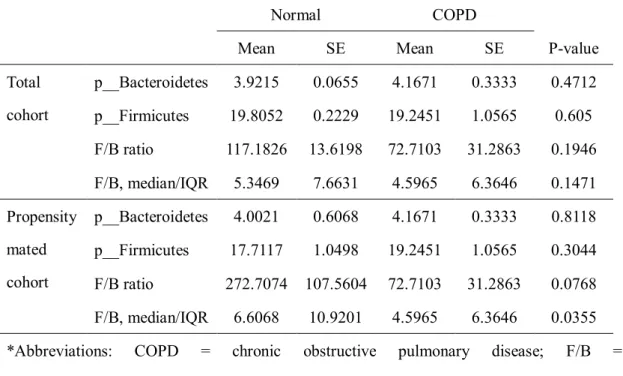
The result of relative abundance analysis of phylum Firmicutes and Bacteroidetes are
shown in Table 6. We found that the relative abundance of phylum Firmicutes was increased
and Firmicutes/Bacteroidetes ratio was decreased in COPD patients compared to propensity
score-matched healthy cohort.
Discussion
To our knowledge, this is the first study that investigated the difference in microbiome
between COPD and healthy subjects using bacteria-derived EV in the urine. We evaluated
the difference of urine microbiome between COPD patients and healthy subjects. We found
several taxa more commonly detected in COPD than in healthy subjects.
We used urine samples of the subjects based on the hypothesis that bacteria-derived urinary
EVs reflects the total burden of the host microbiome, which are mainly abundant in the
gastrointestinal tract (GIT). Previous studies showed that EVs in indoor dust induce
neutrophilic pulmonary inflammation and COPD patients were 8 times more likely to
sensitized by anti-EV IgG (28, 29). In addition, bacteria-derived EVs can induce lung
inflammation and even emphysema in lung tissue, in a dose-dependent manner (30, 31). This
pro-inflammatory effect of EVs is maintained when delivered into the abdomen. Jang et al.
demonstrated in a mouse model that intraperitoneal injection of bacterial EVs can induce
inflammation in the lungs (11). They also showed a dynamic distribution of EVs in mice,
particularly, a significant portion of injected EVs was found in the kidneys. This suggests
that microbiota at a certain location could affect or be affected by microorganisms or their
immune response located at distant sites. Interactions of microbiota and host that mediated
by EVs may have the potential to shed a light on the insight of immune response and
pathogenesis of chronic airway disease (32). For instance, Samra and colleagues investigated
urinary EVs of children with allergic airway disease and found that they had a distinct
composition (33).
Previous research on lung microbiome assessed the relationship between smoking and the
disease state. Sze et al. showed that there are substantial differences in microbiota between
patients with COPD compared with healthy smokers and never smokers by identifying
bacterial DNA from lung tissue (34). In their analysis, the phylum Firmicutes was
significantly associated with COPD lungs and Lactobacillus was the main genus associated
with the increase in the Firmicutes. Kim et al. showed similar results using EVs extracted
from lung tissue (35). They found that the diversity of the microbial community was
decreased in COPD and healthy smokers and the prevalence of the phylum Firmicutes was
higher in the COPD lung EVs. These results are consistent with our findings. The diversity
of the bacterial community was significantly decreased in COPD when compared to that of
propensity score-matched healthy cohort. We also observed one-third of frequently found
genera in COPD belongs to phylum Firmicutes and genus lactobacillus was 2.437 times
more frequently found in COPD patients than in propensity matched healthy subjects.
Meanwhile, the evidence support that there is a substantial difference in the microbiome of
gut microbiota between healthy smokers and nonsmokers. A longitudinal study conducted by
Beiderman et al. showed the composition and diversity of gut microbiome changed after
smoking cessation (36). Lee et al. observed an increased proportion of phylum Bacteroidetes
with decreased Firmicutes and Proteobacteria in smokers than in never and former smokers
using stool samples (37). Savin and colleagues found that the phyla of Proteobacteria and
Bacteroidetes were increased in smokers, as well as the genera Clostridium, Bacteroides and
Prevotella (38). However, phyla Actinobacteria and Firmicutes, as well as the genera of
Bifidobacteria and Lactococcus, were decreased. It is known that chronic lung disease and
chronic GIT diseases often occur together. One-third of the patients with irritable bowel
syndrome and half of the patients with inflammatory bowel syndrome have pulmonary
inflammation or impaired lung function (39, 40). However, there is no research available so
far that assessed the changes in the gut microbiome in COPD patients compared with healthy
subjects (41). We analyzed the difference in the microbiome composition of COPD and
healthy subjects from bacteria-derived urinary EVs and found similar results. The
Proteobacteria phylum was the most commonly found phylum in COPD patients which is
consistent with previous findings (38). We observed increased relative abundance of the
Firmicutes and decreased Firmicutes/Bacteroidetes ratio in COPD, which is consistent with
the results of the previously mentioned study (37). Using bacteria-derived urinary EVs, our
results are consistent with prior studies that used lung or fecal samples.
There are several merits in this study. This is the first analysis performed using bacteria-
derived urinary EVs comparing COPD patients with a healthy population from a large
community-based cohort with a follow-up period of 14 years. We used urine samples that are
easy to obtain and not invasive thus easily replicable. We analyzed bacteria-derived EVs, not
microbiome itself because EVs may have a more crucial role in the relation between
microbiota and chronic airway disease than microbiome itself since EVs have an important
role in the elimination of competing bacteria and modulation of host immune responses.
Also, we have our data adjusted for dietary patterns which could be a major confounding
factor. We used a standardized questionnaire for dietary information and used for factor
analysis. It is well known that consumption of particular types of food changes in host
bacterial genera (42).
However, our study also has some limitations. Urine samples can be changed by some
conditions such as urinary tract infection so we excluded patients with urinary tract infection.
While we assumed bacteria-derived urinary EVs would reflect on the host microbiome, little
is known about whether urinary EVs could represent the whole microbiome in a host.
Moreover, is possible that the normal flora of urinary tract in COPD patients may differ from
those of healthy subjects. We have only observational data and the metagenomics sequencing
of urine samples was only carried out in the first visit. We assumed the microbiome would be
stable throughout the follow-up period, as the previous study showed microbiome
composition in a host remains stable even for decades (43). A longitudinal follow up of urine
samples would have given more information on the effect of urine microbiome in COPD
patients. Without well-structured longitudinal or interventional studies, the causal
relationship between the host microbiome and lung disease cannot be determined.
Conclusion
The microbial composition of COPD assessed with bacteria-derived urinary EVs was
different from those of the healthy population. The difference in bodily microbiota
composition may affect morbidity of COPD. However, to elucidate the role of microbiota in
many sites of the host on respiratory diseases, further longitudinal studies and improved
interventional experiments will be required.
References
1. DALYs GBD, Collaborators H. Global, regional, and national disability-adjusted life-years (DALYs) for 359 diseases and injuries and healthy life expectancy (HALE) for 195 countries and territories, 1990-2017: a systematic analysis for the Global Burden of Disease Study 2017. Lancet (London, England). 2018;392(10159):1859-922.
2. Løkke A, Lange P, Scharling H, Fabricius P, Vestbo J. Developing COPD: a 25 year follow up study of the general population. Thorax. 2006;61(11):935-9.
3. Rutgers SR, Postma DS, ten Hacken NH, Kauffman HF, van Der Mark TW, Koeter GH, et al. Ongoing airway inflammation in patients with COPD who do not currently smoke.
Thorax. 2000;55(1):12-8.
4. Brusselle GG, Joos GF, Bracke KR. New insights into the immunology of chronic obstructive pulmonary disease. The Lancet. 2011;378(9795):1015-26.
5. Slingerland AE, Schwabkey Z, Wiesnoski DH, Jenq RR. Clinical Evidence for the Microbiome in Inflammatory Diseases. Frontiers in Immunology. 2017;8(400).
6. Cho I, Blaser MJ. The human microbiome: at the interface of health and disease.
Nature reviews Genetics. 2012;13(4):260-70.
7. Shukla SD, Budden KF, Neal R, Hansbro PM. Microbiome effects on immunity, health and disease in the lung. Clinical & translational immunology. 2017;6(3):e133.
8. Deatherage BL, Cookson BTJI, immunity. Membrane vesicle release in bacteria, eukaryotes, and archaea: a conserved yet underappreciated aspect of microbial life.
2012;80(6):1948-57.
9. Park K-S, Lee J, Jang SC, Kim SR, Jang MH, Lötvall J, et al. Pulmonary inflammation induced by bacteria-free outer membrane vesicles from Pseudomonas aeruginosa. American journal of respiratory cell and molecular biology. 2013;49(4):637-45.
10. Kim Y-S, Lee W-H, Choi E-J, Choi J-P, Heo YJ, Gho YS, et al. Extracellular Vesicles Derived from Gram-Negative Bacteria, such as Escherichia coli, Induce Emphysema Mainly via IL-17A–Mediated Neutrophilic Inflammation. The Journal of Immunology. 2015;194(7):3361-8.
11. Jang SC, Kim SR, Yoon YJ, Park KS, Kim JH, Lee J, et al. In vivo kinetic biodistribution of nano sized outer membrane vesicles derived from bacteria. ‐ 2015;11(4):456-61.
12. Yáñez-Mó M, Siljander PR-M, Andreu Z, Bedina Zavec A, Borràs FE, Buzas EI, et al. Biological properties of extracellular vesicles and their physiological functions.
2015;4(1):27066.
13. group tK, Han B-G, Kim Y. Cohort Profile: The Korean Genome and Epidemiology Study (KoGES) Consortium. International Journal of Epidemiology. 2016;46(2):e20-e.
14. Kim S, Suk M, Choi H, Kimm K, Jung K, Lee SY, et al. The local prevalence of COPD by post-bronchodilator GOLD criteria in Korea. The International Journal of Tuberculosis and Lung Disease. 2006;10(12):1393-8.
15. Standardization of Spirometry, 1994 Update. American Thoracic Society. American Journal of Respiratory and Critical Care Medicine. 1995;152(3):1107-36.
16. Morris JF. Spirometry in the evaluation of pulmonary function. The Western journal of medicine. 1976;125(2):110-8.
17. Pauwels RA, Buist AS, Calverley PM, Jenkins CR, Hurd SSJAjor, medicine cc.
Global strategy for the diagnosis, management, and prevention of chronic obstructive pulmonary disease: NHLBI/WHO Global Initiative for Chronic Obstructive Lung Disease (GOLD) Workshop summary. 2001;163(5):1256-76.
18. Ahn Y, Kwon E, Shim J, Park M, Joo Y, Kimm K, et al. Validation and reproducibility of food frequency questionnaire for Korean genome epidemiologic study.
2007;61(12):1435.
19. Kim J, Jo I. Grains, vegetables, and fish dietary pattern is inversely associated with the risk of metabolic syndrome in South korean adults. Journal of the American Dietetic Association. 2011;111(8):1141-9.
20. Lee E-Y, Bang JY, Park GW, Choi D-S, Kang JS, Kim H-J, et al. Global proteomic
profiling of native outer membrane vesicles derived from Escherichia coli. 2007;7(17):3143- 53.
21. Yoo JY, Rho M, You Y-A, Kwon EJ, Kim M-H, Kym S, et al. 16S rRNA gene- based metagenomic analysis reveals differences in bacteria-derived extracellular vesicles in the urine of pregnant and non-pregnant women. Experimental & molecular medicine.
2016;48(2):e208.
22. Lee Y, Park J-Y, Lee E-H, Yang J, Jeong B-R, Kim Y-K, et al. Rapid assessment of microbiota changes in individuals with autism spectrum disorder using bacteria-derived membrane vesicles in urine. 2017;26(5):307-17.
23. Edgar RCJB. Search and clustering orders of magnitude faster than BLAST.
2010;26(19):2460-1.
24. Lozupone C, Hamady M, Knight RJBb. UniFrac–an online tool for comparing microbial community diversity in a phylogenetic context. 2006;7(1):371.
25. Caporaso JG, Kuczynski J, Stombaugh J, Bittinger K, Bushman FD, Costello EK, et al. QIIME allows analysis of high-throughput community sequencing data. 2010;7(5):335.
26. Hill TC, Walsh KA, Harris JA, Moffett BFJFme. Using ecological diversity measures with bacterial communities. 2003;43(1):1-11.
27. Yue JC, Clayton MKJCiS-t, Methods. A similarity measure based on species proportions. 2005;34(11):2123-31.
28. Kim YS, Choi EJ, Lee WH, Choi SJ, Roh TY, Park J, et al. Extracellular vesicles, especially derived from Gram negative bacteria, in indoor dust induce neutrophilic ‐ pulmonary inflammation associated with both Th1 and Th17 cell responses. 2013;43(4):443- 54.
29. Kim Y-S, Choi J-P, Kim M-H, Park H-K, Yang S, Kim Y-S, et al. IgG sensitization to extracellular vesicles in indoor dust is closely associated with the prevalence of non- eosinophilic asthma, COPD, and lung cancer. 2016;8(3):198-205.
30. Park K-S, Lee J, Jang SC, Kim SR, Jang MH, Lötvall J, et al. Pulmonary inflammation induced by bacteria-free outer membrane vesicles from Pseudomonas aeruginosa. 2013;49(4):637-45.
31. Kim Y-S, Lee W-H, Choi E-J, Choi J-P, Heo YJ, Gho YS, et al. Extracellular
Vesicles Derived from Gram-Negative Bacteria, such as Escherichia coli, Induce Emphysema Mainly via IL-17A–Mediated Neutrophilic Inflammation. 2015;194(7):3361-8.
32. Fujita Y, Kadota T, Araya J, Ochiya T, Kuwano K. Extracellular Vesicles: New Players in Lung Immunity. Am J Respir Cell Mol Biol. 2018;58(5):560-5.
33. Samra M, Nam SK, Lim DH, Kim DH, Yang J, Kim YK, et al. Urine Bacteria- Derived Extracellular Vesicles and Allergic Airway Diseases in Children. International archives of allergy and immunology. 2019;178(2):150-8.
34. Sze MA, Dimitriu PA, Hayashi S, Elliott WM, McDonough JE, Gosselink JV, et al.
The lung tissue microbiome in chronic obstructive pulmonary disease. 2012;185(10):1073- 80.
35. Kim HJ, Kim Y-S, Kim K-H, Choi J-P, Kim Y-K, Yun S, et al. The microbiome of the lung and its extracellular vesicles in nonsmokers, healthy smokers and COPD patients.
Experimental & molecular medicine. 2017;49(4):e316.
36. Biedermann L, Zeitz J, Mwinyi J, Sutter-Minder E, Rehman A, Ott SJ, et al.
Smoking cessation induces profound changes in the composition of the intestinal microbiota in humans. 2013;8(3):e59260.
37. Lee SH, Yun Y, Kim SJ, Lee EJ, Chang Y, Ryu S, et al. Association between Cigarette Smoking Status and Composition of Gut Microbiota: Population-Based Cross- Sectional Study. Journal of clinical medicine. 2018;7(9).
38. Savin Z, Kivity S, Yonath H, Yehuda SJAoM. Smoking and the intestinal microbiome. 2018;200(5):677-84.
39. Yazar A, Atis S, Konca K, Pata C, Akbay E, Calikoglu M, et al. Respiratory symptoms and pulmonary functional changes in patients with irritable bowel syndrome. The American journal of gastroenterology. 2001;96(5):1511-6.
40. Keely S, Talley NJ, Hansbro PM. Pulmonary-intestinal cross-talk in mucosal inflammatory disease. Mucosal immunology. 2012;5(1):7-18.
41. Budden KF, Gellatly SL, Wood DL, Cooper MA, Morrison M, Hugenholtz P, et al.
Emerging pathogenic links between microbiota and the gut–lung axis. Nature Reviews Microbiology. 2017;15(1):55.
42. Singh RK, Chang H-W, Yan D, Lee KM, Ucmak D, Wong K, et al. Influence of diet
on the gut microbiome and implications for human health. 2017;15(1):73.
43. Faith JJ, Guruge JL, Charbonneau M, Subramanian S, Seedorf H, Goodman AL, et al. The long-term stability of the human gut microbiota. 2013;341(6141):1237439.
Table 1. Baseline characteristics of the patients with or without COPD.
Total COPD Normal
No. (%) 3340 (100) 105 (3.1) 3235 (96.9) P-value†
Age, years 48.4 ± 7.5 55.2 ± 8.4 48.2 ± 7.4 <0.0001
Male sex 1567 (46.9) 90 (85.7) 1477 (45.7) <0.001
BMI, kg/m2 24.74 ± 2.97 24.35 ± 2.89 24.75 ± 2.97 0.1753
Smoking <0.001
Never 2069 (62) 29 (27.6) 2040 (63.1)
Ex-smoker. 632 (18.9) 31 (29.5) 601 (18.6)
Current smoker 539 (19.1) 45(42.9) 594 (18.3)
Amount of smoking 7.3 ± 13.1 20.6 ± 20.7 6.9 ± 12.6 <0.0001 Dietary pattern
Carbohydrate (flour) -0.01 ± 0.58 -0.06 ± 0.52 -0.01 ± 0.58 0.408
Dairy 0.21 ± 0.88 0.2 ± 1.00 0.21 ± 0.87 0.8806
Protein 0.06 ± 0.84 0.05 ± 0.71 0.06 ± 0.84 0.8854
Carbohydrate (rice) 0.13 ± 0.95 0.08 ± 0.95 0.14 ± 0.95 0.5423 Vegetables -0.18 ± 0.76 -0.13 ± 0.74 -0.18 ± 0.76 0.4931 Baseline PFT
FVC (L) 3.75 ± 0.82 4.22 ± 0.86 3.74 ± 0.82 <0.0001
FEV1 (L) 3.09 ± 0.66 2.76 ± 0.62 3.1 ± 0.65 <0.0001
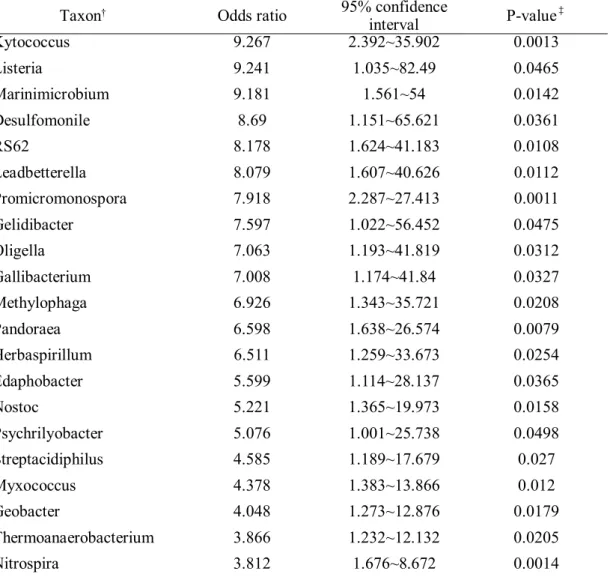
FEV1 (%pred) 113.22 ± 14.73 95.15 ± 14.65 113.81 ± 14.35 <0.0001 FEV1/FVC 82.59 ± 5.96 65.1 ± 4.08 83.16 ± 5.09 <0.0001
†Statistical analysis was done using the independent t-test for age and BMI, the chi square test and Fisher’s exact test for other variables.
*Abbreviations: BMI = body-mass index; COPD = chronic obstructive pulmonary disease;
FEV1 = forced expiratory volume in 1 second; FVC = forced vital capacity; No. = number; %pred = percent achieved of predicted value.
Table 2. Baseline characteristics of the COPD incident cases and the healthy subjects.
†Statistical analysis was done using the independent t-test for age and BMI, the chi-square
Total COPD Normal
No. (%) 2857 (100) 144 (5.0) 2713 (95.0) P-value†
Age, years 48.1 ± 7.2 51.9 ± 7.3 47.9 ± 7.2 <0.0001
Male sex 1380 (48.3) 111 (77.1) 1269 (46.8) <0.001
BMI, kg/m2 24.72 ± 2.89 23.98 ± 2.37 24.76 ± 2.91 0.0002
Smoking <0.001
Never 1753 (61.4) 46 (31.9) 1707 (62.9)
Ex-smoker. 561 (19.6) 36 (25.0) 525 (19.4)
Current smoker 543 (19.0) 62 (43.1) 481 (17.7)
Amount of smoking 7.2 ± 12.8 14.6 ± 16.1 6.8 ± 12.5 <0.0001 Dietary pattern
Carbohydrate (flour) -0.01 ± 0.58 -0.03 ± 0.49 -0.01 ± 0.58 0.5951
Dairy 0.23 ± 0.88 0.14 ± 0.87 0.23 ± 0.88 0.2433
Protein 0.06 ± 0.85 -0.03 ± 0.68 0.06 ± 0.86 0.1243
Carbohydrate (rice) 0.13 ± 0.95 0.11 ± 0.98 0.14 ± 0.95 0.7877 Vegetables -0.18 ± 0.76 -0.24 ± 0.87 -0.18 ± 0.76 0.3981 Baseline PFT
FVC (L) 3.78 ± 0.81 4.19 ± 0.84 3.76 ± 0.8 <0.0001
FEV1 (L) 3.12 ± 0.64 3.13 ± 0.62 3.12 ± 0.64 0.8013
FEV1 (%pred) 113.24 ± 14.07 106.56 ± 13.11 113.59 ± 14.03 <0.0001 FEV1/FVC 82.8 ± 5.28 75.05 ± 4.15 83.21 ± 5.01 <0.0001
test and Fisher’s exact test for other variables.
*Abbreviations: BMI = body-mass index; COPD = chronic obstructive pulmonary disease;
FEV1 = forced expiratory volume in 1 second; FVC = forced vital capacity; No. = number; %pred = percent achieved of predicted value.
Table 3. Baseline characteristics of the patients with or without COPD using propensity score matching.
Total COPD Normal
No. (%) 210 (100) 105 (50.0) 105 (50.0) SMD
Age, years 55.7 ± 8.3 55.2 ± 8.4 56.2 ± 8.2 -0.116
Male sex 393 (81.0) 90 (85.7) 84 (80.0) 0.1521
BMI, kg/m2 24.45 ± 2.98 24.35 ± 2.89 24.54 ± 3.08 0.1521
Smoking 0.1748
Never 146 (30.0) 29 (27.6) 36 (34.3)
Ex-smoker. 137 (28.2) 31 (29.5) 24 (22.9)
Current smoker 203 (41.8) 45 (42.9) 45 (42.9)
Amount of smoking 18.4 ± 19.0 20.6 ± 20.7 16.1 ± 16.8 Dietary intake
Carbohydrate (flour) -0.07 ± 0.56 -0.06 ± 0.52 -0.07 ± 0.59 0.0215
Dairy 0.2 ± 1.02 0.2 ± 1.00 0.2 ± 1.03 -0.0069
Protein 0.13 ± 1.42 0.05 ± 0.71 0.21 ± 1.88 -0.1137
Carbohydrate (rice) 0.06 ± 0.97 0.08 ± 0.95 0.05 ± 0.99 0.0333 Vegetables -0.16 ± 0.78 -0.13 ± 0.74 -0.19 ± 0.81t 0.0855 Baseline PFT
FVC (L) 4.11 ± 0.79 4.22 ± 0.86 3.99 ± 0.71
FEV1 (L) 2.99 ± 0.64 2.76 ± 0.62 3.23 ± 0.57
FEV1 (%pred) 105.6 ± 18.19 95.15 ± 14.65 116.05 ± 15.17
FEV1/FVC 72.95 ± 9.08 65.1 ± 4.08 80.81 ± 4.94
*Abbreviations: BMI = body-mass index; COPD = chronic obstructive pulmonary disease;
FEV1 = forced expiratory volume in 1 second; FVC = forced vital capacity; No. = number; %pred = percent achieved of predicted value; SMD = standardized mean difference.
Table 4. Taxon more frequently found in COPD patients than in the healthy population.
Taxon† Odds ratio 95% confidence
interval P-value‡
Mesonia 57.481 7.164~461.199 0.0001
Phaeobacter 44.362 5.733~343.267 0.0003
Salinibacter 37.082 5.184~265.242 0.0003
Succinivibrio 25.844 1.779~375.489 0.0172
Lacibacter 22.223 2.965~166.559 0.0025
Gracilibacillus 21.661 4.463~105.135 0.0001
Caldanaerocella 21.239 3.464~130.205 0.001
Streptosporangium 20.28 3.821~107.632 0.0004
Acidaminococcus 20.144 3.539~114.658 0.0007
Saccharospirillum 19.446 2.797~135.203 0.0027
Winogradskyella 18.191 2.034~162.724 0.0095
Isobaculum 17.62 2.927~106.074 0.0017
Crenothrix 16.892 2.551~111.87 0.0034
Micromonospora 16.421 1.501~179.631 0.0219
Kibdelosporangium 15.933 1.695~149.781 0.0155
Methylovorus 15.717 2.484~99.463 0.0034
Sulfurospirillum 15.172 1.177~195.599 0.0371
Corallococcus 15.147 1.574~145.775 0.0186
Parapedobacter 14.561 1.24~170.932 0.0331
Ignatzschineria 13.019 1.392~121.773 0.0245
Actinopolymorpha 13.016 2.458~68.912 0.0025
Acetobacterium 12.798 2.25~72.789 0.004
Thermovum 12.254 1.308~114.83 0.0282
OR-59 11.933 1.226~116.16 0.0327
Fusibacter 11.47 2.274~57.856 0.0031
Aliivibrio 11.336 1.111~115.699 0.0405
Nodosilinea 11.175 1.895~65.908 0.0077
Lampropedia 10.861 2.128~55.435 0.0041
Rikenella 10.704 2.434~47.072 0.0017
Acaryochloris 10.391 1.936~55.777 0.0063
Serpens 10.298 1.191~89.013 0.0341
Azotobacter 10.065 1.065~95.131 0.0439
Helicobacter 9.991 1.993~50.099 0.0051
BSV43 9.929 1.058~93.208 0.0445
Fulvimarina 9.804 1.731~55.521 0.0099
Table 4. (continued).
Taxon† Odds ratio 95% confidence
interval P-value‡
Kytococcus 9.267 2.392~35.902 0.0013
Listeria 9.241 1.035~82.49 0.0465
Marinimicrobium 9.181 1.561~54 0.0142
Desulfomonile 8.69 1.151~65.621 0.0361
RS62 8.178 1.624~41.183 0.0108
Leadbetterella 8.079 1.607~40.626 0.0112
Promicromonospora 7.918 2.287~27.413 0.0011
Gelidibacter 7.597 1.022~56.452 0.0475
Oligella 7.063 1.193~41.819 0.0312
Gallibacterium 7.008 1.174~41.84 0.0327
Methylophaga 6.926 1.343~35.721 0.0208
Pandoraea 6.598 1.638~26.574 0.0079
Herbaspirillum 6.511 1.259~33.673 0.0254
Edaphobacter 5.599 1.114~28.137 0.0365
Nostoc 5.221 1.365~19.973 0.0158
Psychrilyobacter 5.076 1.001~25.738 0.0498
Streptacidiphilus 4.585 1.189~17.679 0.027
Myxococcus 4.378 1.383~13.866 0.012
Geobacter 4.048 1.273~12.876 0.0179
Thermoanaerobacterium 3.866 1.232~12.132 0.0205
Nitrospira 3.812 1.676~8.672 0.0014
Abiotrophia 3.7 1.9~7.207 0.0001
Gillisia 3.618 1.307~10.017 0.0133
Oceanobacillus 3.549 1.382~9.114 0.0085
Pelosinus 3.509 1.084~11.363 0.0363
Schwartzia 3.454 1.24~9.624 0.0177
Alicyclobacillus 3.237 1.507~6.952 0.0026
Kineococcus 2.291 1.032~5.086 0.0416
Agrococcus 2.076 1.016~4.24 0.0451
Planomicrobium 1.933 1.085~3.443 0.0252
Amaricoccus 1.865 1.015~3.425 0.0446
Mycobacterium 1.768 1.182~2.645 0.0056
Actinobaculum 1.725 1.151~2.585 0.0082
Enterococcus 1.638 1.087~2.469 0.0184
Citrobacter 1.627 1.077~2.456 0.0207
Table 4. (continued).
Taxon† Odds ratio 95% confidence
interval P-value‡
Rubellimicrobium 1.626 1.049~2.522 0.0297
Anoxybacillus 1.614 1.021~2.552 0.0404
Deinococcus 1.521 1.002~2.307 0.0487
Ruaniaceae (f) 44.172 5.946~328.173 0.0002
Dehalobacteriaceae (f) 26.323 4.276~162.026 0.0004
Halobacteriaceae (f) 20.452 1.585~263.881 0.0207
AKIW659 (f) 13.417 1.382~130.279 0.0252
Chlamydomonadaceae (f) 9.814 2.476~38.895 0.0012
0319-6A21 (f) 9.23 2.791~30.524 0.0003
Ruaniaceae (f) 7.622 1.192~48.748 0.0319
Oceanospirillaceae (f) 7.545 1.973~28.848 0.0031
Listeriaceae (f) 7.116 1.315~38.524 0.0228
Rivulariaceae (f) 6.405 1.125~36.458 0.0363
Jonesiaceae (f) 6.323 1.179~33.918 0.0314
Gordoniaceae (f) 5.995 1.546~23.248 0.0096
Helicobacteraceae (f) 5.715 1.528~21.38 0.0096
PAUC26f (f) 4.86 1.306~18.092 0.0184
Nocardiopsaceae (f) 4.567 1.401~14.889 0.0118
Iamiaceae (f) 4.395 1.388~13.911 0.0118
Rhodospirillaceae (f) 4.351 1.178~16.064 0.0274
Koribacteraceae (f) 3.709 1.151~11.949 0.0281
Syntrophobacteraceae (f) 3.151 1.571~6.323 0.0012
Gemmataceae (f) 3.133 1.236~7.941 0.0161
Acidobacteriaceae (f) 2.421 1.083~5.41 0.0311
Hyphomicrobiaceae (f) 1.923 1.001~3.693 0.0495
Staphylococcaceae (f) 1.849 1.162~2.941 0.0095
Dietziaceae (f) 1.763 1.055~2.947 0.0305
Nocardioidaceae (f) 1.661 1.104~2.5 0.0149
Coriobacteriaceae (f) 1.633 1.091~2.445 0.0172
Aeromonadaceae (f) 1.541 1.031~2.301 0.0348
Dermabacteraceae (f) 0.405 0.18~0.912 0.0291
S1198 (o) 28.982 4.594~182.849 0.0003
Cytophagales (o) 22.265 2.469~200.776 0.0057
Methylococcales (o) 21.704 3.036~155.138 0.0022
PL-11B10 (o) 18.593 1.188~290.972 0.0373
Table 4. (continued).
Taxon† Odds ratio 95% confidence
interval P-value‡
MBNT15 (o) 13.403 2.604~68.992 0.0019
Chlamydiales (o) 11.641 2.194~61.779 0.0039
Myxococcales (o) 11.625 3.179~42.508 0.0002
MBA08 (o) 10.625 1.799~62.742 0.0091
Campylobacterales (o) 10.159 1.086~95.063 0.0421
Chroococcales (o) 9.904 2.048~47.892 0.0044
Thiohalorhabdales (o) 8.085 1.616~40.462 0.011
NB1-j (o) 7.05 1.282~38.771 0.0247
HOC36 (o) 6.622 1.268~34.577 0.025
CCM11a (o) 5.412 1.09~26.867 0.0389
Ellin6067 (o) 2.545 1.309~4.948 0.0059
Chlorophyta (o) 1.995 1.06~3.755 0.0322
MB-A2-108 (c) 26.808 3.795~189.368 0.001
Endomicrobia (c) 23.733 4.213~133.703 0.0003
028H05-P-BN-P5 (c) 22.275 2.257~219.875 0.0079
ABS-6 (c) 19.028 4.176~86.708 0.0001
3BR-5F (c) 8.627 1.688~44.096 0.0096
Deltaproteobacteria (c) 8.285 1.006~68.245 0.0494
ABY1 (c) 5.546 1.491~20.628 0.0106
TM7-1 (c) 2.21 1.348~3.623 0.0017
OctSpA1-106 (p) 18.395 1.755~192.76 0.0151
Gemmatimonadete (p) 15.633 1.643~148.767 0.0168
Chlorobi (p) 4.837 1.56~14.998 0.0063
FBP (p) 3.135 1.134~8.663 0.0276
†The taxa are shown at the genus level; those lacked genus name was annotated by “f”
(=family), “o” (=order), "c" (=class), or "p" (=phylum).
‡Correlated two-part model for semicontiguous data was used for analysis.
*Abbreviations: COPD = chronic obstructive pulmonary disease.
Table 5. Taxon more frequently found in COPD patients than in the healthy population using propensity score matching.
Taxon† Odds ratio 95% confidence
interval P-value‡
Mycetocola 10 1.28~78.117 0.0281
Dyadobacter 7 1.591~30.8 0.01
Pedobacter 6 1.343~26.808 0.019
Cellulomonas 4 1.129~14.175 0.0317
Cloacibacterium 4 1.129~14.175 0.0317
Rathayibacter 3.667 1.023~13.143 0.0461
Terracoccus 3.571 1.545~8.257 0.0029
Anaerococcus 3.4 1.254~9.216 0.0162
Oribacterium 2.909 1.466~5.771 0.0022
Curtobacterium 2.818 1.417~5.607 0.0032
Dermatophilus 2.467 1.354~4.494 0.0032
Actinoplanes 2.455 1.218~4.948 0.0121
Lactobacillus 2.437 1.362~4.362 0.0027
Chitinophaga 2.429 1.007~5.856 0.0482
[Ruminococcus] 2.3 1.095~4.832 0.0279
Gallicola 2.187 1.211~3.952 0.0095
Clavibacter 2 1.028~3.892 0.0413
Rothia 1.9 1.106~3.265 0.0202
Sphingobacterium 1.895 1.087~3.303 0.0242
Epulopiscium 1.889 1.067~3.344 0.0291
Sanguibacter 1.824 1.009~3.295 0.0465
Alkalibacterium 1.714 1.001~2.936 0.0497
Brevibacterium 1.667 1.005~2.765 0.0479
Paenibacillaceae (f) 5.5 1.219~24.813 0.0266
Micromonosporaceae (f) 3.444 1.64~7.235 0.0011
Sphingobacteriaceae (f) 3.25 1.06~9.967 0.0393
Planococcaceae (f) 3.25 1.06~9.967 0.0393
[Weeksellaceae] (f) 3 1.411~6.379 0.0043
Frankiaceae (f) 2.562 1.438~4.566 0.0014
Staphylococcaceae (f) 2.231 1.16~4.291 0.0162
Geodermatophilaceae (f) 2.091 1.019~4.289 0.0442
Actinomycetales (o) 3.125 1.41~6.928 0.005
Table 5. (continued).
Taxon† Odds ratio 95% confidence
interval P-value‡
Sphingobacteriales (o) 3 1.348~6.678 0.0071
Gemm-5 (c) 2.182 1.069~4.454 0.0321
Gitt-GS-136 (c) 1.714 1.001~2.936 0.0497
†The taxa are shown at the genus level; those lacked genus name was annotated by “f”
(=family), “o” (=order), "c" (=class), or "p" (=phylum).
‡Correlated two-part model for semicontiguous data was used for analysis.
*Abbreviations: COPD = chronic obstructive pulmonary disease.
Table 6. The relative abundance analysis of phylum Bacteroidetes and Firmicutes in COPD patients.
Normal COPD
Mean SE Mean SE P-value
Total cohort
p__Bacteroidetes 3.9215 0.0655 4.1671 0.3333 0.4712 p__Firmicutes 19.8052 0.2229 19.2451 1.0565 0.605 F/B ratio 117.1826 13.6198 72.7103 31.2863 0.1946 F/B, median/IQR 5.3469 7.6631 4.5965 6.3646 0.1471 Propensity
mated cohort
p__Bacteroidetes 4.0021 0.6068 4.1671 0.3333 0.8118 p__Firmicutes 17.7117 1.0498 19.2451 1.0565 0.3044 F/B ratio 272.7074 107.5604 72.7103 31.2863 0.0768 F/B, median/IQR 6.6068 10.9201 4.5965 6.3646 0.0355
*Abbreviations: COPD = chronic obstructive pulmonary disease; F/B = Firmicutes/Bacteroidetes; IQR = interquartile range; p__ = phylum; SE = standard error.
Figure 1. Shannon and Simpson indices. (A) Shannon index of normal, COPD prevalent, COPD incident cases. (B) Shannon index of propensity score-matched normal cohort with COPD prevalent cases. There was significant difference in Shannon index of normal cohort with COPD prevalent cases (P-value = 0.0013). (C) Simpson index of normal, COPD prevalent, COPD incident cases. (D) Simpson index of propensity score-matched normal cohort with COPD prevalent cases. There was significant difference in Simpson index of normal cohort with COPD prevalent cases (P-value = 0.0046).
*Abbreviations: COPD = chronic obstructive pulmonary disease; PSM = propensity score- matched cohort.
Figure 2. Beta diversity assessed with Jaccard index. (A) Jaccard index of normal, COPD prevalent, COPD incident cases. (B) Jaccard index of propensity score-matched normal cohort with COPD prevalent cases. There was significant difference in Shannon index of normal cohort with COPD prevalent cases (P-value = 0.0295).
*Abbreviations: COPD = chronic obstructive pulmonary disease; PSM = propensity score matched cohort.
Figure 3. The result of principal component analysis (PCA). (A) PCA plot of total study subjects. (B) PCA plot of COPD and propensity score mated cohort of healthy subjects.
*Abbreviations: COPD = chronic obstructive pulmonary disease; PSM = propensity score matched cohort.
Figure 4. Comparison of frequently identified microbiome classified by the phyla in COPD patients compared to the healthy control group and propensity score matched healthy cohort.
*Abbreviations: COPD = chronic obstructive pulmonary disease; PSM = propensity score matched cohort.