한국과 그리스 해운회사의 자본구조 결정에 관한 비교연구. 각국 해운회사의 자본구조를 분석하고 비교한 최초의 시도라는 점에서도 의미가 크다.
Introduction
Purposes and Contributions
Meanwhile, the results of this paper are expected to provide some insights to the shipping company's decision makers, especially Korean shipping companies, to maximize their business value by balancing capital structure between equity and debt by comparing with the Greek shipping company. Moreover, there have been few studies that have analyzed the capital structure in the shipping industry, and no studies have analyzed the capital structure of the shipping industry on a country-by-country basis.
Structure of the Paper
In fact, since each country has its own shipping policies such as tax system, financing system and the like, it is necessary to analyze the capital structure of each country separately.
Overview of Korean and Greek Shipping Industry
Korean Shipping Industry
- The current state of the Korean shipping industry
- The political aspects of the Korean shipping industry
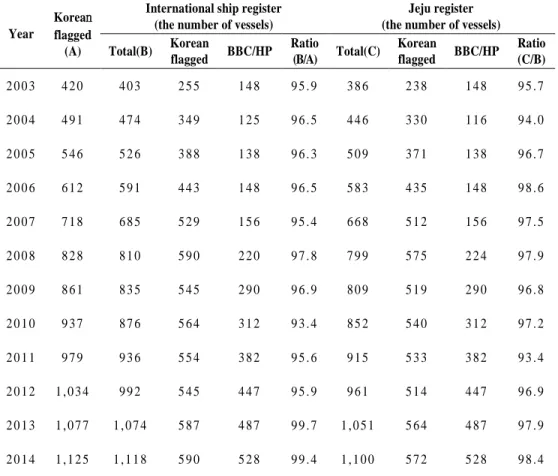
In order to solve this irrationality and strengthen the competitiveness of the Korean shipping industry, the tonnage tax system was implemented on January 1, 2005. Accordingly, the Korean government established Jeju international ship registry system in 2002, as shown in Table 4.
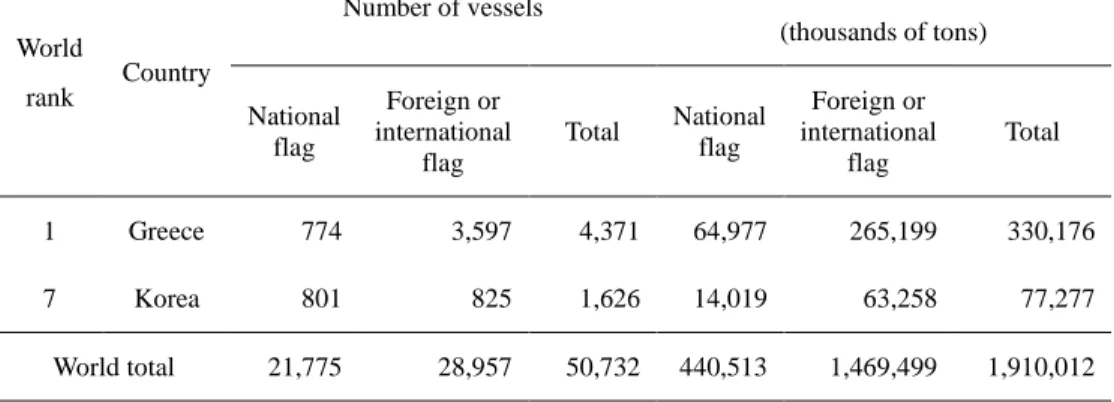
Greek Shipping Industry
- The current state of the Greek shipping industry
- The political aspects of the Greek shipping industry
- The characteristics of the Greek shipping industry
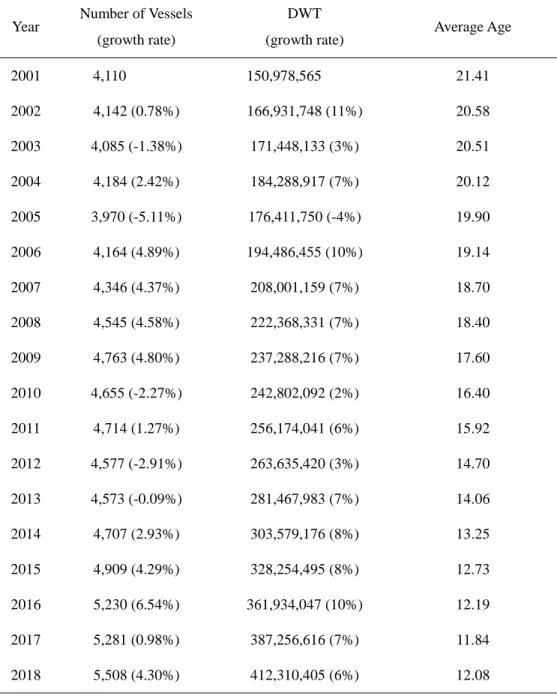
The lowest number of Greek shipping companies was registered at 588 companies in 2018 as shown in Figure 4 below. Ironically, while the number of ships and DWT increased, the number of Greek shipping companies had decreased from 926 in 1998 to 588 in 2018. One of the main competitive factors for Greek shipping is flag state policies (Grammenos and Choi, 1999; Pallis, 2007).
Grammenos and Choi (1999) point out that the Greek government has made an effort to attract Greek shipping companies and to retain existing companies through tax cuts. Furthermore, flags of convenience were also another side that contributed to the competitive structure of Greek ships. Pallis (2007) argues that Greek shipping companies have led the industry through fleet renewal practices, organizational structures and management practices and strategies.
Family business is a known key factor of the Greek shipping industry for the global shipping market. In particular, Greek family-controlled shipping companies scored well in asset play and the chartering strategies.
A Comparison of Financial Ratios of Korean and Greek Shipping Companies
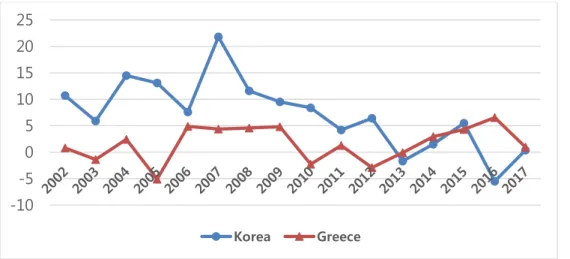
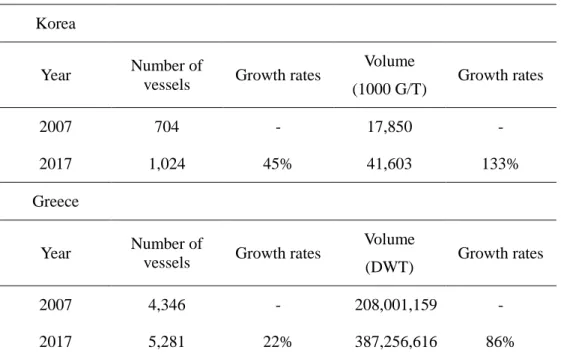
- Financial ratios of growth
- Financial ratios of profitability
- Financial ratios of stability
Net income to total assets (ROA) and operating income to sales are the two aspects included in the analysis of ratios of profitability as shown in Table 12. In terms of financial stability ratios, Greece relies more on the stock market than Korea with approx. 9 % as depicted in Table 13. Korea has more total liabilities than Greece, and this shows that the market of Korea's ship finance is taking on more debt than the stock market, whether they want it or not.
In conclusion, the Greek shipping sector performed better than the Korean shipping sector in terms of financial ratios. In addition, Korean shipping companies are overly dependent on the debt capital market, which is inevitable as it means the reluctance of Korean banks to finance the shipping industry. Therefore, Korean shipping companies have to look for various financial instruments, especially in the stock market to raise funds, including from international institutions.

Literature Review
- Capital Structure Theory
- Speed of Adjustment Analysis
- Capital Structure in the Shipping Industry
- Capital Structure in Korean Companies
- Factors
The result shows that although the two capital structure theories are significant in the test, the pecking order theory outperforms the trade-off theory. Moreover, there are some other articles that examine the capital structure models and analyze the pecking order theory and trade-off theory for the case of Korea. Yoon (2005) estimates the static capital structure model and concludes that there is no predominant model between the pecking order and trade-off theory.
2015) analyzes the decisive factors for the capital structure and whether the companies follow trade-off theory or pecking order theory. Since the late 2000s, studies have been conducted on the adjustment speed of capital structure in Korea. Kim (2007b) provides the eight independent variables that are significantly related to leverage, and he argues that trade-off theory, pecking order theory and market timing theory can explain a company's capital structure.
Shin and Moon (2008) investigate the capital structure adjustment speed of Korean SMEs listed on KOSDAQ. Finally, the capital structure adjustment speed over the entire period is 39% of book leverage and 44% of market leverage.

Data and Methodology
Data
The data must therefore be investigated to see if there is a unit root in the variables. Therefore, the stationarity of data can be determined by the presence of a unit root. On the other hand, the panel unit root test investigates the existence of a unit root based on several time series simultaneously (Levin et al., 2002).
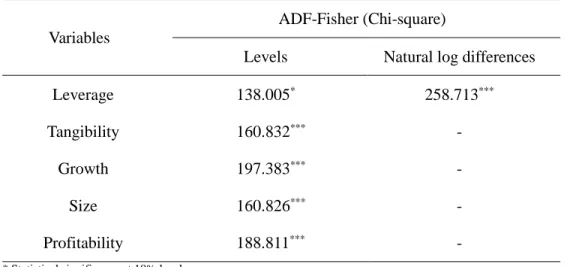
To evaluate the presence of unit root in the data of this study, the panel ADF test is applied. The tests indicate that most variables do not have unit root, except for leverage in the Korean model. The variable of leverage is therefore transformed as natural log first difference to reject the null hypothesis that unit root exists.
Despite there being no unit root in the Greek model's leverage data, leverage is also converted as the first difference to facilitate comparison with the Korean model for analysis. Tangibility and growth are positively correlated with the leverage of both Korean and Greek shipping companies.
Methodology
- Capital structure regression
- Speed of adjustment
Where 𝛥ln𝐿𝑒𝑣𝑒𝑟𝑎𝑔𝑒𝑖𝑡 is the first difference of the natural logarithm of total liabilities to total assets for firm 𝑖 at time 𝑡 (Frank and Goyal, 2009; Arvanitis et al., 2012);. In addition, a Hausman test is performed to confirm whether a fixed or random effect is appropriate for a panel model. In the Hausman test, if the null hypothesis is accepted under the null hypothesis that the random effect is correct, the random effect is more appropriate, but if the null hypothesis is rejected, the fixed effect is more appropriate for the model.
The result of Hausman test shows that the Korean model rejected the null hypothesis (p-value is 0.001), and it is interpreted that the fixed effect would be more appropriate. On the other hand, the Greek model assumes the null hypothesis (p-value is 0.482) and the random effect is estimated to be more correct. To keep pace with the target debt ratio, companies must pay the adjustment costs, which makes it impossible for companies to immediately adjust their capital structure.
Consequently, if there is a gap between the actual debt ratio and the target debt ratio, firms adjust the capital structure on an annual basis (Flannery and Rangan, 2006). Where 𝐿𝑒𝑣𝑖𝑡− 𝐿𝑒𝑣𝑖𝑡−1 is changes in leverage; λ is the speed of capital structure adjustment from current leverage to optimal leverage.
Empirical Results
Capital Structure Regressions
Furthermore, profitability shows the highest coefficient, which means that profitability is the most important factor to determine the Korean firm's leverage. Firm fixed effects and year fixed effects are not increasing the explanatory power of the model, unlike previous studies (Lemmon et al., 2008; Drobetz et al., 2013). The estimated coefficients of vulnerability, growth and profitability are consistent with the regressions of Korean shipping companies.
Most of the literature has a positive sign for tangibility and size; while the negative sign is for growth and profitability. Deterioration of capital structure due to macroeconomic factors The shipping industry is largely influenced by global economic conditions.

Capital Structure Regressions with Macroeconomic Factors
According to the strike order theory, an increase in the value of collateral leads to a decrease in information asymmetry, which leads to a decrease in the cost of equity issuance. The results can also be applied to explain the shipping business models of the two countries. Therefore, the relatively short-term change in market conditions does not directly affect their profitability.
In terms of the operator model in the Korean shipping lines, the increase in the second-hand ship prices means the increase in freight rates, and this brings the company to the decrease in their leverage. Consequently, the growth of the sea trade volume also leads to the increase of the profit. This is because the decrease in leverage caused by the increase in second-hand ship prices depends on the sale of vessels, not the growth of profits.
Consequently, the increase in demand, which is synchronous with the seaborne trade volume, does not justify the increase in profitability in the owner model. Because they contract the chartering on a long-term basis, the growth of seaborne trade volume does not affect their profitability.

Speed of Adjustment
As for the ownership model in the Greek shipping lines, the increase in freight rates does not immediately affect the company.

Conclusion
The results of capital structure regressions indicate that the signs of the estimated coefficients of all variables are consistent with previous studies (Rajan and Zingales, 1995; Frank and Goyal, 2009; Arvanitis et al., 2012; Drobetz et al., 2013 ; Anna et al., 2015) except growth. On the other hand, because most of shipping companies' assets consist of ships, leverage has the largest share in the capital structure. Firstly, it will provide insights to the decision maker of the shipping company, especially Korean shipping companies, to maximize their business value by balancing capital structure between equity and debt compared to the Greek shipping company.
Second, until now, there have been few studies that analyze the capital structure of the shipping industry. Basically, there is no precedential comparative research that has been done to analyze the capital structure of each country. The relationship between business cycles and the choice of capital structure: The case of the international shipping industry.
A Study on the Reform of the Ship Investment Company System for the Revitalization of Shipping Funds. An empirical study on the importance between capital form and capital structure in Korean listed companies.