서론
. ,
. , ,
1)
.
.
, ,
, ,
2)
.
,
3-7)
.
중풍환자의 변증(辨證)과 기온 및 강수여부와의 상관성에 관한 연구
마미진, 김보람, 김미경, 최동준, 한창호, 정승현, 신길조, 이원철*
동국대학교 한의과대학 한방내과학교실, 부산대학교 한의학전문대학원 한방내과*
The correlation between average temperature & precipitation and Pattern Identification of the patients with stroke
Mi-Jin Ma, Bo-Ram Kim, Mi-Kyung Kim, Dong-Jun Choi, Chang-Ho Han, Seung-Hyun Jung, Gil-Jo Shin, Won-Chul Lee*
Department of Koearn Internal Medicine, College of Oriental Medicine, Dongguk University Department of Korean Internal Medicine, Pusan National University School of Oriental Medicine*
Objectives : This study was to investigated the correlation between average temperature & precipitation and pattern identification of the patients with stroke.
Methods : 115 stroke patients within 30days of onset were registered during the study period. Pattern identification of stroke was classified into Fire and heat, Turbid phlegm and others. We took the mean of average temperature according to pattern identification and analyzed pattern identification into two groups according to climatological normal of average temperature in Seoul. We also analyzed pattern identification into two groups according to existence of precipitation.
Results : Heat and fire, and other type of pattern identification had high frequency when average temperature was higher than 12.2℃. And there was no correlation between precipitation and pattern identification of stroke.
Key Words : Stroke, Temperature, Precipitation, Pattern identification
3)
,
4)
.
5-7)
.
,
8)
. 2005
, , , ,
9)
.
“ ”, “ ” .
,
.
.
연구방법
1. 연구대상
2007 4 1 30
,
. , ,
.
2. 자료의 수집
.
,
. ,
, , ,
, ,
3 .
,
.
3. 조사변수
, ,
,
. 7
,
,
0mm
.
4. 통계 분석
Mean±SD(standard deviation)
Number(%) , One Way
ANOVA, Chi-square test
, p-value < 0.05 .
결과
2007 4 2008 3
30
177 ,
119 .
,
,
4 115 .
7
.
11.63~12.73 ,
8.16~9.07 , 12.91~13.98
,
, ,
, (Table 2).
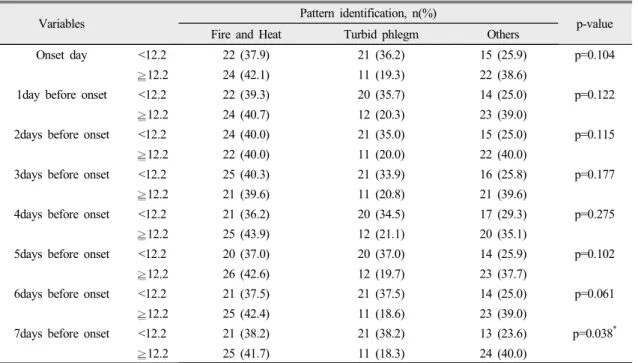
7
30 12.2
. 6 7
, 12.
2 , 12.2
. 7 p-value=0.038
, 6 p=
0.061
12.2 , 12.2
(Table 3).
7
, (Table 4).
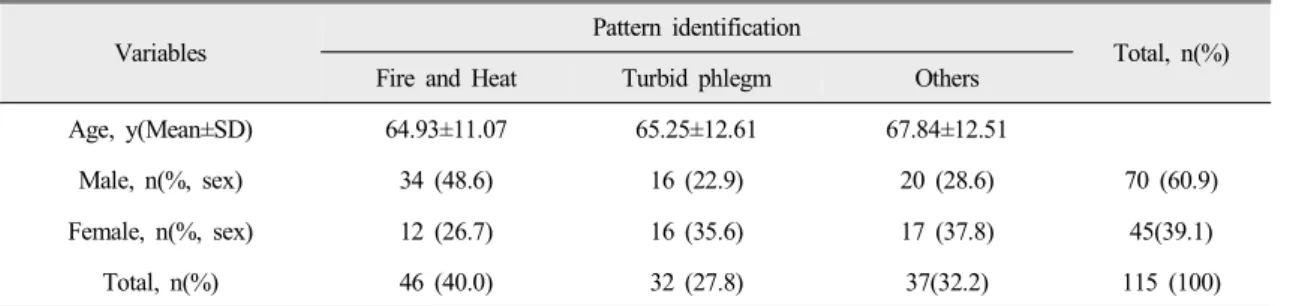
Variables
Pattern identification
Total, n(%)
Fire and Heat Turbid phlegm Others
Age, y(Mean±SD) 64.93±11.07 65.25±12.61 67.84±12.51
Male, n(%, sex) 34 (48.6) 16 (22.9) 20 (28.6) 70 (60.9)
Female, n(%, sex) 12 (26.7) 16 (35.6) 17 (37.8) 45(39.1)
Total, n(%) 46 (40.0) 32 (27.8) 37(32.2) 115 (100)
n = number of subjects
% in parenthesis indicates the percentage of the row
Table 1. General Characteristics
Variables
Pattern identification (Mean±SD)
p-value
Fire and Heat Turbid phlegm Others
Onset day 12.00±11.07 9.07±11.93 13.16±10.05 p=0.276
1day before onset 12.11±10.02 8.72±11.84 12.91±9.81 p=0.220
2days before onset 12.08±10.23 8.47±11.99 13.13±9.47 p=0.163
3days before onset 11.63±10.17 8.16±11.62 13.43±9.60 p=0.110
4days before onset 12.27±10.20 8.18±11.65 13.31±9.36 p=0.103
5days before onset 12.73±10.15 8.70±11.96 13.66±9.49 p=0.120
6days before onset 12.23±10.21 8.88±11.80 13.98±9.50 p=0.128
7days before onset 12.36±10.23 8.96±11.82 13.52±9.76 p=0.184
Table 2. Average Temperature(℃) according to Pattern identification - 1
Variables Pattern identification, n(%)
p-value
Fire and Heat Turbid phlegm Others
Onset day <12.2 22 (37.9) 21 (36.2) 15 (25.9) p=0.104
12.2 24 (42.1) 11 (19.3) 22 (38.6)
1day before onset <12.2 22 (39.3) 20 (35.7) 14 (25.0) p=0.122
12.2 24 (40.7) 12 (20.3) 23 (39.0)
2days before onset <12.2 24 (40.0) 21 (35.0) 15 (25.0) p=0.115
12.2 22 (40.0) 11 (20.0) 22 (40.0)
3days before onset <12.2 25 (40.3) 21 (33.9) 16 (25.8) p=0.177
12.2 21 (39.6) 11 (20.8) 21 (39.6)
4days before onset <12.2 21 (36.2) 20 (34.5) 17 (29.3) p=0.275
12.2 25 (43.9) 12 (21.1) 20 (35.1)
5days before onset <12.2 20 (37.0) 20 (37.0) 14 (25.9) p=0.102
12.2 26 (42.6) 12 (19.7) 23 (37.7)
6days before onset <12.2 21 (37.5) 21 (37.5) 14 (25.0) p=0.061
12.2 25 (42.4) 11 (18.6) 23 (39.0)
7days before onset <12.2 21 (38.2) 21 (38.2) 13 (23.6) p=0.038*
12.2 25 (41.7) 11 (18.3) 24 (40.0)
n = number of subjects
% in parenthesis indicates the percentage of the row
* = p < 0.05
Table 3. Average Temperature(℃) according to Pattern identification - 2
Precipitation Pattern identification, n(%)
p-value
Fire and Heat Turbid phlegm Others
Onset day O 11 (40.7) 9 (33.3) 7 (25.9) p=0.664
X 35 (39.8) 23 (26.1) 30 (34.1)
1day before onset O 15 (42.9) 10 (28.6) 10 (28.6) p=0.854
X 31 (38.8) 22 (27.5) 27 (33.8)
2days before onset O 13 (32.5) 9 (22.5) 18 (45.0) p=0.099
X 33 (44.0) 23 (30.7) 19 (25.3)
3days before onset O 14 (35.0) 14 (35.0) 12 (30.0) p=0.448
X 32 (42.7) 18 (24.0) 25 (33.3)
4days before onset O 16 (40.0) 13 (32.5) 11 (27.5) p=0.638
X 30 (40.0) 19 (25.3) 26 (34.7)
5days before onset O 12 (38.7) 10 (32.3) 9 (29.0) p=0.800
X 34 (40.5) 22 (26.2) 28 (33.3)
6days before onset O 11 (37.9) 10 (34.5) 8 (27.6) p=0.634
X 35 (40.7) 22 (25.6) 29 (33.7)
7days before onset O 15 (40.5) 11 (29.7) 11 (29.7) p=0.916
X 31 (39.7) 21 (26.9) 26 (33.3)
n = number of subjects
% in parenthesis indicates the percentage of the row
Precipitation : O is days with precipitation phenomenon, X is days without precipitation phenomenon
Table 4. The Correlation between Pattern identification and Precipitation
고찰
.
24~54 , 65
3)
,
, ,
4)
. , .
, -
,
5)
, 65
6)
.
,
10)
.
,
. ,
, .
1,2)
. ,
,
11)
.
,
“ ”
. ,
. ,
,
2 , 33
.
12)
,
“ ”
13)