Journal of the Korean Society for Power System Engineering http://dx.doi.org/10.9726/kspse.2017.21.3.102 Vol. 21, No. 3, pp. 102-107, June 2017
Nondestructive Evaluation on Hydrogen Effect of TIG Welded Stainless Steel for Component Design of Pressure
Vessel
Jin-Kyung Lee*†
(Received 15 May 2017, Revision received 15 June 2017, Accepted 15 June 2017)
Abstract: A tungsten inert gas (TIG) welding method was used for the bonding of stainless steel. TIG welding using inert gas (He or Ar gas) is a method to prevent oxidation and nitriding of materials and to combine non-ferrous metals. This method has the advantage of obtaining a smooth weld surface. In this study, the welding characteristics of 304 stainless steel welded by TIG welding method were analyzed by using nondestructive technique. Ultrasonic and Acoustic Emission (AE) was applied to evaluate the micro-damage of TIG welded 304 stainless steel. The velocity and damping coefficient of ultrasonic wave showed a slight difference in HAZ, which is the welding part of stainless steel. The AE parameters of average frequency, rise time and event were analyzed for the dynamic behavior of stainless steel during loading. Optimal AE parameters for evaluating the degree of damage to the specimen have been derived. Fractograph and metal structures of 304 stainless steel using SEM and optical microscope were discussed.
Key Words:TIG Weld, Tensile Strength, Ultrasonic Wave, AE Technique, SEM
*
†
Jin-Kyung Lee(corresponding author) : Department of Mechanical Engineering, Dong-Eui University.E-mail : [email protected], Tel : 051-890-1663
1. Introduction
Austenitic stainless steels are widely used as components of offshore structures and pressure vessels due to their excellent corrosion resistance.
Generally, the stainless steel which is the material of the pressure vessel is welded by conventional TIG (tungsten inert gas) welding. Many researchers have studied TIG welding of stainless steel. Yueqiao Feng et al.
1)welded intermediate thickness (6-13 mm) AISI 316L stainless steel using Keyhole gas tungsten arc welding (K-TIG) to obtain a high
quality weld. They proposed the actual application
of the K-TIG process to combine a
medium-thickness 316L. Rajeev Kumar et al.
2)conducted a study on the effect of welding current
on beads and mechanical and structural stainless
steel welding using TIG welding. They induced
optimal currents for better microstructure, bead
width, bead penetration and hardness of stainless
steel. Ying Zou et al.
3)investigated the mechanical
properties of advanced A-TIG welded duplex
stainless steel and ferritic steels. Taewan et al.
4)studied parameter optimization using a regression
model and fitness function in laser welding of
aluminum alloys for car bodies, and determined the
optimal welding conditions in terms of the
productivity and weld-ability for laser welding of
aluminum alloy using filler wire. These researches were focused on the investigation of mechanical properties of welded materials using new weld method. In this study, the mechanical properties of tensile strength for TIG welded STS 304 material were analyzed. In particular, non-destructive evaluation of ultrasonic and acoustical emission (AE) tests
5-7)was applied to evaluate mechanical properties in each zone of HAZ and welding. The main purpose of this study is to evaluate the hydrogen effect of welded stainless steel using nondestructive technique. We also investigated fractal graphs and fracture surfaces using SEM and stereoscopic microscopy, and discussed the results.
The effect of hydrogen on the welded stainless steel was tested by applying the hydrogen charging
8-10)system, and non-destructive tests were also performed to evaluate the degree of microscopic damage caused by hydrogen on the welded specimens.
2. Material and experimental setup
In this study, hardness, impact absorption energy and tensile strength test were performed to evaluate the mechanical properties of welded stainless steel 304. Welding was done by TIG welding method.
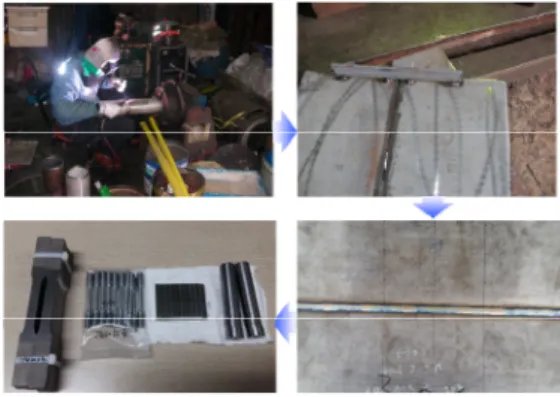
Fig. 1 shows the welding process of stainless steel for tensile test specimens and impact test specimens.
TIG welding of stainless steel was performed in an argon gas atmosphere using an electrode of 3.2 mm.
Welded stainless steel plates are processed to tensile and impact test specimens according to the ASTM standard (D 638). An electrochemical method was used to evaluate the hydrogen embrittlement of welded stainless steel. The hydrogen charging was done with sulfuric acid (H
2SO
4) and arsenic trioxide (As
2O
3) as the electrolyte, platinum wire to the anode, and test piece to the cathode.
9)The surface
structure of corroded stainless steel 304 using nitric acid was observed with an optical microscope. After the tensile test, the fracture surface was also observed by using an electron microscope (SEM).
Fig. 1 Welding process of stainless steel for the specimens of tensile test and impact test.
3. Results and discussion
3.1 Surface structure analysis of the welded stainless steel
Fig. 2 shows an optical microscope picture of the base metal, HAZ and welding areas of welded stainless steel. Fig. 2 (a) and (b) show the microstructure of the base metal and the heat affected zone (HAZ), which is a typical austenitic stainless steel subjected to the primary ferrite-based solidification mode.
7)The particle size of the HAZ region is slightly larger than that of the base metal.
(a) Base metal (b) HAZ (c) Weld Fig. 2 Optical microscopes from welded stainless
steel at 200Х magnification.
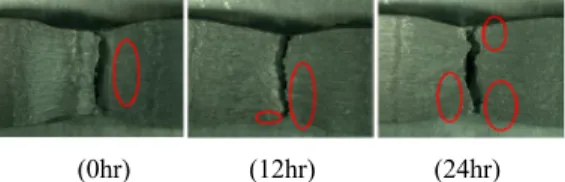
(0hr) (12hr) (24hr) Fig. 3 Fractograph of the specimen after tensile test
The microstructure of the ferrite was observed in the weld zone, which has a dendritic structure formed within grains of an austenite matrix. Fig. 3 shows the fractograph of the specimen using a stereoscopic microscope after tensile test. As shown in the figure, the necking phenomenon was observed on all specimens (hydrogen-free and hydrogen charging). However, slight microcracks were observed near the fracture surface of the charged specimen with hydrogen. These cracks were caused by embrittlement of stainless steel surfaces during hydrogen charging. The hydrogen free specimen exhibited a smooth ductile surface without micro cracks.
3.2 Nondestructive evaluation according to the damaged of the welded stainless steel
In this study, the mechanical properties of TIG welding and hydrogen charged stainless steels were evaluated using ultrasonic technique. The parameters of the velocity and attenuation factor of the ultrasonic wave depend on the characteristics of the material. Therefore, the velocity and attenuation coefficient of ultrasonic waves were measured in each region of welding and hydrogen charged specimens. Fig. 4 shows the velocity and attenuation coefficients in each zone of the welded specimen.
The longitudinal velocity of the weld, HAZ and base metal is 5,760 m/s, 5,700 m/s and 5,800 m/s respectively. The velocity at weld and base metal was similar to commercial stainless steel 304.
However, the velocity at HAZ was slightly lower than that of commercial stainless steel. As shown in
the Fig. 2, the increase in grain size in HAZ is attributed to heating. The attenuation coefficient was the lowest in the HAZ region and the highest in the weld metal. The attenuation coefficient of the weld zone was four times larger than the attenuation coefficient of the base metal. Ultrasonic attenuation occurs largely due to scattering and absorption within the material. The weld metal has a large number of ferrite grains and dendritic structures in the columnar austenite matrix and is a major cause of attenuation due to scattering. Fig. 5 shows the tensile strength and attenuation coefficient according to the degree of hydrogen charging in each region of the welded specimen. As the charging time increased, the attenuation coefficient increased in all areas of welds, HAZ and base metal. This is the cause of attenuation due to surface corrosion of specimen due to hydrogen charging. Tensile strength also decreased with increasing charge time. The tensile strength of the welded specimens was reduced by 25% after 24 hours hydrogen charging.
From these results, it is suggested that the hydrogen charging amount and the tensile strength can be estimated from the damping coefficient using ultrasonic waves. AE technique was also used to evaluate the dynamic damage behavior and hydrogen charging effect of welded stainless steel. Acoustic Emission is a type of elastic wave generated by
0.00 0.03 0.06 0.09 0.12 0.15
Weld HAZ Base
5500 5600 5700 5800 5900
Attenuation coefficient(dB/mm)
Attenuation coefficient Velocity
Velocity(m/s)
Fig. 4 Velocities and attenuation coefficients at each
zone of as-welded specimen
0 hr 12hr 24hr 0.00
0.04 0.08 0.12 0.16 0.20
400 450 500 550 600 650 700 Weld
HAZ Base
Attenuation coefficient(dB/mm)
Charging time(hour)
Tensile strength(MPa)
Tensile strength
Fig. 5 Attenuation coefficient, tensile strength vs.
charging time
Fig. 6 Typical waveforms of AE signals at each loading region
deformation and cracks in a material during loading.
The degree of damage of the material can be estimated by analyzing the waveform characteristics of the acoustic wave. Fig. 6 shows a typical waveform of the AE signal in each loading region.
As shown in Fig. 6, the AE signal in each loading region has a different waveform and frequency spectrum. A low amplitude signal occurred at the beginning of the load and in the plastic area.
However, a signal with a high amplitude occurred around the yield point and occurred when the specimen was completely broken. The frequency spectrum ranged from 0.3 to 0.6 MHz in the early
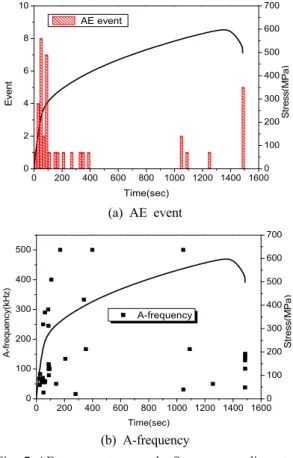
loading and plastic regions. At the point of yield and complete break, the frequency range of the signal was about 0.9 MHz, a very high frequency spectrum. We can predict the microscopic damage of stainless steel by signal analysis in all areas of the stress-strain curve. Fig. 7 shows the AE parameter of AE event, average frequency and rise time in hydrogen-free specimen. Many AE events occurred around the yield point, a few events occurred in the initial plastic zone, and many events occurred due to large cracks propagating during full fracture of the specimen. Fig. 7 (b) shows the average frequency of the AE signal and had a signal less than 500 kHz. A large number of signals with an average frequency of less than 200 kHz appeared at the beginning of the load and in the
0 100 200 300 400 500 600 700
Stress(MPa)
0 200 400 600 800 1000 1200 1400 1600 0
2 4 6 8 10
Event
Time(sec) AE event
(a) AE event
0 100 200 300 400 500 600 700
0 200 400 600 800 1000 1200 1400 1600 0
100 200 300 400 500
Stress(MPa)
A-frequency
A-frequency(kHz)
Time(sec)
(b) A-frequency
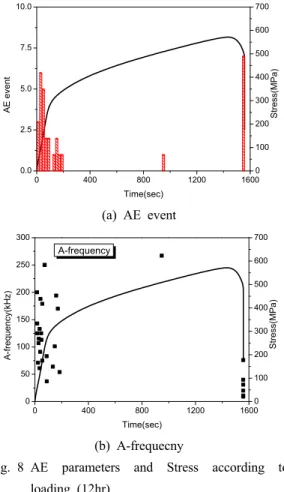
Fig. 7 AE parameters and Stress according to
loading (hydrogen free)
0 400 800 1200 1600 0 100 200 300 400 500 600 700
Stress(MPa)
Time(sec) 0.0
2.5 5.0 7.5 10.0
AE event
(a) AE event
0 400 800 1200 16000
100 200 300 400 500 600 700
0 50 100 150 200 250 300
Stress(MPa)
Time(sec) A-frequency
A-frequency(kHz)