Small Submucosal Tumors of the Stomach:
Differentiation of Gastric Schwannoma from Gastrointestinal Stromal Tumor with CT
Jin Wook Choi, MD
1,5, Dongil Choi, MD
1, Kyoung-Mee Kim, MD
2, Tae Sung Sohn, MD
3, Jun Haeng Lee, MD
4, Hee Jung Kim, MD
1, Soon Jin Lee, MD
1Departments of 1Radiology and Center for Imaging Science, 2Pathology, 3Surgery and 4Medicine, Samsung Medical Center, Sungkyunkwan University School of Medicine, Seoul 135-710, Korea; 5Department of Radiology, Kangwon National University College of Medicine, Chuncheon 200-701, Korea
Objective: To identify the CT features that help differentiate gastric schwannomas (GS) from small (5 cm or smaller) gastrointestinal stromal tumors (GIST) and to assess the growth rates of both tumors.
Materials and Methods: We included 16 small GSs and 56 GISTs located in the stomach. We evaluated the CT features including size, contour, surface pattern, margins, growth pattern, pattern and degree of contrast enhancement, and the presence of intralesional low attenuation area, hemorrhage, calcification, surface dimpling, fistula, perilesional lymph nodes (LNs), invasion to other organs, metastasis, ascites, and peritoneal seeding. We also estimated the tumor volume doubling time.
Results: Compared with GISTs, GSs more frequently demonstrated a homogeneous enhancement pattern, exophytic or mixed growth pattern, and the presence of perilesional LNs (each p < 0.05). The intralesional low attenuation area was more common in GISTs than GSs (p < 0.05). Multivariate analyses indicated that a homogeneous enhancement pattern, exophytic or mixed growth pattern, and the presence of perilesional LNs were statistically significant (p < 0.05). Tumor volume doubling times for GSs (mean, 1685.4 days) were significantly longer than that of GISTs (mean, 377.6 days) (p = 0.004).
Conclusion: Although small GSs and GISTs show similar imaging findings, GSs more frequently show an exophytic or mixed growth pattern, homogeneous enhancement pattern, perilesional LNs and grow slower than GISTs.
Index terms: Gastrointestinal submucosal tumor; Schwannoma; Submucosal tumor; Gastric tumor; Stomach; CT
Received May 24, 2011; accepted after revision December 14, 2011.
This study was supported by the Samsung Biomedical Research Institute grant, #SBRI C-B0-234-1.
Corresponding author: Dongil Choi, MD, Department of Radiology and Center for Imaging Science, Samsung Medical Center, Sungkyunkwan University School of Medicine, 50 Irwon-dong, Gangnam-gu, Seoul 135-710, Korea.
• Tel: (822) 3410-2518 • Fax: (822) 3410-0084
• E-mail: [email protected]
This is an Open Access article distributed under the terms of the Creative Commons Attribution Non-Commercial License (http://creativecommons.org/licenses/by-nc/3.0) which permits unrestricted non-commercial use, distribution, and reproduction in any medium, provided the original work is properly cited.
Korean J Radiol 2012;13(4):425-433
INTRODUCTION
Gastric submucosal tumors and mesenchymal origin- stromal tumors arise in the submucosa or muscularis propria of the gastric wall (1). They are divided into three major categories, including myogenic tumors (leiomyomas or leiomyosarcomas), neurogenic tumors (Schwannomas, granular cell tumors, and neurofibromas), and gastrointestinal stromal tumors (GISTs), according to the expression of marker proteins and ultrastructural characteristics (2). Recently, many small submucosal tumors were incidentally found in screening examinations such as upper GI roentgenography or endoscopy without any
pISSN 1229-6929 · eISSN 2005-8330
symptoms. Since a GIST is the most common submucosal tumor of the stomach, other submucosal tumors can be frequently mistaken for a GIST. Moreover, unlike mucosal tumors, an endoscopic biopsy using standard biopsy forceps usually cannot obtain an accurate diagnosis of submucosal tumors. Most large gastric submucosal masses require surgical resection as possible malignant tumors. Small submucosal masses not diagnosed by endoscopic biopsy can require either surgical resection or a follow-up with imaging. Many studies have been reported various imaging findings of benign submucosal tumors differentiated from GISTs with potential malignancy (3-12). A benign submucosal tumor and gastric schwannoma (GS) have a similar CT appearance as GIST. We sought to identify the CT features that differentiate small GSs from GISTs and assessed tumor growth rates.
MATERIALS AND METHODS
Study Population
We searched the pathologic database at our institution to find patients with small (≤ 5 cm in the longest diameter), gastric submucosal tumors who underwent a stomach CT scan between January, 2004 and December, 2008. We found 96 gastric submucosal tumors including 56 GISTs, 16 GSs, 6 lymphomas, 6 glomus tumors, 5 ectopic pancreas, 3 carcinoid tumors, 2 Brunner’s glands hyperplasia, and 2 leiomyomas. All these tumors were pathologically confirmed after surgery or biopsy.
Among them, patients with GSs and GISTs were enrolled in the study. The final study population consisted of 16 GS patients (M : F = 4 : 12; mean age, 58.7 years; age range, 35-74 years) and 56 GIST patients (M : F = 30 : 26; mean age, 60.0 years; age range, 27-81 years).
Histopathologic confirmation of each tumor was obtained from complete surgical excision in all 72 patients. The diagnosis of GSs and GISTs was based on a combination of morphologic assessment and immunohistochemistry results. Subsequently, we searched the medical database for patients with gastrointestinal (GI) symptoms, such as bleeding, abdominal pain, palpable mass, dyspepsia, and nausea, and obtained their endoscopy results.
Five GS patents and 19 GIST patients underwent a follow- up stomach CT scan before surgical resection. Eight patients who had an interval less than 60 days between the initial CT and follow-up CT scans were excluded in the estimation of tumor volume doubling times. Four GS patients (M : F =
0 : 4; mean age, 56.8 years; age range, 37-65 years) and 12 GIST patients (M : F = 7 : 5; mean age, 64.9 years; age range, 30-81 years) were included in the assessment of growth rates.
CT Imaging and Follow-Up
CT examinations were performed with one of three helical scanners (LightSpeed 16 or Lightspeed VCT, GE Healthcare, Milwaukee, WI, USA; and Brilliance 40, Philips Healthcare, Cleveland, OH, USA) for all patients that had fasted for over 6 hours. Before the examination, each patient ingested 500 ml tap water to distend the stomach. A prone position on the scanning table was required to prevent artifacts caused by air in the stomach. In cases of a lesion located in the cardia or fundus at upper endoscopy or roentgenography, the patient was positioned supine for CT scanning. Unenhanced CT was not performed. For contrast-enhanced CT, a dose of 2 mg/kg of a nonionic contrast agent (Iopromide, Ultravist; Schering, Berlin, Germany) was administrated intravenously through an 18-gauge angiographic catheter at a rate of 4 mL/sec using a power injector (OptiVantage, Liebel-Flarsheim; Mallinckrodt, Neustadt, Germany). CT scanning was started 70 seconds after contrast material injection, namely in the portal venous phase. The scanning ranged from the xyphoid process to the lower end of the symphysis pubis. CT scanning parameters were as follows:
for 16 detector rows, a beam collimation of 1.25 mm x 16, a pitch of 0.938, kVp/ effective mA 120/300, and a gantry rotation time of 0.6 seconds; for 40 detector rows, a beam collimation of 0.625 mm x 40, a pitch of 0.926; kVp/
effective mA, 120/200, and a gantry rotation time of 0.5 seconds; for 64 detector rows, a beam collimation of 0.625 mm x 64, a pitch of 0.984; kVp/mA 120/100-300, and a gantry rotation time of 0.6 seconds. Isotropic raw data was acquired with a slice thickness of 1 mm and an interval of 1 mm at MDCT. Using these raw data, a transverse image was obtained with a slice thickness of 5 mm and an interval of 5 mm; the coronal and sagittal multiplanar reformation (MPR) images were reconstructed on a workstation. Each MPR image was obtained at a 3 mm interval with a slice thickness of 3 mm. Follow-up CT scans were obtained in the same manner as initial CT scans.
Image Analysis
The CT images were retrospectively evaluated by
consensus of two radiologists who were blinded to the final diagnosis of the gastric mass on a 2000 x 2000 picture
archiving and communication system (PACS) workstation (PathSpeed, GE Healthcare, Milwaukee, WI, USA). When two or more pre-operative CT scans were performed, we analyzed the most recent pre-operative images. We analyzed gastric tumors with special attention to the morphological features of the masses, such as size, contour (round or lobulated), surface pattern (regular or irregular), margins (well-defined or ill-defined), or growth pattern (endoluminal, exophytic or mixed). The CT images were evaluated for pattern (homogeneous, heterogeneous) and degree of contrast enhancement (good, moderate or poor), and presence or absence of intralesional low attenuation area (i.e., necrosis), hemorrhage, calcification, and surface dimpling (i.e., ulcer). CT scans were evaluated based on the presence of perilesional lymph nodes, which were considered to be positive if the shortest diameter of the perilesional lymph node was greater than 5 mm. The masses were also evaluated for presence or absence of fistula, invasion to other solid organs, metastasis, ascites, and peritoneal seeding. Disagreement between two radiologists was resolved in conference along with a third radiologist.
One radiologist used an area measuring tool and the summation-of-areas technique on CT scans to measure the volumes of the baseline tumors and the last follow-up tumors at the maximal magnification of a PACS monitor (13).
The tumor volume doubling times of tumors were calculated with Schwartz’s equation (14): tumor volume doubling time
= (T-To) x log2 / (log V-log Vo), where T-To indicates the time interval between two measurements, and Vo and V represent the tumor volumes at two points of measurement.
Statistical Analysis
Fisher’s exact test was performed for the variables of morphologic findings. Multivariate analyses such as a multiple logistic regression analysis were also performed.
Tumor volume doubling times were compared using the Mann-Whitney U test. In all tests, a value of p < 0.05 was considered significant. Data analyses were performed with commercially available software (PASW Statistics, release 17.0.2; SPSS, Chicago, IL, USA).
RESULTS
Symptoms and Endoscopy
Eleven GS patients and forty-one GIST patients were first found by either an endoscopy or CT scan without any symptoms or signs. Two GS patients presented with
abdominal pain, two patients with dyspepsia, and one patient with nausea. Seven GIST patients presented with dyspepsia, six patients with abdominal pain, one with nausea, and the other patient with bleeding. Sixteen GS patients and 50 GIST patients underwent endoscopy, and the endoscopic findings of 14 GSs and 40 GISTs suggested a submucosal tumor. Fourteen GS patients and 29 GIST patients underwent biopsy, but only two GISTs were diagnosed by way of an endoscopic biopsy.
Fig. 1. Gastrointestinal stromal tumors in gastric upper body of 57-year-old man. Transverse CT scan shows well-defined, round mass with heterogeneously moderate enhancement (arrow) in gastric upper body. Tumor reveals endoluminal growth pattern. There is no intralesional low attenuation area, calcification, or surface dimpling.
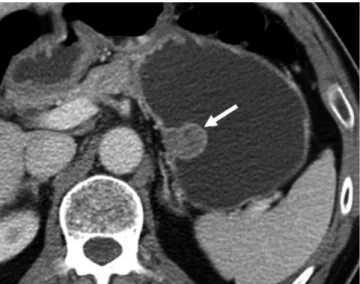
Fig. 2. Gastric schwannomas in gastric midbody of 62-year- old woman. Transverse CT scan shows well-defined round mass with homogeneously moderate enhancement (arrow) in gastric midbody.
Tumor reveals exophytic growth pattern. There is no intralesional low attenuation area, calcification, or surface dimpling.
CT Findings
The imaging features for all patients are summarized in Table 1. The tumor sizes of the GSs and GISTs ranged in longest diameter from 1.0 to 5.0 cm (mean, 3.2 cm) and 1.6 to 5.0 cm (mean, 3.6 cm), respectively. The difference between tumor contour, surface, enhancement degree of the GS and GIST was not statistically significant (each p >
0.05). In addition, the presence or absence of hemorrhage, calcification, surface dimpling, fistula, other solid organ invasion, metastasis, ascites, and peritoneal seeding was not different (each p > 0.05). An endoluminal growth pattern of GIST was seen in 17 patients (30.4%, 17/56) but
not in GS patients (Fig. 1). An exophytic or mixed growth pattern was seen in all GS patients (100%, 16/16) (Figs.
2, 3), and 39 GIST patients (69.7%, 39/56, p = 0.016). GS showed homogenous enhancement more frequently (93.8%, 15/16; vs. 51.8%, 29/56, p = 0.003) (Figs. 2-4), but an intralesional low attenuation area was more common in GISTs (30.4%, 17/56) than GS (6.3%, 1/16, p = 0.024) (Fig. 5). Perilesional lymph nodes are more frequently seen in GSs than GISTs (81.3%, 13/16; vs. 28.6%, 16/56, p <
0.001) (Fig. 6C). In multivariate analyses, a homogeneous enhancement pattern, exophytic or mixed growth pattern, and perilesional lymph nodes were statistically significant (p
< 0.05) (Table 1).
Doubling Times
The mean interval between the initial CT scan and last follow-up CT scan of GS was 681.5 days (range, 72-1805 days), while the mean interval of GISTs was 398 days (range, 83-1651 days). The mean volumes of initial GS and last follow-up GS were 6,581 mm3 (range, 3250-11235 mm3) and 8791 mm3 (range, 5720-11720 mm3), respectively.
The mean volumes of initial GISTs and last follow-up GISTs were 6582 mm3 (range, 1120-21650 mm3) and 12488 mm3 (range, 5555-31400 mm3), respectively. Mean tumor volume doubling times of GSs and GISTs were 1685.4 days (range, 1124.6-2762.5 days) and 377.6 days (range, 89.0-715.1 days), respectively (Figs. 6, 7). Tumor volume doubling times for GSs were significantly longer than those of GISTs (p
= 0.004).
Fig. 3. Gastric schwannomas in gastric lower body of 63-year- old woman. Transverse CT scan shows well-defined, round mass with homogeneously moderate enhancement (arrow) in gastric lower body.
Tumor reveals mixed (endoluminal and exophytic) growth pattern.
There is no intralesional low attenuation area, calcification, or surface dimpling.
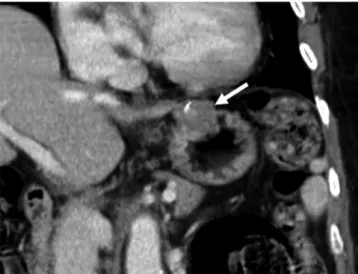
Fig. 4. GIST in gastric cardia of 72-year-old woman. Coronal CT scan shows irregular-surfaced round mass with heterogeneously moderate enhancement (arrow) in gastric lower body. Tumor reveals mixed (endoluminal and exophytic) growth pattern and intratumoral calcification. There is no intralesional low attenuation area or surface dimpling.
Fig. 5. GIST in gastric lower body of 58-year-old woman.
Transverse CT scan shows well-defined round mass with moderate enhancement (arrow) in the gastric midbody. Mass reveals mixed (endoluminal and exophytic) growth pattern and central intralesional low attenuation area (i.e., necrosis).
DISCUSSION
Small gastric submucosal tumors were found at a higher incidence in the East than the West (7, 8, 15, 16). Upper GI roentgenography and endoscopy are frequently used to identify early gastric cancer, one of the most common cancers in the East (17), and small submucosal tumors are often found incidentally. The most common submucosal tumor is the GIST. Standard treatment for localized
resectable GIST is surgery, because every GIST is considered to potentially be malignant (18-21). Many small submucosal tumors are surgically resected because it is difficult to differentiate between GISTs and non-GIST submucosal tumors. GISTs smaller than 5 cm have a lower risk of tumor progression (22, 23), and thus small submucosal tumors in
the stomach may require follow up CT with imaging instead of immediate surgery. In fact, most GISTs smaller than 5 cm show less than five mitotic counts per 50 high power fields, thus have a very low risk of tumor progression (23, 24).
Some previous reports analyzed the size criteria, defined smaller than 5 cm submucosal tumor as small submucosal tumors (8, 15, 16). We therefore compared small submucosal tumors < 5 cm in the stomach.
The differential diagnosis of small submucosal tumors includes polypoid tumors arising in the gastric wall.
Polypoid adenocarcinomas of the stomach may extend beyond the gastric wall and can mimic mesenchymal tumors, particularly on CT. The margins of an adenocarcinoma on CT are spiculated rather than smooth, and they are commonly associated with regional adenopathy. Lymphomas of the
A B C
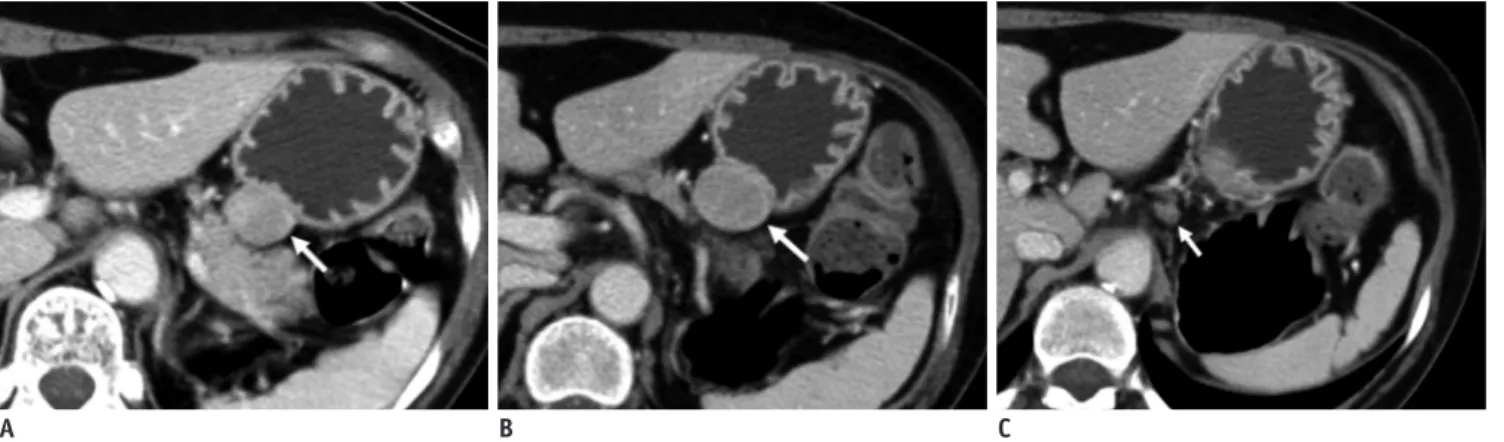
Fig. 6. Gastric schwannomas in gastric upper body of 65-year-old woman.
A. Transverse CT scan shows well-defined round mass with homogeneous enhancement (arrow) in gastric upper body. Tumor volume is 4200 mm3. B. Transverse follow-up CT scan obtained 24 months after initial CT scan shows 5720 mm3 tumor volume. This tumor (arrow) has 1673-day tumor volume doubling time. C. Transverse CT scan shows perilesional lymph node (arrow).
A B
Fig. 7. Gastrointestinal stromal tumors in gastric upper body of 81-year-old woman.
A. Coronal CT scan shows well-defined lobulated mass with heterogeneous enhancement (arrow) in gastric upper body. Tumor volume is 1610 mm3. B. Coronal follow-up CT scan obtained 12 months after initial CT scan shows 12035 mm3 tumor volume of. This tumor (arrow) has 127-day tumor volume doubling time.
stomach sometimes have CT features similar to mesenchymal tumors. Adenopathy is a helpful distinguishing feature for lymphoma because homogeneous lymph nodes are usually accompanied in the mesenteries and retroperitoneum.
Moreover, both adenocarcinomas and lymphomas in the gastric wall are easily diagnosed by endoscopic findings and biopsy.
An ectopic pancreas of the stomach can also mimic a GIST. CT findings show prominent enhancement of the overlying mucosa, location, longest diameter/shortest diameter ratio, growth pattern, and lesion border as significant predictors in the differentiation of an ectopic
pancreas from a GIST and leiomyoma (9). A carcinoid tumor is a mesenchymal tumor found in the gastric wall. Carcinoid tumors usually present as multiple hyperemic nodules with unique biologic behavior (25). A gastric glomus tumor shows hypervascular submucosal tumors in the fourth layer on power Doppler imaging (26). The CT findings of a gastric glomus tumor shows characteristic features of peripheral nodular or homogeneous strong enhancement in the arterial phase and prolonged enhancement in the delayed phase (10). Other submucosal tumors in the stomach including leiomyomas are very rare. We are interested in differentiating GSs from GISTs because a GS is not rare and Table 1. CT Findings of Gastric Schwannomas and Gastrointestinal Stromal Tumors
CT Finding Schwannomas (n = 16) GISTs (n = 56)
P* P†
% n % n
Contour N.S.
Round 68.8 11 53.6 30
Lobulated 31.3 5 46.4 26
Surface N.S.
Regular 100.0 16 89.3 50
Irregular 0.0 0 10.7 6
Growth pattern 0.016 0.009
Endoluminal 0.0 0 30.4 17
Exophytic or mixed 100.0 16 69.6 39
Enhancement pattern 0.003 0.001
Homogeneous 93.8 15 51.8 29
Heterogeneous 6.3 1 48.2 27
Enhancement degree N.S.
Good 25.0 4 26.8 15
Moderate or poor 75.0 12 73.2 41
Intralesional low attenuation 6.3 1 30.4 17 0.024 0.298
Hemorrhage 0.0 0 1.8 1 N.S.
Calcification 6.3 1 7.1 4 N.S.
Surface dimple 6.3 1 14.3 8 N.S.
Margin N.S.
Well defined 100.0 16 100.0 56
Ill defined 0.0 0 0.0 0
Fistula 0.0 0 0.0 0 N.S.
Perilesional LNs 81.3 13 28.6 16 < 0.001 0.004
Other organ invasion 0.0 0 0.0 0 N.S.
Metastasis 0.0 0 0.0 0 N.S.
Ascites 0.0 0 0.0 0 N.S.
Peritoneal seeding 0.0 0 0.0 0 N.S.
Note.— *p values using Fisher’s exact test (p > 0.05), †Multivariate analyses used was multiple logistic regression analysis using variables with p < 0.05 in univariate analysis. GISTs = gastrointestinal stromal tumors, LNs = lymph nodes, N.S. = not significant
is difficult to differentiate from a GIST.
GSs derive from Schwann cells of the nerve sheath of Auerbach’s plexus within the gastrointestinal tract wall because of their immunophenotypic similarities (27).
GSs show distinctive histologic features that separate them from conventional Schwannomas outside the bowel.
Histologically, GSs are S-100 protein-positive spindle cell tumors with a microtrabecular pattern, peripheral lymphoid cuffing, and occasional germinal centers (27, 28).
Some reports suggested that endoscopic ultrasound (EUS) could help in accurately diagnosing gastric submucosal tumors (3-5). Jung et al. (5) reported that GSs can be differentiated from GISTs by the presence of a marginal halo and homogeneous hypoechoic features. Okai et al.
(3) described that marginal halos on EUS are frequently detected in GISTs and GSs but not in true leiomyomas because the tumor tissue and surrounding muscle proper layer have the same echogenicity. However, these reports were not formal comparative studies (3-5). Recently, some studies (29, 30) have shown the diagnostic value of EUS-guided biopsy, which has not been widely used as the standard in clinical practice, and it is invasive and dependent on operator’s skill for an accurate diagnosis.
CT is the most commonly used noninvasive modality for gastric tumors. Only a few reports describe CT findings in GSs, which actually show similar findings to GISTs (4- 6). The characteristic CT features of Schwannomas in various anatomic locations have been described as well- circumscribed masses with a variable degree of internal cystic change and heterogeneous contrast enhancement (31-33). According to two recent reports (4, 6), GSs showed homogeneous attenuation, and it was due to lack of hemorrhage, intralesional low attenuation area, and degeneration within the tumors. Homogeneous attenuation may occur because of small tumor size. Similarly, small GSs in our series showed well-defined, homogeneous attenuation without hemorrhage, intralesional low attenuation area, or cystic degeneration.
In the univariate analyses, the CT features of GSs such as growth pattern (exophytic or mixed), homogeneous attenuation, absence of intralesional low attenuation area and perilesional lymph nodes are significantly different from those of GISTs. A few endoluminal GSs were observed in a previous report (6), but other reports (4, 8) showed results in agreement with our series. Homogeneous attenuation and absence of intralesional low attenuation area also corresponded with previous reports (4, 6, 34). GISTs with
relatively faster growth rate can show an intralesional low attenuation area (i.e., necrosis). Perilesional lymph nodes were little described in previous reports in GSs or GISTs. Although its meaning is not clear, we presume the perilesional lymph nodes are the reactive inflammatory lymph node. In our study, the perilesional lymph nodes are much more frequently seen in GSs than GISTs, which corresponds to the fact that GSs include many inflammatory cells in the tumor (35). For the multivariate analyses, growth pattern (exophytic or mixed), homogeneous attenuation and the presence of perilesional lymph nodes were also significant, except for the absence of intralesional low attenuation area.
The mean tumor volume doubling time of GSs (1685.4 days) and GISTs (377.6 days) was significantly different.
Furthermore, the longest tumor volume doubling time of GIST is 715 days and the shortest tumor volume doubling time of GS is 1125 days. It is associated with malignant potential of GISTs. If characteristic GS features are seen in small submucosal tumors, follow-up CT scans could be considered as they will provide an estimate of tumor volume doubling time, which may be helpful to further differentiate GSs from GISTs.
Our study has several limitations. First, a retrospective study using data gathered over a period of years in a hospital inevitably suffers from selection bias. We excluded patients who underwent a standard abdominal CT scan or CT scans that were performed at other institute without using the stomach CT protocol used at our institute to avoid various contrast agent injection rates and variability of gastric distension. For these reasons, nine GISTs and four GSs were excluded in our study during the same study period. Second, we excluded large GSs and GISTs greater than 5 cm in diameter. Gastric submucosal tumors are usually detected as small tumors with the more frequent use of endoscopy and CT. Large submucosal tumors are more likely to be malignant and often have symptoms; thus, differentiation of small submucosal tumors is clinically more important. Finally, a small number of patients with follow- up CT scans was included in the assessment of growth rates.
This leads to a low confidence in tumor volume doubling time, and as a result, we could not establish either proper follow up intervals for imaging or the criterion for differentiating between GISTs and GSs using tumor volume doubling times. Small tumors make volume measurements more difficult. We estimated tumor volume directly using an area measuring tool and the summation-of-area technique.
In conclusion, although small GSs and GISTs showed similar imaging findings, GSs more frequently show a exophytic or mixed growth pattern, homogeneous enhancement pattern, perilesional lymph nodes, and grows slower than GISTs. Knowledge of these characteristic CT findings may help prevent unnecessary surgery and improve planning for minimally invasive surgery, particularly in co- morbid conditions or for older patients.
REFERENCES
1. Day DD, Jass JR, Price AB, Shepherd NA, Sloan JM, Talbot IC, et al. Morson & dawson’s gastrointestinal pathology.
Massachusetts: Blackwell Science Ltd., 2003
2. Nishida T, Hirota S. Biological and clinical review of stromal tumors in the gastrointestinal tract. Histol Histopathol 2000;15:1293-1301
3. Okai T, Minamoto T, Ohtsubo K, Minato H, Kurumaya H, Oda Y, et al. Endosonographic evaluation of c-kit-positive gastrointestinal stromal tumor. Abdom Imaging 2003;28:301- 307
4. Hong HS, Ha HK, Won HJ, Byun JH, Shin YM, Kim AY, et al.
Gastric schwannomas: radiological features with endoscopic and pathological correlation. Clin Radiol 2008;63:536-542 5. Jung MK, Jeon SW, Cho CM, Tak WY, Kweon YO, Kim SK, et
al. Gastric schwannomas: endosonographic characteristics.
Abdom Imaging 2008;33:388-390
6. Levy AD, Quiles AM, Miettinen M, Sobin LH. Gastrointestinal schwannomas: CT features with clinicopathologic correlation.
AJR Am J Roentgenol 2005;184:797-802
7. Levy AD, Remotti HE, Thompson WM, Sobin LH, Miettinen M. Gastrointestinal stromal tumors: radiologic features with pathologic correlation. Radiographics 2003;23:283-304, 456;
quiz 532
8. Ghanem N, Altehoefer C, Furtwängler A, Winterer J, Schäfer O, Springer O, et al. Computed tomography in gastrointestinal stromal tumors. Eur Radiol 2003;13:1669-1678
9. Kim JY, Lee JM, Kim KW, Park HS, Choi JY, Kim SH, et al.
Ectopic pancreas: CT findings with emphasis on differentiation from small gastrointestinal stromal tumor and leiomyoma.
Radiology 2009;252:92-100
10. Kim JK, Won JH, Cho YK, Kim MW, Joo HJ, Suh JH. Glomus tumor of the stomach: CT findings. Abdom Imaging 2001;26:303-305
11. Kang JH, Lim JS, Kim JH, Hyung WJ, Chung YE, Choi JY, et al.
Role of EUS and MDCT in the diagnosis of gastric submucosal tumors according to the revised pathologic concept of gastrointestinal stromal tumors. Eur Radiol 2009;19:924-934 12. Kim HC, Lee JM, Choi SH, Han H, Kim SS, Lee SH, et al. Cystic
changes in intraabdominal extrahepatic metastases from gastrointestinal stromal tumors treated with imatinib. Korean J Radiol 2004;5:157-163
13. Breiman RS, Beck JW, Korobkin M, Glenny R, Akwari OE,
Heaston DK, et al. Volume determinations using computed tomography. AJR Am J Roentgenol 1982;138:329-333 14. Schwartz M. A biomathematical approach to clinical tumor
growth. Cancer 1961;14:1272-1294
15. Tateishi U, Hasegawa T, Satake M, Moriyama N.
Gastrointestinal stromal tumor. Correlation of computed tomography findings with tumor grade and mortality. J Comput Assist Tomogr 2003;27:792-798
16. Kim HC, Lee JM, Kim KW, Park SH, Kim SH, Lee JY, et al. Gastrointestinal stromal tumors of the stomach: CT findings and prediction of malignancy. AJR Am J Roentgenol 2004;183:893-898
17. Bertuccio P, Chatenoud L, Levi F, Praud D, Ferlay J, Negri E, et al. Recent patterns in gastric cancer: a global overview. Int J Cancer 2009;125:666-673
18. Trupiano JK, Stewart RE, Misick C, Appelman HD, Goldblum JR. Gastric stromal tumors: a clinicopathologic study of 77 cases with correlation of features with nonaggressive and aggressive clinical behaviors. Am J Surg Pathol 2002;26:705- 714
19. Fletcher CD, Berman JJ, Corless C, Gorstein F, Lasota J, Longley BJ, et al. Diagnosis of gastrointestinal stromal tumors: a consensus approach. Hum Pathol 2002;33:459-465 20. Miettinen M, El-Rifai W, H L Sobin L, Lasota J. Evaluation of malignancy and prognosis of gastrointestinal stromal tumors:
a review. Hum Pathol 2002;33:478-483
21. Blay JY, Bonvalot S, Casali P, Choi H, Debiec-Richter M, Dei Tos AP, et al. Consensus meeting for the management of gastrointestinal stromal tumors. Report of the GIST Consensus Conference of 20-21 March 2004, under the auspices of ESMO.
Ann Oncol 2005;16:566-578
22. Franquemont DW. Differentiation and risk assessment of gastrointestinal stromal tumors. Am J Clin Pathol 1995;103:41-47
23. Hornick JL, Fletcher CD. The role of KIT in the management of patients with gastrointestinal stromal tumors. Hum Pathol 2007;38:679-687
24. Keun Park C, Lee EJ, Kim M, Lim HY, Choi DI, Noh JH, et al. Prognostic stratification of high-risk gastrointestinal stromal tumors in the era of targeted therapy. Ann Surg 2008;247:1011-1018
25. Binstock AJ, Johnson CD, Stephens DH, Lloyd RV, Fletcher JG.
Carcinoid tumors of the stomach: a clinical and radiographic study. AJR Am J Roentgenol 2001;176:947-951
26. Yan SL, Yeh YH, Chen CH, Yang CC, Kuo CL, Wu HS. Gastric glomus tumor: a hypervascular submucosal tumor on power Doppler endosonography. J Clin Ultrasound 2007;35:164-168 27. Daimaru Y, Kido H, Hashimoto H, Enjoji M. Benign
schwannoma of the gastrointestinal tract: a clinicopathologic and immunohistochemical study. Hum Pathol 1988;19:257- 264
28. Sarlomo-Rikala M, Miettinen M. Gastric schwannoma--a clinicopathological analysis of six cases. Histopathology 1995;27:355-360
29. Akahoshi K, Sumida Y, Matsui N, Oya M, Akinaga R, Kubokawa
M, et al. Preoperative diagnosis of gastrointestinal stromal tumor by endoscopic ultrasound-guided fine needle aspiration.
World J Gastroenterol 2007;13:2077-2082
30. Ando N, Goto H, Niwa Y, Hirooka Y, Ohmiya N, Nagasaka T, et al. The diagnosis of GI stromal tumors with EUS-guided fine needle aspiration with immunohistochemical analysis.
Gastrointest Endosc 2002;55:37-43
31. Kumar AJ, Kuhajda FP, Martinez CR, Fishman EK, Jezic DV, Siegelman SS. Computed tomography of extracranial nerve sheath tumors with pathological correlation. J Comput Assist Tomogr 1983;7:857-865
32. Cohen LM, Schwartz AM, Rockoff SD. Benign schwannomas:
pathologic basis for CT inhomogeneities. AJR Am J Roentgenol
1986;147:141-143
33. Rha SE, Byun JY, Jung SE, Chun HJ, Lee HG, Lee JM.
Neurogenic tumors in the abdomen: tumor types and imaging characteristics. Radiographics 2003;23:29-43
34. Kwon MS, Lee SS, Ahn GH. Schwannomas of the
gastrointestinal tract: clinicopathological features of 12 cases including a case of esophageal tumor compared with those of gastrointestinal stromal tumors and leiomyomas of the gastrointestinal tract. Pathol Res Pract 2002;198:605-613 35. Prévot S, Bienvenu L, Vaillant JC, de Saint-Maur PP. Benign
schwannoma of the digestive tract: a clinicopathologic and immunohistochemical study of five cases, including a case of esophageal tumor. Am J Surg Pathol 1999;23:431-436