http://e-nrp.org
Impact of fish consumption by subjects with prediabetes on the metabolic risk factors: using data in the 2015 (6th) Korea National Health and Nutrition Examination Surveys
Kyoung-yun Kim
1*§and Jeong Seop Park
2*1Department of Food and Nutrition, Chonnam National University, 77, Yongbong-ro, Buk-gu, Gwangju 61186, Korea
2Department of Food Service and Culinary Management, Kyonggi University, Seoul 03746, Korea
BACKGROUND/OBJECTIVES: The effects of fish consumption by subjects with prediabetes on the metabolic risk factors were
examined based on the data from the 6
thKorea National Health and Nutrition Examination Surveys in 2015.
SUBJECTS/METHODS: A total of 1,520 subjects who agreed to participate in a blood test and dietary intake survey were divided
into a prediabetes group and normal blood glucose group, and the level of the subjects’ fish consumption was divided into
≤ 17.0 g/day, 18.0-93.0 g/day, and ≥ 94 g/day. The correlation between the level of fish intake and the metabolic risk factors was evaluated by multinomial logistic regression analysis.
RESULTS: A significant difference in the gender distribution was observed in the prediabetes group, which is a group with
a high risk of non-communicable diseases, according to the fish intake, and there were significant differences in the total energy intake, protein intake, n-3 fatty acids intake, and the intakes of sodium and micro-nutrients according to the intake group (P < 0.05). In addition, the blood total cholesterol (TC) decreased 0.422 fold in model 1 (unadjusted) [95% confidence interval (CI): 0.211-0.845] and 0.422 fold in model 2 (adjusted for sex) (95% CI: 0.210-0.846) in those with a fish intake of 18.0-93.0 g/day (P < 0.05) compared to those with a fish intake of ≤ 17.0 g/day. The blood TC decreased 0.555 fold (95%
CI: 0.311-0.989) in model 1 and 0.549 fold (95% CI: 0.302-0.997) in model 2 in those with a fish intake of ≥ 94 g/day compared to those with a fish intake of ≤ 17.0 g/day (P < 0.05).
CONCLUSION: Subjects with prediabetes or the metabolic risk factors can maintain their blood low density lipoprotein cholesterol
(LDL-C) and blood TC concentrations at the optimal level by consuming fish (18.0-93.0 g/day).
Nutrition Research and Practice 2018;12(3):233-242; https://doi.org/10.4162/nrp.2018.12.3.233; pISSN 1976-1457 eISSN 2005-6168 Keywords: Food intake, low density lipoprotein cholesterol, prediabetic state, Korea
INTRODUCTION
*The International Diabetes Federation (IDF) noted that metabolic syndrome is the complex occurrence of symptoms, such as increases in blood pressure and abdominal fat and disorders of the lipid metabolism and carbohydrate metabolism [1].
Metabolic syndrome is a cause of non-communicable diseases (NCDs) [2], such as type-2 diabetes mellitus (T2DM) and cardio- vascular disease (CVD), which is an important embryological cause of abnormal control of the lipid metabolism [3] and insulin resistance [4]. The incidence of metabolic syndrome differs among nations or races according to the socio-cultural background and economic level, but the global prevalence of metabolic syndrome was 20-25% in 2006. [5], and it has been showing an increasing trend, similar to the prevalence of T2DM, CVD, obesity, and hypertension [6]. A survey of the prevalence of metabolic syndrome of 5,670 South Koreans over 20 year
utilizing the 2010 Korea National Health and Nutrition Exami- nation Surveys, revealed an incidence of 18.8%, and an increasing prevalence in children and adolescents since 2009. The incidence was reported to be 2.0-2.5% when the IDF diagnosis standards were applied, while the prevalence in the obesity group was approximately 20-25%, which is 10 times higher than that of healthy persons [7]. For the control of metabolic syndrome, it is important to maintain the constitutive biochemical factors, waist circumference (WC), triglyceride (TG), blood pressure (BP), low density lipoprotein cholesterol (LDL-C), total cholesterol (TC), and high-density lipoprotein cholesterol (HDL-C) within the normal range and to manage the lifestyle, to reduce the prevalence of NCDs. The increasing social burden for the treatment of the diseases with an increasing prevalence has increased the interest in the impact of dietary intake on the prevention of the diseases, and studies of the correlation between NCDs and the Mediterranean diet [8-10] are being
§Corresponding Author: Kyoung Yun Kim, Tel. 82-62-466-1960, Fax. 82-62-466-1969, Email. [email protected] Received: January 25, 2018, Revised: April 10, 2018, Accepted: April 11, 2018
* The two authors contributed to this work equally.
This is an Open Access article distributed under the terms of the Creative Commons Attribution Non-Commercial License (http://creativecommons.org/licenses/by-nc/3.0/) which permits unrestricted non-commercial use, distribution, and reproduction in any medium, provided the original work is properly cited.
conducted consistently. Such a healthy diet is characterized by the intake of vegetables, fruits, seaweed, fish, whole-grain, and olive oil; the intakes of the right amount of dairy products and nuts; and less intake of processed meat products. Moreover, the intake of bio-active substances and anti-oxidants, such as vitamins and minerals contained in a variety of diets, act as the factors of anti-inflammation and satiety, and they have been reported to lower the blood pressure and, alter the Cecal microflora [11,12]. Moreover, by improving insulin resistance [13], they reduce the risks of cardiometabolic diseases, such as T2DM and CVD [14,15]. The correct dietary intake was reported to improve the blood lipid level in the hypertension risk group and subjects with hypertension as well as healthy subjects [16].
This study conducted a dietary intake survey and a hematological index survey using the data from the Korea National Health and Nutrition Examination Surveys to analyze the metabolic advantage obtained from the consumption of fish, the main source of omega-3 unsaturated fatty acid [17,18], of which the intake is recommended for a high-risk group of NCDs, and subjects with prediabetes as a food constituting the Mediter- ranean diet. Regarding the concern that fish may have a negative effect on health because it contains mercury, polychlorinated biphenyls (PCBs) and dioxin component, a study by the American Medical Association in the Journal of the American Medical Association in 2006 explained that the intake is not worrying and that the appropriate fish intake has a beneficial effect on health, even though it is necessary to control the intake and to restrict the intake type in a specific population [19]. Therefore, an accurate study of the proper intake level and intake method, considering the conflict in the impact of fish consumption on health and the concerns about the intake, is needed. In addition, because the ratio of risk of NCDs increases in subjects with prediabetes as well as in healthy persons, it is essential to conduct a study that can make suggestions for various subjects including those with prediabetes. This study would examine the impact of fish consumption on the hema- tological metabolic risk factors in subjects with prediabetes, who show an impaired fasting glucose (IFG) and are at a high risk of diabetes, based on the data in the 2015 (6th) Korea National Health and Nutrition Examination Surveys.
SUBJECTS AND METHODS
Study subjectsThis study utilized the data in the 2015 (6th) Korea National Health and Nutrition Examination Surveys to analyze the impact of the subjects’ fish consumption on the metabolic risk factors according to the criteria for blood glucose and was conducted with approval from Kyonggi University Institute Review Board (IRB KGU-20170414-HR-013). The Korea National Health and Nutrition Examination Surveys conducted by the Ministry of Health-Welfare and Korea Centers for Disease Control and Prevention were carried out on the population using the rolling sampling survey method, which belongs to a cross-sectional study. In the surveys conducted from January to December in 2015, a blood test was performed for an analysis of the metabolic risk factors. The fish consumption of 3,455 persons over 30 and under 65, who participated in all the dietary intake
surveys, was conducted. A total of 1,935 subjects, who were judged to affect the results of the study, including chronic patients, those taking blood glucose medication, those taking blood pressure medication, those under hormone therapy, those taking medication to control obesity, those taking diet calories under 500 kcal and over 5,000 kcal, pregnant women, and lactating women, were excluded. Thus, 1,520 persons were selected as subjects, including those who did not have any missing data in the main variables of this study, including fish consumption, body mass index (BMI), and metabolic index and who responded that the dietary intake was similar to that in ordinary times in a dietary intake survey through the 24-h recall method. The Korea National Health and Nutrition Examination Surveys were conducted with all the people as subjects, and the food intake level can be understood through the data. The impact of the food intake level on the subjects’ metabolic risk factors was examined by classifying and analyzing the subjects into a normal blood glucose group and a prediabetes group.
Based on this, the data was utilized as the basic data to present guidelines for the pure food intake level according to the glucose level. In addition, the proper recommended amount of fish consumption should be determined for subjects who need to control their blood glucose according to the glucose level by analyzing the impact of fish consumption on the metabolic risk factors. For this purpose, according to the basic criteria defined by the American Diabetes Association, this study classified 1,520 subjects into a normal blood glucose group (n
= 1,229), subjects with a fasting blood glucose (FBG) under 100 mg/dL and a prediabetes group (n = 291), and subjects with FBG over 100 mg/dL and under 126 mg/dL, showing IFG [20].
Measurement of the general and clinical characteristics
To analyze the general and clinical characteristics of the subjects of this study, the data from the 2015 (6th) Korea National Health and Nutrition Examination Surveys were used.
The survey of the subjects’ health in the Korea National Health and Nutrition Examination Surveys included housing, education level, economic level, history of diseases, drinking, smoking, and degree of physical activity, and anthropometry was conducted to measure the weight, height, and WC. The anthropometry and BP measurements were carried out by an examiner who completed two to four weeks of education and training using the standard survey method of Korea National Health and Nutrition Examination. The height and weight of the subjects were measured, while they were putting on a gown for a checkup. The weight and height were measured to 0.1 kg and 0.1 cm, respectively, to calculate the BMI. The WC was measured up to 0.1 cm from the final subcostal line to the upper iliac crest under a natural condition. For accurate BP measurements, after a break for five minutes before the measurements, the cuff suitable for the measurement of the arm circumference was chosen, and it was measured using a mercury manometer.
To examine the FBG, after maintaining the minimum 8-h fasting
state, the blood was collected by venipuncture and kept under
refrigerated conditions to conduct the analysis. FBG, TG, HDL-C,
LDL-C, and TC were analyzed by the enzyme method using a
Hitachi automatic analyzer 7600-210 (Tokyo, Japan), and glycated
hemoglobin (HbA1c) was measured by high-performance liquid
chromatography using a Tosoh G8 (Tokyo, Japan). Glutamic oxalacetic transaminase (GOT) and glutamic oxalacetic transa- minase (GPT) were analyzed by the enzyme method on a Hitachi automatic analyzer 7600-210 (Hitachi, Tokyo, Japan). The white blood cell (WBC), red blood cell (RBC), and hemoglobin were measured using XN-9000 (Sysmex, Kobe, Japan), whereas the high sensitivity C-reactive protein (hs-CRP) was analyzed with a nephelometric immunoassay, using Cobas (Roche, Berlin, Germany). The blood urea nitrogen (BUN) was analyzed using the kinetic UV assay method on a Hitachi automatic analyzer 7600-210 (Tokyo, Japan).
Measurement of dietary intake
For a survey on the dietary intake of the subjects, this study utilized the nutrient intake data obtained from the 2015 (6th) Korea National Health and Nutrition Examination Surveys. The dietary intake survey was conducted in a way in that people with an education completed at a regular training (7 times a year) directly conducted interviews with the subjects, and they recorded the foods taken for 24 h. This study conducted a survey on the information about the meals, foods, and items consumed for 24 h before the survey and told them that this was a survey on the intake, which would reflect the subjects’
dietary life level in ordinary times. To assess the subjects’ fish consumption level, this study examined the levels of intake of mackerel, pollack, hairtail, croaker, Pacific saury, sole, cod, snapper, Atka mackerel, eel, sand eels, anglerfish, Pomfret, halibut, cero, tuna, anchovy, loach, and squid, which are consumed widely domestically. To analyze the data on the types and amounts of foods, the energy and nutrient intakes from the types and amounts of food intakes obtained through the dietary intake survey, the DB of ingredients by food, and the DB of nutrients by foods DB in Rural Development Administration were utilized, and the total energy intake (kcal) and the intake of carbohydrate (g), protein (g), n-3 fatty acids (FAs) (g), n-6 FAs (g), monoun- saturated fatty acids (MUFAs) (g), polyunsaturated fatty acids (PUFAs) (g), vitamin A (μgRE), carotene (μg), retinol (μg), sodium (mg), thiamin (mg), niacin (mg), calcium (mg), and phosphorus (mg) were calculated.
Statistical analysis
The design of the 2015 (6th) Korea National Health and Nutrition Examination Surveys was extracted, by two-stage stratified cluster sampling, and the standard plots and weights were used so that the data used in this study would represent Korean people using the data analysis method of complex sampling in the analysis. The analysis was conducted, using SPSS 18.0 (IBS SPSS Statistics, Armonk, NY, USA). Data for the descriptive statistics of the variables are indicated as mean ±
standard deviation (SD). A general linear model was utilized to analyze the general and clinical characteristics of the subjects according to their fish consumption level, and a chi-square test was utilized for an analysis of the qualitative variables. The major variable of this study, the fish intake level, was divided into tertiles, ≤ 17.0 g/day, 18.0-93.0 g/day, and ≥ 94 g/day, referring to the consumption level in the preceding studies [21, 22] that investigated the distribution of all subjects and the correlation between metabolic syndrome and the food intake
to analyze the correlation with the disease. Multiple logistic regression was conducted to determine the impact of the fish intake in the prediabetes group and the normal blood glucose group on the odds ratio (OR value) of metabolic risk factors and 95% confidence interval (CI). To assess the accurate correlation between the intake and metabolic risk factors, by adjusting the confounding factors that may affect the analysis, model 1 was set to a group without adjustment; model 2, to a group that was age adjusted. A P-value < 0.05 was considered significant.
RESULTS
General and clinical characteristics according to the sex
Tables 1 and 2 lists the general and clinical characteristics according to the sex of the prediabetes group and the normal blood glucose group. In the prediabetes group consisting of 291 persons, 147 were male, and 144 were female. The average age of the men and women was 51 and 53 years, respectively.
The average age of the female subjects was significantly higher (P < 0.05). A significant difference in alcohol intake according to sex was observed between the prediabetes group and the normal blood glucose group (P < 0.05). A significant gender difference in the physical activity level of the normal blood glucose group was also noted. Regarding the fish intake level of the subjects, the height, weight, WC, BMI, DBP, TG, hemoglobin, hematocrit, BUN, blood creatinine, WBC, and RBC level were significantly higher in the male subjects than in the female subjects (P < 0.05). The HbA1C level was similar in both sexes (P = 0.05), and the high density lipoprotein cholesterol (HDL-C) level was significantly higher in females than in males (P = 0.012); however, the low density lipoprotein cholesterol (LDL-C) level was significantly higher in the women than in men in their 50s (P < 0.001). The male subjects in the normal blood glucose group had significantly higher height, weight, WC, BMI, BP, FBG, TG, GOT, GPT, hemoglobin, hematocrit, BUN, blood creatinine, WBC, RBC, and high-sensitivity -C-reactive protein levels than the female subjects (P < 0.05). Regarding the blood lipid pattern, the HDL-C level was significantly higher in the female subjects than the males (P < 0.001). The LDL-C level was significantly higher in men in their 30s and 40s than in women but it was significantly higher in women in their 50s.
General and clinical characteristics according to the fish consumption
Table 3 and 4 present the general and clinical characteristics
according to the fish consumption level of the prediabetes
group and normal blood glucose group. The subjects’ fish
intake level was divided into tertiles, ≤ 17.0 g/day, 18.0-93.0
g/day and ≥ 94 g/day for the analysis. The number of subjects
with prediabetes and consumed fish was 291. Of 81 subjects
in the group with a fish consumption of ≤ 17.0 g/day, 28 were
male (34.6%) and 53 were female (65.4%). Of the 84 subjects
in the group with a fish consumption of 18.0-93.0 g/day, 45
were male (53.6%) and 39 were female (46.4%). Of 126 subjects
in a group with a fish consumption ≥ 94 g/day, 74 were male
(58.7%) and 52 were female (41.3%). A significant difference in
the gender distribution was observed according to the intake
level (P = 0.003). In addition, significant differences in RBC
Total in prediabetes (n = 291) Total in normal (n = 1,229)
Male Female P-value1) Male Female P-value1)
Clinical characteristics
Height (cm) 171.0 ± 6.22) 156.9 ± 5.2 < 0.001 171.7 ± 6.3 158.6 ± 5.6 < 0.001
Weight (kg) 76.3 ± 12.0 62.3 ± 9.4 < 0.001 70.7 ± 10.0 56.7 ± 8.1 < 0.001
Waist circumference (cm) 90.9 ± 7.6 83.9 ± 8.7 < 0.001 84.6 ± 7.7 76.2 ± 7.9 < 0.001
Body mass index3) (kg/m2) 26.1 ± 3.3 25.3 ± 3.7 < 0.001 24.0 ± 2.9 22.5 ± 3.0 < 0.001
SBP (mmHg) 124.2 ± 15.2 121.7 ± 17.8 0.261 117.0 ± 13.2 111.6 ± 15.7 < 0.001
DBP (mmHg) 82.3 ± 10.1 78.0 ± 10.2 < 0.001 78.4 ± 8.6 73.4 ± 9.9 < 0.001
Fasting blood glucose (mg/dL) 108.2 ± 6.2 108.1 ± 6.3 0.948 91.1 ± 5.6 89.3 ± 5.7 < 0.001
HbA1c (%) 5.9 ± 0.2 6.0 ± 0.2 0.050* 5.3 ± 0.2 5.3 ± 0.2 0.619
Total cholesterol (mg/dL) 203.4 ± 36.3 207.4 ± 38.7 0.290 190.5 ± 31.6 192.2 ± 33.6 0.587
HDL cholesterol (mg/dL) 46.3 ± 12.6 50.7 ± 10.6 0.012* 47.9 ± 10.8 56.6 ± 12.5 < 0.001
Triglyceride (mg/dL) 207.3 ± 134.0 143.1 ± 98.2 0.001* 148.6 ± 119.2 99.4 ± 63.1 < 0.001
LDL cholesterol (mg/dL) 30s 131.7 ± 29.5 116.7 ± 34.8 0.994 117.8 ± 24.1 103.63 ± 24.2 < 0.001
LDL cholesterol (mg/dL) 40s 131.9 ± 35.8 115.9 ± 28.2 0.192 122.8 ± 32.9 113.6 ± 27.6 0.004*
LDL cholesterol (mg/dL) 50s 116.5 ± 29.6 134.7 ± 30.3 < 0.001 112.3 ± 28.4 123.1 ± 31.2 0.031*
LDL cholesterol (mg/dL) < 65s 116.7 ± 35.3 126.0 ± 39.9 0.349 111.3 ± 30.7 123.3 ± 35.5 0.058
GOT (IU/L) 28.1 ± 13.2 24.6 ± 18.0 0.880 24.2 ± 12.3 19.9 ± 6.4 < 0.001
GPT (IU/L) 33.8 ± 25.2 25.2 ± 34.1 0.209 24.9 ± 16.8 16.0 ± 8.6 < 0.001
Hemoglobin (g/dL) 15.4 ± 1.2 13.1 ± 1.3 < 0.001 15.4 ± 1.2 13.1 ± 1.1 < 0.001
Hematocrit (%) 46.0 ± 3.2 40.2 ± 3.4 < 0.001 45.8 ± 3.4 40.0 ± 3.0 < 0.001
Blood urea nitrogen (mg/dL) 15.7 ± 4.8 14.4 ± 4.2 < 0.001 15.0 ± 7.2 13.1 ± 3.8 0.069
Blood creatinine (mg/dL) 1.0 ± 0.6 0.7 ± 0.0 < 0.001 1.0 ± 0.7 0.7 ± 0.3 < 0.001
WBC (Thous/μL) 7.2 ± 2.0 6.4 ± 1.6 0.001* 6.5 ± 1.7 5.8 ± 1.5 < 0.001
RBC (Mil/μL) 5.0 ± 0.4 4.4 ± 0.3 < 0.001 4.9 ± 0.4 4.4 ± 0.3 < 0.001
hs-CRP(mg/L) 1.5 ± 2.5 1.4 ± 2.5 0.724 1.1 ± 1.9 0.9 ± 2.0 0.036*
KNHANES, Korea National Health and Nutritional Examination Survey; SBP, systolic blood pressure; DBP, diastolic blood pressure; HbA1c, glycated hemoglobin; HDL, high density lipoprotein; LDL, low density lipoprotein; GOT, glutamic oxalacetic transaminase; GPT, glutamic pyruvate transaminase; WBC, white blood cell; RBC, red blood cell;
hs-CRP, high sensitivity C-reactive protein.
All estimates were weighted and calculated taking the complex study design into account.
1)P-value was obtained from a general linear model (GLM) for continuous variables.
2)Values are expressed as the number of subjects for mean ± SD.
3)Body mass index was divided by the square of height (m2).
*P< 0.05
Table 2. Subjects’ demographic characteristics according to sex in KNHANES, 2015
Total in prediabetes (n = 291) Total in normal (n = 1,229)
Male (n = 147) Female (n = 144) P-value1) Male (n = 434) Female (n = 795) P-value1) General characteristics
Age (yrs) 51.6 ± 8.62) 53.4 ± 7.3 0.025* 46.7 ± 9.5 46.0 ± 9.4 0.749
Smoking, n (%)4)
Current smoker 59 (48.0)2) 6 (50.0)
0.978 163 (48.8) 37 (44.0)
0.895
Ex-smoker 64 (52.0) 6 (50.0) 171 (51.2) 47 (56.0)
Alcohol, n (%)4)
Never 7 (5.0) 20 (14.0)
0.041* 12 (2.8) 71 (9.1)
0.001
Yes 133 (95.0) 123 (86.0) 416 (97.2) 713 (90.9)
Physical activity, n (%)3)4)
No 74 (59.2) 73 (54.9)
0.664 173 (43.5) 384 (50.8)
0.017*
Yes 51 (40.8) 60 (45.1) 225 (56.5) 372 (49.2)
Income level, n (%)
Low 31 (21.1) 39 (27.1)
0.057
100 (23.0) 165 (20.7)
0.981 101 (23.3) 200 (25.2)
Low-intermediate 37 (25.2) 33 (22.9)
Upper-intermediate 39 (26.5) 41 (28.5) 115 (26.5) 205 (25.8)
High 40 (27.2) 31 (21.5) 118 (27.2) 225 (28.3)
All estimates were weighted and calculated taking the complex study design into account.
KNHANES: Korea National Health and Nutritional Examination Survey
1)P-value was obtained from a chi-square test for categorical variable and from the General Linear model (GLM) for continuous variables.
2)Values are expressed as the number of subjects for each category (%) or mean ± SD.
3)Physical activity was assigned “yes” if the subject practiced moderate-intensity physical activity for a week for more than 2 hours 30 minutes or practiced high-intensity physical activity for more than 1 hour and 15 minutes or practiced with moderate intensity and high-intensity physical activity (2 minutes moderate intensity for high intensity one minute)
4)The response base differs because there are cases of irrelevant responses or no responses.
*P< 0.05
Table 1. Subjects’ demographic characteristics according to sex in KNHANES, 2015
Total in prediabetes (n = 291) Total in normal (n = 1,229)
≤ 17.0 g/day
(n = 81) 18.0-93.0 g/day
(n = 84) ≥ 94 g/day
(n = 126) P-value1) ≤ 17.0 g/day
(n = 351) 18.0-93.0 g/day
(n = 393) ≥ 94 g/day
(n = 485) P-value1) Clinical characteristics
Height (cm) 162.1 ± 9.12) 165.2 ± 9.0 164.4 ± 9.0 0.068 162.3 ± 8.6 163.0 ± 8.3 164.0 ± 8.8 0.019*
Weight (kg) 66.8 ± 10.2 70.9 ± 12.4 70.0 ± 14.5 0.096 61.0 ± 10.7 61.1 ± 11.0 62.5 ± 11.4 0.095
Waist circumference (cm) 86.4 ± 8.2 88.0 ± 8.6 87.8 ± 9.5 0.468 79.2 ± 8.8 78.9 ± 8.9 79.4 ± 8.7 0.712
Body mass index3) (kg/m2) 25.4 ± 3.2 25.9 ± 3.4 25.7 ± 3.7 0.700 23.1 ± 3.1 22.9 ± 3.1 23.1 ± 3.0 0.568
SBP(mmHg) 122.0 ± 16.7 122.0 ± 16.1 124.3 ± 16.8 0.520 113.0 ± 16.0 113.7 ± 15.6 113.6 ± 14.1 0.790
DBP (mmHg) 78.5 ± 10.2 80.4 ± 9.5 81.1 ± 10.9 0.219 75.0 ± 10.2 75.6 ± 10.2 75.1 ± 9.1 0.707
Fasting blood glucose (mg/dL) 108.2 ± 5.9 108.6 ± 6.5 107.9 ± 6.3 0.730 89.6 ± 5.7 89.9 ± 5.7 90.2 ± 5.8 0.280
HbA1c (%) 6.0 ± 0.2 6.0 ± 0.2 6.0 ± 0.2 0.629 5.3 ± 0.2 5.3 ± 0.2 5.3 ± 0.2 0.327
Total cholesterol (mg/dL) 211.1 ± 37.0 198.7 ± 36.6 206.2 ± 38.1 0.099 191.2 ± 32.1 191.9 ± 33.7 191.7 ± 33.0 0.950 HDL cholesterol (mg/dL) 49.8 ± 9.9 48.13 ± 13.25 47.8 ± 12.0 0.485 52.4 ± 12.1 54.5 ± 12.4 53.4 ± 13.2 0.097 Triglyceride (mg/dL) 166.4 ± 112.8 172.1 ± 122.0 183.8 ± 127.4 0.578 117.7 ± 88.7 112.8 ± 88.4 119.3 ± 92.8 0.549 LDL cholesterol (mg/dL) 131.4 ± 30.1 121.9 ± 36.3 124.0 ± 32.5 0.146 115.9 ± 28.5 115.2 ± 30.4 114.9 ± 30.2 0.883
GOT(IU/L) 24.4 ± 10.0 26.8 ± 16.4 27.3 ± 18.2 0.418 21.4 ± 10.8 20.9 ± 7.6 21.8 ± 9.1 0.312
GPT (IU/L) 26.6 ± 24.1 29.3 ± 27.3 31.6 ± 35.2 0.501 18.3 ± 12.1 18.4 ± 11.8 20.3 ± 14.1 0.029*
Hemoglobin (g/dL) 14.1 ± 1.7 14.2 ± 1.7 14.5 ± 1.7 0.168 13.8 ± 1.6 13.9 ± 1.5 14.1 ± 1.6 0.006*
Hematocrit (%) 42.5 ± 4.4 42.9 ± 4.6 43.8 ± 4.2 0.080 41.6 ± 4.1 42.0 ± 3.9 42.5 ± 4.3 0.012*
Blood urea nitrogen (mg/dL) 15.0 ± 4.5 15.4 ± 5.5 14.8 ± 3.8 0.628 13.3 ± 4.3 13.6 ± 3.8 14.2 ± 6.9 0.039*
Blood creatinine (mg/dL) 0.8 ± 0.2 1.0 ± 0.8 0.9 ± .0.2 0.041* 0.8 ± 0.2 0.8 ± 0.4 0.8 ± 0.6 0.284
WBC (Thous/μL) 6.6 ± 1.8 7.0 ± 1.7 6.7 ± 2.0 0.489 6.0 ± 1.8 6.0 ± 1.5 6.0 ± 1.7 0.931
RBC (Mil/μL) 4.6 ± 0.4 4.7 ± 0.5 4.8 ± 0.4 0.033* 4.5 ± 0.4 4.6 ± 0.5 4.6 ± 0.5 0.102
hs-CRP (mg/L) 1.2 ± 1.5 1.2 ± 1.5 1.7 ± 3.4 0.186 1.1 ± 2.2 0.9 ± 1.7 0.9 ± 2.0 0.218
KNHANES, Korea National Health and Nutritional Examination Survey; SBP, systolic blood pressure; DBP, diastolic blood pressure; HbA1c, glycated hemoglobin; HDL, high density lipoprotein; LDL, low density lipoprotein; GOT, glutamic oxalacetic transaminase; GPT, glutamic pyruvate transaminase; WBC, white blood cell; RBC, red blood cell;
hs-CRP, high sensitivity C-reactive protein.
All estimates were weighted and calculated taking the complex study design into account.
1)P-value was obtained from general linear model (GLM) for continuous variables.
2)Values are expressed as the number of subjects for mean ± SD.
3)Body mass index was divided by the square of height (m2).
*P< 0.05
Table 4. Subjects’ clinical characteristics according to fish consumption in KNHANES, 2015
Total in prediabetes (n = 291) Total in normal (n = 1,229)
≤ 17.0 g/day
(n = 81) 18.0-93.0 g/day
(n = 84) ≥ 94 g/day
(n = 126) P-value1) ≤ 17.0 g/day
(n = 351) 18.0-93.0 g/day
(n = 393) ≥ 94 g/day
(n = 485) P-value1) General characteristics
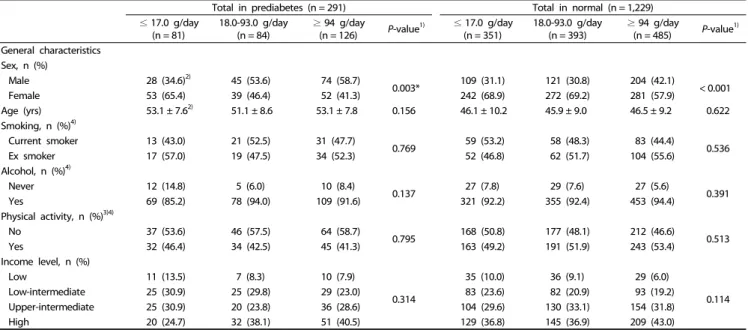
Sex, n (%)
Male 28 (34.6)2) 45 (53.6) 74 (58.7)
0.003* 109 (31.1) 121 (30.8) 204 (42.1)
< 0.001
Female 53 (65.4) 39 (46.4) 52 (41.3) 242 (68.9) 272 (69.2) 281 (57.9)
Age (yrs) 53.1 ± 7.62) 51.1 ± 8.6 53.1 ± 7.8 0.156 46.1 ± 10.2 45.9 ± 9.0 46.5 ± 9.2 0.622
Smoking, n (%)4)
Current smoker 13 (43.0) 21 (52.5) 31 (47.7)
0.769 59 (53.2) 58 (48.3) 83 (44.4)
0.536
Ex smoker 17 (57.0) 19 (47.5) 34 (52.3) 52 (46.8) 62 (51.7) 104 (55.6)
Alcohol, n (%)4)
Never 12 (14.8) 5 (6.0) 10 (8.4)
0.137 27 (7.8) 29 (7.6) 27 (5.6)
0.391
Yes 69 (85.2) 78 (94.0) 109 (91.6) 321 (92.2) 355 (92.4) 453 (94.4)
Physical activity, n (%)3)4)
No 37 (53.6) 46 (57.5) 64 (58.7)
0.795 168 (50.8) 177 (48.1) 212 (46.6)
0.513
Yes 32 (46.4) 34 (42.5) 45 (41.3) 163 (49.2) 191 (51.9) 243 (53.4)
Income level, n (%)
Low 11 (13.5) 7 (8.3) 10 (7.9)
0.314
35 (10.0) 36 (9.1) 29 (6.0)
0.114
Low-intermediate 25 (30.9) 25 (29.8) 29 (23.0) 83 (23.6) 82 (20.9) 93 (19.2)
Upper-intermediate 25 (30.9) 20 (23.8) 36 (28.6) 104 (29.6) 130 (33.1) 154 (31.8)
High 20 (24.7) 32 (38.1) 51 (40.5) 129 (36.8) 145 (36.9) 209 (43.0)
All estimates were weighted and calculated taking the complex study design into account.
KNHANES: Korea National Health and Nutritional Examination Survey
1)P-value was obtained from a chi-square test for categorical variable and from the general linear model (GLM) for continuous variables.
2)Values are expressed as the number of subjects for each category(%) or mean ± SD.
3)Physical activity was assigned “yes” if the subject practiced moderate-intensity physical activity for a week for more than 2 hours 30 minutes or the subject practiced high-intensity physical activity for more than 1 hour and 15 minutes or the subject practiced with moderate intensity and high-intensity physical activity (2 minutes moderate intensity for high intensity one minute).
4)The response base differs because there are cases of irrelevant responses or no responses.
*P< 0.05
Table 3. Subjects’ demographic characteristics according to fish consumption in KNHANES, 2015
Total in prediabetes (n = 291) Total in normal (n = 1,229)
≤ 17.0 g/day
(n = 81) 18.0-93.0 g/day
(n = 84) ≥ 94 g/day
(n = 126) P-value1) ≤ 17.0 g/day
(n = 351) 18.0-93.0g/day
(n = 393) ≥ 94 g/day
(n = 485) P-value1) Total energy intakes (kcal) 1,926.0 ± 715.42) 2,132.4 ± 738.9 2,203.0 ± 806.5 0.037* 1,979.5 ± 971.0 1,958.4 ± 761.0 2,316.5 ± 972.1 < 0.001 Carbohydrate (g) 302.6 ± 101.7 319.8 ± 108.6 327.3 ± 103.5 0.249 302.7 ± 132.7 302.5 ± 113.4 337.5 ± 125.6 < 0.001 Protein (g) 59.7 ± 28.8 70.5 ± 27.5 84.5 ± 44.4 < 0.001 61.9 ± 33.5 67.0 ± 30.3 89.0 ± 48.2 < 0.001
Fat (g) 42.5 ± 33.0 46.8 ± 26.6 44.8 ± 28.0 0.647 47.0 ± 38.9 43.1 ± 25.4 52.0 ± 37.3 0.001*
n-3 FAs (g) 1.1 ± 0.9 1.5 ± 1.0 2.3 ± 1.9 < 0.001 1.4 ± 1.6 1.6 ± 1.2 2.4 ± 2.4 < 0.001
n-6 FAs (g) 8.9 ± 8.1 9.6 ± 5.2 9.9 ± 7.0 0.566 9.7 ± 9.1 9.5 ± 7.2 11.6 ± 11.0 0.001*
MUFAs (g) 13.9 ± 12.2 15.2 ± 10.6 13.8 ± 10.4 0.625 15.0 ± 13.8 13.7 ± 9.1 16.3 ± 13.0 0.005*
PUFAs(g) 9.8 ± 8.7 11.1 ± 5.6 12.2 ± 8.0 0.095 11.0 ± 10.0 11.0 ± 8.1 14.0 ± 12.6 < 0.001
Vitamin A (μgRE) 637.3 ± 713.7 624.7 ± 466.3 891.5 ± 1,054.7 0.030* 668.7 ± 782.3 688.7 ± 638.0 940.3 ± 1,256.0 < 0.001 Carotene (μg) 3,177.4 ± 4,205.9 3,105.1 ± 2,753.6 3,931.6 ± 2,997.2 0.132 3,292.0 ± 4,320.3 3,436.4 ± 3,102.2 4,393.2 ± 6,383.4 0.002*
Retinol (μg) 67.6 ± 63.7 88.3 ± 84.1 218.1 ± 963.3 0.176 97.9 ± 293.2 102.3 ± 377.0 190.2 ± 643.7 0.006*
Sodium (mg) 3,503.5 ± 3,202.6 4,006.6 ± 2,222.1 4,553.1 ± 2,172.0 0.013* 3,554.3 ± 2,289.0 3,719.4 ± 2,297.1 4,914.9 ± 2658.7 < 0.001
Thiamin (mg) 2.0 ± 1.0 2.1 ± 0.8 2.2 ± 0.9 0.161 2.0 ± 1.1 1.9 ± 1.0 2.4 ± 1.1 < 0.001
Niacin (mg) 14.9 ± 10.7 16.6 ± 8.4 20.6 ± 10.7 < 0.001 14.7 ± 8.2 15.9 ± 7.4 21.7 ± 11.7 < 0.001 Calcium (mg) 411.2 ± 199.5 478.3 ± 169.4 618.3 ± 326.3 < 0.001 453.1 ± 252.6 483.4 ± 249.3 640.4 ± 374.0 < 0.001 Phosphorus (mg) 981.2 ± 427.2 1,100.8 ± 364.1 1,302.7 ± 563.5 < 0.001 970.5 ± 460.9 1,052.7 ± 432.5 1,356.3 ± 610.1 < 0.001 KNHANES, Korea National Health and Nutritional Examination Survey; FAs, fatty acids; MUFAs, mono unsaturated fatty acids; PUFAs, poly unsaturated fatty acids.
All estimates were weighted and calculated taking the complex study design into account.
1)P-value was obtained from general linear model (GLM) for continuous variables.
2)Values are expressed as mean ± SD.
*P< 0.05
Table 5. Subjects’ daily foods and nutrients consumption according to fish consumption in KNHANES, 2015
Total in prediabetes (n = 291) Total in normal (n = 1,229)
≤ 17.0 g/day (n = 81)
18.0-93.0 g/day
(n = 84) ≥ 94 g/day
(n = 126) ≤ 17.0 g/day (n = 351)
18.0-93.0 g/day
(n = 393) ≥ 94 g/day
(n = 485) OR (95% CI)
Waist circumference (cm) (≥ 90 cm male, ≥ 80 cm female)
Model 11) 1.0 (ref) 1.215 (0.648, 2.279) 0.842 (0.451, 1.574) 1.0 (ref) 0.928 (0.661, 1.301) 1.081 (0.788, 1.484) Model 22) 1.0 (ref) 1.207 (0.635, 2.295) 0.769 (0.401, 1.475) 1.0 (ref) 0.905 (0.650, 1.26) 1.052 (0.768, 1.441) BP (mmHg) (≥ 85 mmHg DBP and ≥ 130 mmHg SBP)
Model 1 1.0 (ref) 0.930 (0.513, 1.685) 1.038 (0.540, 1.993) 1.0 (ref) 1.094 (0.736, 1.624) 0.979 (0.668, 1.435) Model 2 1.0 (ref) 0.936 (0.515, 1.699) 1.108 (0.572, 2.144) 1.0 (ref) 1.202 (0.803, 1.799) 1.083 (0.732, 1.603) Total cholesterol (mg/dL) (≥ 200 mg/dL)
Model 1 1.0 (ref) 0.422 (0.211, 0.845)* 0.555 (0.311, 0.989)* 1.0 (ref) 0.766 (0.571, 1.026) 0.764 (0.557, 1.047) Model 2 1.0 (ref) 0.422 (0.210, 0.846)* 0.549 (0.302, 0.997)* 1.0 (ref) 0.770 (0.573, 1.033) 0.769 (0.561, 1.053) HDL cholesterol (mg/dL) (< 40 mg/dL male, < 50 mg/dL female)
Model 1 1.0 (ref) 1.150 (0.558, 2.373) 0.738 (0.356, 1.527) 1.0 (ref) 0.997 (0.725, 1.372) 1.366 (0.940, 1.985) Model 2 1.0 (ref) 1.136 (0.559, 2.310) 0.605 (0.288, 1.269) 1.0 (ref) 0.959 (0.699, 1.315) 1.310 (0.903, 1.901) Triglyceride (mg/dL) (> 150 mg/dL)
Model 1 1.0 (ref) 0.978 (0.493, 1.938) 0.627 (0.313, 1.256) 1.0 (ref) 0.893 (0.626, 1.274) 1.048 (0.713, 1.542) Model 2 1.0 (ref) 0.998 (0.481, 2.071) 0.744 (0.353, 1.569) 1.0 (ref) 1.016 (0.698, 1.479) 1.220 (0.819, 1.819) LDL cholesterol (mg/dL) (> 100 mg/dL)
Model 1 1.0 (ref) 0.520 (0.261, 1.037) 2.482 (1.036, 5.944)* 1.0 (ref) 0.895 (0.651, 1.232) 1.012 (0.738, 1.389) Model 2 1.0 (ref) 0.510 (0.260, 1.002) 2.265 (0.961, 5.337) 1.0 (ref) 0.946 (0.685, 1.305) 1.077 (0.775, 1.496) KNHANES, Korea National Health and Nutritional Examination Survey; OR, odds ratio; CI, confidence interval; BP, blood pressure; SBP, systolic blood pressure; DBP, diastolic blood pressure; HDL, high density lipoprotein; LDL, low density lipoprotein
1)Model 1: unadjusted.
2)Model 2: adjusted for sex.
By multiple logistic regression analysis.
*P< 0.05
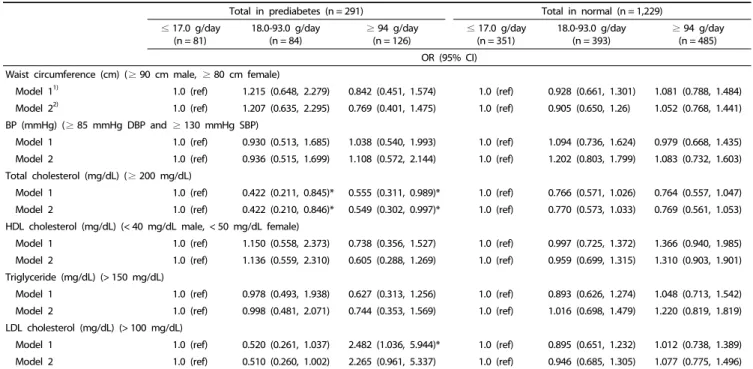
Table 6. Odds ratio and 95% confidence interval of MetS risk factors according to the consumption of fish in KNHANES, 2015 (n = 1,520)
concentrations in the blood were observed according to the fish consumption level of the subjects (P < 0.05). The number of subjects in the normal blood glucose group, who consumed fish was 1,229, and out of 351 subjects in the group of intake
≤ 17.0 g/day, 109 were male (31.1%) and 242 were female
(68.9%). Of 393 subjects in the group of intake 18.0-93.0 g/day,
121 were male (30.8%) and 272 were female (69.2%). Of 485
subjects in the group of intake ≥ 94 g/day, 204 were male
(42.1%) and 281 were female (57.9%). A significant difference in the gender distribution was observed according to the intake level (P < 0.001).
Dietary consumption according to the fish consumption
Table 5 lists the diet and nutrient intake of the prediabetes group and normal blood glucose group according to their fish consumption. The subjects’ fish consumption was divided into three levels, ≤ 17.0 g/day, 18.0-93.0 g/day, and ≥ 94 g/day for analysis. Regarding the total energy intake in the prediabetes group, the ≤ 17.0 g/day group took in 1,926 kcal/day; the 18.0-93.0 g/day group consumed 2,132 kcal/day; and the ≥ 94 g/day group took in 2,203 kcal/day. Significant differences according to the intake level (P = 0.037). The protein intake in the ≤ 17.0 g/day, 18.0-93.0 g/day, and ≥ 94 g/day groups was 59.7 g/day, 70.5 g/day, and 84.5 g/day, respectively, and there were significant differences according to the intake level (P <
0.001). In addition, there were significant differences in the levels of intakes of nutrients, including sodium (P = 0.013), niacin, calcium, and phosphorus (P < 0.001) according to the fish consumption.
Regarding the characteristics of diet and nutrient intake in the normal blood glucose group, there were significant differences in all levels of intakes of total energy, carbohydrate, protein, fat, n-3 unsaturated fatty acid, n-6 unsaturated fatty acid, MUFAs, PUFAs, vitamin A, carotene, retinol, sodium, thiamin, niacin, calcium, and phosphorus, according to the fish consumption level (P < 0.01).
Odds ratio of MetS risk factors according to the consumption of fish
The impact of the fish consumption level in the prediabetes group and normal blood glucose group on their metabolic risk factors were estimated using descriptive statistical analysis with age, sex, BMI, and total energy intake as significant variables as confounding factors. These were used as metabolic risk factors in a preceding study [23]. A phase adjustment was made to present the results after multiple regression analysis (Table 6).
Blood TC decreased 0.422 fold (95% CI: 0.211-0.845) in model 1 and 0.422 fold (95% CI: 0.210-0.846) in model 2 in those with a fish intake of ≤ 17.0 g/day compared those with a fish intake of 18.0-93.0 g/day (P < 0.05). In those with a fish intake of
≥ 94 g/day, the blood TC decreased by 0.555 fold (95% CI:
0.311-0.989) in model 1 and 0.549 fold (95% CI: 0.302-0.997) in model 2 compared to those with a fish intake of ≤ 17.0 g/day (P < 0.05).
DISCUSSION
According to the literature, the ratio of the transition from an IFG state to diabetes was approximately 4.4-6.4% annually.
The transition from an Impaired Glucose Tolerance (IGT) state to diabetes was 1.8-16.8%, and IFG and IGT were diagnosed simultaneously at approximately 10-15% [24]. Therefore, the health management of subjects with prediabetes is important for the effective management of NCDs, including diabetes.
According to the results of a study conducted with people from the leading Asian countries, including China, Japan, and South
Korea in 1998, the transition to nutrients obtained through the intakes of processed food, instant food, and food with a high fat content from nutrients obtained through the intake of the traditional foods has become the decisive factor in the accelerated incidence of NCDs in the three countries [25]. The results of a recent cohort study of the prevalence of NCDs in the three countries (1983-2011) [26] showed that the prevalence of hypertension was 24.5%, 17.6%, and 15.2% in China (n = 1,742), South Korea (n = 905), and Japan (n = 1,667) (P = 0.001), respectively, and that of diabetes was 8.9%, 5.7%, and 4.8%, respectively (P = 0.001). The mortality rate caused by NCDs in South Korea increased from 39.4% in 1983 in the early stage of the survey to 56.0% in 2011, the latter stage of the survey.
This study selected increased fat intake, increased consumption of food with a high nutrient density, and change in dietary life, such as a sedentary lifestyle, as causes for NCDs, similar to that reported elsewhere [27], and focused on the fact that a low salt, low-sugar and low-fat diet resulted in more significant improvements in the subjects diagnosed with hypertension and hyperlipidemia than in those without a diagnosis. Hence, to reduce the individual and social burdens of NCDs, it will be necessary to manage a dietary life that has room for improve- ment, emphasizing the prevention of risk factors and the importance of follow-up management. Preceding studies of the correlation between the dietary intake pattern and metabolic syndrome in Korean adult men and women showed that the meat and liquor intake patterns had positive correlations with the prevalence of hypertriglyceridemia. Moreover, grain, vegetable, and fish intake patterns had negative correlations with the prevalence of hypertriglyceridemia and metabolic syndrome. Therefore, taking into consideration that most studies examined the correlations of diseases with grain and vegetable intake [21], this study examined the effects of fish consumption in subjects with prediabetes, who are in a group at high risk of NCDs, to propose an appropriate consumption level for the efficient management of these diseases. An investigation of the clinical characteristics of the subjects in the prediabetes group and those in the normal blood glucose group according to sex, metabolic risk factors, including weight, WC, BMI, DBP, HbA1C, and TG levels, were significantly higher in males than in females in the prediabetes group. Indeed a study that examined the prevalence of diabetes according to sex with 46,239 adults in China in 2010, reported to the New England journal of medicine [28], showed similar results to this study; the FBG, WC, TG, and BP levels were higher and HDL-C level was lower in men than women. Thus, it was noted that the prevalence of prediabetes investigated through the standar- dization of age was 15.5% in all subjects (male: 16.1%, female:
14.9%). Nevertheless, there is insufficient validity to explain the
causality between the clinical characteristics and the disease,
which shows a significant gender difference between subjects
in the prediabetes group and those in the normal blood glucose
group; however, an analysis in comparison with the normal level
was conducted to understand the level of the clinical chara-
cteristics of the subjects. The WC of subjects with prediabetes
was 90.9 cm in men and 83.9 cm in women, which came under
the criteria for the diagnosis of metabolic syndrome [29], > 90
cm and > 80 cm, respectively. The TG level was high at 207.3
mg/dL in males, which was above the diagnostic criteria of 150 mg/dL. Regarding the LDL-C level, there was a significant gender difference according to age. In particular, it was 134.6 mg/dL in women in their 50s and higher than in men, which is at the boundary of the criteria for the diagnosis of dyslipidemia for Koreans [30]. Kim and Shin reported that the prevalence of metabolic syndrome was over 50% in women over 50 [31], and Lee et al. [32] noted that ovarian failure due to menopause increased the level of abdominal obesity and blood lipid level, which acted as a risk factor for hardening of the arteries. One study showed that, as menopause progresses, the WC, BP, TC, LDL-C, and TG levels become higher than those prior to menopause [33]. The LDL-C level of women in their 50s in the normal blood glucose group was 123 mg/dL, which was within the normal category (100-129 mg/dL) in the criteria for the diagnosis of dyslipidemia [30] set by the Korean Society of Lipid and Atherosclerosis (KSoLA), but higher than in the other age groups. Type II diabetes mellitus is regarded as a result of metabolic syndrome. In other words, it was reported that if obesity and insulin resistance continue to dyslipidemia (hypertriglyceridemia, low HDL-C, hypertension, and hyper- glycemia appear, and consequently, Type II diabetes mellitus and cardiovascular diseases occur [34]. Therefore, metabolic syndrome or diabetes increases the risk of cardiovascular diseases considerably, and cardiovascular diseases are considered one of the most important causes of death in patients with diabetes.
Because KSoLA sets a lower LDL-C level under 100 mg/dL as the treatment goal of primary dyslipidemia in patients with diabetes and recommends improving lifestyle, including eating habits, it is judged that a study of the dietary intake to improve the blood lipid level of subjects with prediabetes in the group with a high risk of diabetes has a great significance.
A significant gender difference in fish consumption was observed all subjects in this study; 58.7% of men in the prediabetes group were distributed in the ≥ 94 g/day fish consumption group. This is similar to the result showing that the level of the consumption of fish cooked with oil and the level of the consumption of all fish were significantly lower in women than in men in a Whitehall II study [35], which examined the impacts of socio-demographic characteristics on fish consumption in 2008. Because the fish consumption investigated in this study did not consider the fat content and the oil added in cooking, a future study should consider the intake methods, such as fat content and the use of oil in cooking to examine the accurate correlations with diseases.
As a result of a survey on food and nutrient intake level in the prediabetes group, there were significantly higher total energy, protein, and n-3 FAs intake in subjects in the group with high fish consumption. When the subjects’ intake level was compared to the reference of dietary intakes for Koreans in 2015 [36], i.e., a calorie intake came close to 2,400 kcal/day in men and 1,900 kcal/day in women aged 30-64, and a protein intake was 70.5 g/day in the group of intake 18.0-93.0 g/day and 84.5 g/day in the group of intake ≥ 94 g/day, it was noted that they took more than the recommended intake, 60 g/day for men and 50 g/day for women aged 30-64. An analysis of the nutrients of fish based on the National Standard Table of Food Composition in Rural Development Administration [37], the
nutrients contained the following: energy 149 kcal, protein 18.5 g, lipid 7.5 g, calcium 46 mg and phosphorus 191 mg in hairtail per edible portion 100 g; energy 169 kcal, protein 15.8 g, lipid 9.5 g, calcium 175 mg and phosphorus 233 mg in croaker;
energy 183 kcal, protein 20.2 g, lipid 10.4 g, calcium 26 mg and phosphorus 232 mg in mackerel; and energy 108 kcal, protein 19 g, lipid 2.7 g, calcium 9 mg and phosphorus 293 mg in cero. The intake levels met approximately 28.7-36.7% of protein and 15.3-59.3% of niacin, a micro-nutrient in the recommended daily intake on average. In addition, there was a difference in lipid content, 2.7-10.4 g, according to the type of intake. A significantly high n-3 FAs intake was observed in the group with high fish consumption level (P < 0.001). This intake is considered appropriate for the level within 1% of the daily calorie intake recommended for the n-3 fatty acid intake of adults suggested by the reference for dietary intake for Koreans. According to a study that examined the metabolism of CVD in 2011 [38], it was reported that in male subjects who consumed more than 35 g/day of fish, α-linolenic acid and n-3 FAs contained in the fish reduced the blood TG level and reduced the relative risk of CVD 0.62 fold. According to this report, n-3 FAs reduced the diacylglycerol acyltransferase and lowered the level of TG synthesis in the liver [39], which brought about a reduction of chylomicrons and TG content, a very low density lipoprotein component, which had a good impact on the blood LDL-C level [40]. Moreover, some studies noted that n-3 FAs were combined in the receptors in the cell membrane a few weeks after intake, controlled gene transcription, and altered the liquidity of the cell membrane, which affected several indices of the CVD risk [41, 42].
In the subjects with prediabetes in the present study, the
blood TC decreased 0.422 fold (95% CI: 0.211-0.845) in model
1 and 0.422 fold (95% CI: 0.210-0.846) in model 2 when they
took in 18.0-93.0g/day with fish intake of ≤ 17.0 g/day as a
reference (P < 0.05). When they consumed ≥ 94 g/day, the
blood TC decreased 0.555 fold (95% CI: 0.311-0.989) in model
1 and 0.549 fold (95% CI: 0.302-0.997) in model 2 compared
to those with a fish intake of ≤ 17.0 g/day (P < 0.05). The blood
LDL-C increased 2.482 fold (95% CI: 1.036-5.944) in model 1
when ≥ 94 g/day was consumed compared to those with an
intake of ≤ 17.0 g/day, which showed the contrasting impact
of the fish consumption level on blood lipid level in subjects
with prediabetes. A study conducted with people over 65 in
2003 [43] found that the appropriate intake of large fish, tuna
and the use of a baking without cooking oil lowered the
mortality risk of CVD because of fish consumption. Consequently,
the impact on CVD might differ according to the intake method
of fish in the diet. In the normal blood glucose group, the fish
consumption level had no significant impact on the metabolic
risk factors. This study has significance because it evaluated the
correlation between food intake in the prediabetes group and
metabolic risk factors based on the data analyzed with all the
people as a population, but it had some limitations. The Korea
National Health and Nutrition Examination Surveys are a
cross-sectional study, which has a limitation in revealing the
causal relation of the results of the study. In addition, there
are the following limitations. The method of the survey on food
to examine fish consumption and nutrient intake was a
measurement depending on the individuals’ memory. The diet taken in and recorded on the date of the survey might be not the same as the normal diet that reflects the diet taken in ordinary times. On the other hand, the Korea National Health and Nutrition Examination Surveys reflected the data obtained by conducting a face-to-face survey to examine the intake by trained interviewers. A future study utilizing a survey on the accurate food intake will be needed to examine the food intake reflecting a normal diet.
In conclusion, subjects with prediabetes in the group with a high risk of diabetes had higher levels of the clinical characteristics than those in the group with a normal blood glucose group and had high levels of WC and TG, which are used to diagnose metabolic syndrome. In addition, the LDL-C levels of female prediabetes subjects in their 50s was higher than the target level of dyslipidemia treatment in diabetic patients. Because prediabetes is in a stage of a high risk with high morbidity to diabetes, it is necessary to treat dyslipidemia to delay the transition to diabetes and cardiovascular diseases.
In particular, efforts should be made to control the blood lipid level by improving the eating habits. The results of this study suggest that the fish consumption level be maintained at 18.0-93.0 g/day to control the level of blood lipids appropriately.
CONFLICT OF INTEREST
The authors declare no potential conflicts of interests.
ORCID
Kyoung-yun Kim: https://orcid.org/0000-0001-8135-5273 Jeong Seop Park: https://orcid.org/0000-0002-9565-8360 REFERENCES
1. Amihăesei IC, Chelaru L. Metabolic syndrome a widespread threa- tening condition; risk factors, diagnostic criteria, therapeutic options, prevention and controversies: an overview. Rev Med Chir Soc Med Nat Iasi 2014; 118: 896-900.
2. Cornier MA, Dana Dabelea TL, Hernandez RC, Lindstrom AJ, Steig N, Stob R, Van Pelt HW, Robert HE. The metabolic syndrome. Endocr Rev 2008; 29: 777-822.
3. DeFronzo RA, Ferrannini E. Insulin resistance: a multifaceted syndrome responsible for NIDDM, obesity, hypertension, dyslipidemia, and atherosclerotic cardiovascular disease. Diabetes Care 1991; 14:
173-94.
4. Reaven GM. Role of insulin resistance in human disease. Diabetes 1988; 37: 1595-607.
5. International Diabetes Federation. The IDF consensus worldwide definition of the metabolic syndrome [Internet]. Brussels: Interna- tional Diabetes Federation; 2006 [cited 2016 December 25]. Available from: http://www.idf.org/webdata/docs/IDF_Meta_def_final.pdf.
6. Zimmet P, Alberti K, Shaw J. Global and societal implications of the diabetes epidemic. Nature 2001; 414: 782-7.
7. Park E, Choi SJ, Lee HY. The prevalence of metabolic syndrome and related risk factors based on the KNHANES V 2010. J Agric Med Community Health 2013; 38: 1-13.
8. Tuomilehto J, Lindström J, Eriksson JG, Valle TT, Hämäläinen H,
Ilanne-Parikka P, Keinänen-Kiukaanniemi S, Laakso M, Louheranta A, Rastas M, Salminen V, Uusitupa M; Finnish Diabetes Prevention Study Group. Prevention of type 2 diabetes mellitus by changes in lifestyle among subjects with impaired glucose tolerance. N Engl J Med 2001; 344: 1343-50.
9. Esposito K, Maiorino MI, Bellastella G, Panagiotakos DB, Giugliano D. Mediterranean diet for type 2 diabetes: cardiometabolic benefits.
Endocrine 2017; 56: 27-32.
10. Park YM, Steck SE, Fung TT, Zhang JH, Linda J, Han KD, Lee SH, Kwon SH, Merchant AT. Mediterranean diet, Dietary Approaches to Stop Hypertension (DASH) style diet, and metabolic health in US adults. Clin Nutr 2017; 36: 1301-9.
11. Asemi Z, Samimi M, Tabassi Z, Shakeri H, Sabihi SS, Esmaillzadeh A. Effects of DASH diet on lipid profiles and biomarkers of oxidative stress in overweight and obese women with polycystic ovary syndrome: a randomized clinical trial. Nutrition 2014; 30: 1287-93.
12. Altorf-van der Kuil W, Engberink MF, Brink EJ, van Baak MA, Bakker SJ, Navis G, van t Veer P, Geleijnse JM Dietary protein and blood pressure: a systematic review. PLoS One 2010; 5: e12102.
13. Ard JD, Grambow SC, Liu D, Slentz CA, Kraus WE, Svetkey LP. The effect of the PREMIER interventions on insulin sensitivity. Diabetes Care 2004; 27: 340-7.
14. Ley SH, Hamdy O, Mohan V, Hu FB. Prevention and management of type 2 diabetes: dietary components and nutritional strategies.
Lancet 2014; 383: 1999-2007.
15. Kastorini CM, Milionis HJ, Esposito K, Giugliano D, Goudevenos JA, Panagiotakos DB. The effect of Mediterranean diet on metabolic syndrome and its components: a meta-analysis of 50 studies and 534,906 individuals. J Am Coll Cardiol 2011;57:1299-313.
16. Appel LJ, Sacks FM, Carey VJ, Obarzanek E, Swain JF, Miller ER, Conlin PR, Erlinger TP, Rosner BA, Laranjo NM. Effects of protein, monounsaturated fat, and carbohydrate intake on blood pressure and serum lipids: results of the OmniHeart randomized trial. JAMA 2005; 294: 2455-64.
17. Wang C, Harris WS, Chung M. n-3 Fatty acids from fish or fish-oil supplements, but not alpha-linolenic acid, benefit cardiovascular disease outcomes in primary- and secondary-prevention studies: a systematic review. Am J Clin Nutr 2006; 84: 5-17.
18. Hu FB, Bronner L, Willett WC. Fish and omega-3 fatty acid intake and risk of coronary heart disease in women. JAMA 2002; 287:
1815-21.
19. Mozaffarian D, Rimm EB. Fish intake, contaminants, and human health: evaluating the risks and the benefits. JAMA 2006; 296:
1885-99.
20. American Diabetes Association. Diagnosis and classification of diabetes mellitus. Diabetes Care 2010;33 Suppl 1: S62-9.
21. Kim J, Jo I. Grains, vegetables, and fish dietary pattern is inversely associated with the risk of metabolic syndrome in South Korean adults. J Am Diet Assoc 2011; 111: 1141-9.
22. Zaribaf F, Falahi F, Barak F, Heidari M, Keshteli AH, Yazdannik A, Esmaillzadeh A. Fish consumption is inversely associated with the metabolic syndrome. Eur J Clin Nutr 2014; 68: 474-80.
23. Slagter SN, van Waateringe RP, van Beek AP, van der Klauw MM, Wolffenbuttel BH, van Vliet-Ostaptchouk JV. Sex, BMI and age differences in metabolic syndrome: the Dutch Lifelines Cohort Study. Endocr Connect 2017; 6: 278-88.
24. Gerstein HC, Santaguida P, Raina P, Morrison KM, Balion C, Hunt D, Yazdi H, Booker L. Annual incidence and relative risk of diabetes
in people with various categories of dysglycemia: a systematic overview and meta-analysis of prospective studies. Diabetes Res Clin Pract 2007; 78: 305-12.
25. Sugimori H, Miyakawa M, Yoshida K, Izuno T, Takahashi E, Tanaka C, Nakamura K, Hinohara S. Health risk assessment for diabetes mellitus based on longitudinal analysis of MHTS database. J Med Syst 1998; 22: 27-32.
26. Ma D, Sakai H, Wakabayashi C, Kwon JS, Lee Y, Liu S, Wan Q, Sasao K, Ito K, Nishihara K, Wang P. The prevalence and risk factor control associated with noncommunicable diseases in China, Japan, and Korea. J Epidemiol 2017; 27: 568-73.
27. Kawamori R. Diabetes trends in Japan. Diabetes Metab Res Rev 2002;18 Suppl 3:S9-13.
28. Yang W, Lu J, Weng J, Jia W, Ji L, Xiao J, Shan Z, Liu J, Tian H, Ji Q, Zhu D, Ge J, Lin L, Chen L, Guo X, Zhao Z, Li Q, Zhou Z, Shan G, He J; China National Diabetes and Metabolic Disorders Study Group. Prevalence of diabetes among men and women in China. N Engl J Med 2010; 362: 1090-101.
29. Expert Panel on Detection, Evaluation, and Treatment of High Blood Cholesterol in Adults. Executive summary of the third report of the National Cholesterol Education Program (NCEP) expert panel on detection, evaluation, and treatment of high blood cholesterol in adults (Adult Treatment Panel III). JAMA 2001; 285: 2486-97.
30. The Korean Society of Lipidology and Atherosclerosis Executive Summary of the Korean Guideline for the Management of Dyslipi- demia 3rd Version. Seoul: The Korean Society of Lipidology and Atherosclerosis; 2015.
31. Kim MH, Kim MK, Choi BY, Shin YJ. Prevalence of the metabolic syndrome and its association with cardiovascular diseases in Korea.
J Korean Med Sci 2004; 19: 195-201.
32. Lee HJ, Kwon HS, Park YM, Chun HN, Choi YH, Ko SH. Waist circumference as a risk factor for metabolic syndrome in Korean adult; evaluation from 5 different criteria of metabolic syndrome.
J Korean Diabetes Assoc 2005; 29: 48-56.
33. Kim HM, Park J, Ryu SY, Kim J. The effect of menopause on the metabolic syndrome among Korean women: the Korean National Health and Nutrition Examination Survey, 2001. Diabetes Care 2007;
30:701-6.
34. Mottillo S, Filion KB, Genest J, Joseph L, Pilote L, Poirier P. The metabolic syndrome and cardiovascular risk a systematic review and meta-analysis. J Am Coll Cardiol 2010; 56: 1113-32.
35. Akbaraly TN, Brunner EJ. Socio-demographic influences on trends of fish consumption during later adult life in the Whitehall II study.
Br J Nutr 2008; 100: 1116-27.
36. Ministry of Health and Welfare (KR); The Korean Nutrition Society.
Dietary Reference Intakes for Koreans 2015. Sejong: Ministry of Health and Welfare; 2016.
37. Rural Development Administration (KR). Food Composition Table.
9th rev. ed. Wanju: Rural Development Administration; 2016.
38. Salas-Salvadó J, Martinez-González MÁ, Bulló M, Ros E. The role of diet in the prevention of type 2 diabetes. Nutr Metab Cardiovasc Dis 2011; 21 Suppl 2: B32-48.
39. Larsson SC, Orsini N. Fish consumption and the risk of stroke: a dose-response meta-analysis. Stroke 2011; 42: 3621-3.
40. Rustan AC, Nossen JO, Christiansen EN, Drevon CA. Eicosapen- taenoic acid reduces hepatic synthesis and secretion of triacylglycerol by decreasing the activity of acyl-coenzyme A:1,2-diacylglycerol acyltransferase. J Lipid Res 1988; 29: 1417-26.
41. Clandinin MT, Cheema S, Field CJ, Garg ML, Venkatraman J, Clandinin TR. Dietary fat: exogenous determination of membrane structure and cell function. FASEB J 1991;5:2761-9.
42. Feller SE, Gawrisch K. Properties of docosahexaenoic- acid-containing lipids and their influence on the function of rhodopsin. Curr Opin Struct Biol 2005;15:416-22.
43. Mozaffarian D, Lemaitre RN, Kuller LH, Burke GL, Tracy RP, Siscovick DS; Cardiovascular Health Study. Cardiac benefits of fish consumption may depend on the type of fish meal consumed: the Cardiovascular Health Study. Circulation 2003;107:1372-7.