Brief Report
Vol. 30, No. 6, 2018 739
Received September 8, 2017, Accepted for publication January 5, 2018
Corresponding author: Alice He, Department of Dermatology, Johns Hopkins University School of Medicine, Cancer Research Building II, 1550 Orleans Street, Baltimore, MD 21231, USA. Tel: 410-955-5933, Fax: 410-955-8645, E-mail: [email protected]
ORCID: https://orcid.org/0000-0002-1938-0619
This is an Open Access article distributed under the terms of the Creative Commons Attribution Non-Commercial License (http://creativecommons.org/
licenses/by-nc/4.0) which permits unrestricted non-commercial use, distribution, and reproduction in any medium, provided the original work is properly cited.
Copyright © The Korean Dermatological Association and The Korean Society for Investigative Dermatology
dermal cysts after the presentation of herpes zoster which had occurred 1 year prior5.
Various hypotheses about the pathogenesis of the epi- dermal cyst and milia exist. Physical damage and histo- logical inflammation of the skin by herpes zoster and bul- lous disorders may induce the epidermal cyst and milia. In particular, the use of immunosuppressive drugs may con- tribute to the development of a cyst more easily by ex- acerbating the inflammation imbalance and pilosebaceous unit occlusion.
Our case is the second case of an epidermal cyst caused by Wolf’s post-herpetic isotopic response, but it is the first case that occurred during a short period in a healthy adult without using of immunosuppressive agents.
The incidence of herpes zoster is increasing every year with an increased lifespan and the use of various im- munosuppressive agents. Considering these tendencies, it is also assumed that the isotopic response caused by the herpes zoster would also increase. Based on this case, physicians should keep in mind that multiple epidermal cysts could occur from Wolf’s post-herpetic isotopic re- sponse in healthy adults.
CONFLICTS OF INTEREST
The authors have nothing to disclose.
REFERENCES
1. Wolf R, Brenner S, Ruocco V, Filioli FG. Isotopic response.
Int J Dermatol 1995;34:341-348.
2. Wolf R, Wolf D, Ruocco E, Brunetti G, Ruocco V. Wolf’s isotopic response. Clin Dermatol 2011;29:237-240.
3. Ruocco V, Ruocco E, Brunetti G, Russo T, Gambardella A, Wolf R. Wolf’s post-herpetic isotopic response: infections, tumors, and immune disorders arising on the site of healed herpetic infection. Clin Dermatol 2014;32:561-568.
4. Gibney MD, Nahass GT, Leonardi CL. Cutaneous reactions following herpes zoster infections: report of three cases and review of the literature. Br J Dermatol 1996;134:504-509.
5. Sandhu K, Saraswat A, Handa S. Multiple epidermoid cysts occurring at site of healed herpes zoster in a renal transplant recipient: an isotopic response? Clin Exp Dermatol 2003;28:
555-556.
https://doi.org/10.5021/ad.2018.30.6.739
Rosacea and Rate of Temperature Change: Examining Real-Time Data from 2004 to 2016
Alice He, Radhika Grandhi1, Shawn Gaurav Kwatra
Department of Dermatology, Johns Hopkins University School of Medicine, Baltimore, MD, 1Department of Dermatology, University of Cincinnati College of Medicine, Cincinnati, OH, USA
Dear Editor:
Rosacea is a chronic inflammatory skin condition with ex- acerbations that may be triggered by heat1. However,
there is limited data on seasonal variations of rosacea exacerbations. In this study we use real-time Google Trends data to examine seasonal variations in rosacea search quer-
Brief Report
740 Ann Dermatol
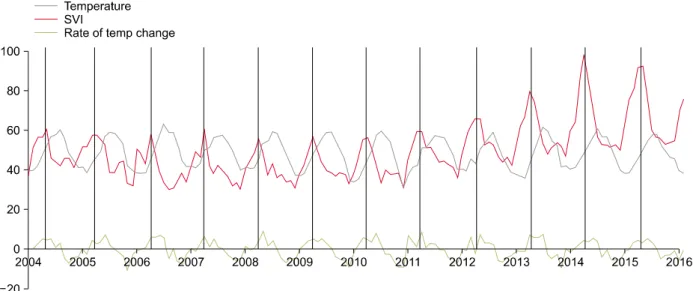
Fig. 1. Search volume index (SVI) for “rosacea”, national temperature (oF), and rate of temperature change in the United States by month from January 2004 to March 2016. Black vertical lines are drawn from the peak of rosacea SVI each year and correspond well to the rate of temperature change peaks.
Fig. 2. Search volume index (SVI) for “rosacea”, national temperature (oF), and rate of temperature change in the United Kingdom by month from January 2004 to March 2016. Black vertical lines are drawn from the peak of rosacea SVI each year and correspond well to the rate of temperature change peaks.
ies in the United States (US) and United Kingdom (UK) and its relation to seasonal temperature variations.
Google Trends (https://www.google.com/trends/) is a re- source that provides normalized search volume data for terms queried using Google. This technology has recently gained attention in dermatology to assess prevalence of tanning bed use and skin cancer in the US and the UK2. Monthly data for search volume in the US and UK was ex- tracted from January 2004 to March 2016. Search volume
data is represented by a relative search volume index (SVI), which ranges from 0 (no searches) to 100 (peak search vol- ume) relative to all searches on the topic. US national tem- perature data by month was obtained from the National Oceanic and Atmospheric Administration3, and for the UK from the Met Office, the UK’s national weather service4. The monthly SVI for “rosacea” queries and temperature data over time for the US is plotted in Fig. 1 and for the UK in Fig. 2. There is a clear and reliable trend, where
Brief Report
Vol. 30, No. 6, 2018 741 search queries for rosacea peak in March-April and tem-
peratures peak in July-August each year. We determined the rate of temperature change of each month to highlight the times at which the temperature fluctuated most rapidly. There was a significant Pearson’s correlation in the US (r=0.57, p=1.02×10⁻¹³) and UK (r=0.43, p=4.78×10⁻⁸) for “rosacea” SVI and the velocity of tem- perature change, indicating a positive relationship: the faster the temperature changes, the more searches for ro- sacea (for this data, the critical value for the Pearson corre- lation at a significance of p=0.05 is 0.17, indicating corre- lations >0.17 are significant).
Our data suggest that abrupt changes in temperature lead to more rosacea interest and potentially a greater number of exacerbations. This interpretation is based on the as- sumption that increased rosacea interest, as evidenced by search queries, may be a surrogate measure of increased rosacea disease activity in the public.
There are many factors that might explain this observation.
Patients with rosacea have higher cutaneous blood flow, increased diaphoretic events, and heightened sympathetic nerve activity during heating as compared to healthy con- trols1. This suggests that sympathetic hyperactivity during heating contributes to flushing and other rosacea symptoms.
Furthermore, epidemiological investigations have demon- strated a close association between Demodex mite in- festation and rosacea5. Demodex mite mobility and surviv- al increases at higher temperatures, contributing to in- creased rosacea exacerbations as temperatures increase5. These findings should be interpreted with caution, as our results are restricted to Google search engine data.
Nonetheless, Google Trends is a powerful tool that pro-
vides real-time, immediate, and free temporal data. We show that seasonal variations in temperature correlate with rosacea search volume. With refinery, this technol- ogy can contribute significantly to epidemiological re- search and be used to detect potential seasonal variations in less commonly studied dermatological conditions.
CONFLICT OF INTEREST
The authors have nothing to disclose.
REFERENCES
1. Metzler-Wilson K, Toma K, Sammons DL, Mann S, Jurovcik AJ, Demidova O, et al. Augmented supraorbital skin sympathetic nerve activity responses to symptom trigger events in rosacea patients. J Neurophysiol 2015;114:
1530-1537.
2. Reed DD. Google search trends for tanning salons: temporal patterns indicate peak interest in mid spring. J Am Acad Dermatol 2015;73:1055-1056.
3. National Oceanic and Atmospheric Administration. U.S.
climate divisional dataset (nClimDiv) [Internet]. Asheville:
National Oceanic and Atmospheric Administration; 2016 [cited 2016 Mar 25]. Available from: https://www.ncdc.noaa.
gov/monitoring-references/maps/us-climate-divisions.php.
4. Met Office. Climate summaries [Internet]. Exeter: Met Office;
2016 [cited 2016 Mar 25]. Available from: http://www.
metoffice.gov.uk/climate/uk/summaries.
5. Zhao YE, Guo N, Wu LP. The effect of temperature on the viability of Demodex folliculorum and Demodex brevis.
Parasitol Res 2009;105:1623-1628.