Introduction
Anthropometric data collection, including three-dimen- sional information, together with comparison of these data among countries are becoming necessary tools for the entire manufacturing community [26].
In the clothing industry, there is a critical problem of minimizing the number of sizes to be defined while maxi- mizing their cover rates, in an attempt to strive for more rationalized production methods.
Anthropometric surveys devised by each country attempt to fulfill the requirements of the manufacturers, providing them with data and tools, and allowing them to face both the internal and export markets [4,18,19,22].
Thus, in Korea, the first national anthropometry survey was conducted in 1979 by a Korean government division, the Korean Agency for Technology and Standard [8] . At the time, data were collected concerning 17,000 samples residing in various parts of the country aged between six and fifty. A total number of 117 measurement dimensions
were taken using calipers and tape measures. Thanks to these data, the KATS established 46 items defining Korean standards concerning clothing, furniture, desks and chairs.
Forty-one of them KSK 0035 to KSK 0096 were associat- ed with the size designations of men’s wear, women’s wear, brassieres, socks, etc.
Following this survey, the Korean government has been presenting a national anthropometric survey every 5 or 6 years. The surveys of 1986, 1992, 1997, 2003 and 2010 were performed according to the following sequence [9-13]:
The survey was performed with the traditional measure- ment method (2D) using an anthropometer, somatometer, caliper and tape measure. The 3-D body scan data collec- tion (Body Line Scanner, Hamamatsu Co.) method (3D) was also adopted in order to obtain a good compromise and to modernize the fit and construction of their garments for the 2003 and 2010 surveys. All body dimensions were measured with the method defined by the ISO [5,6].
Anthropometric Data Analysis for Body Shape Modeling in Korean
Young-suk LEE
Chonnam National University, Department of Clothing Science
(Received 7 June 2013, revised 20 June 2013, accepted 22 June 2013, Published Online 30 June 2013)
Abstract : This paper deals with secular trend of height spanning 1979 to 2010 and also morphological growth patterns for Korean. It also investigates the comparison of the growth pattern between male and female based on the anthropometric data samples of KATS taken from the 1979 to 2010 surveys. The great rates of change in height occurred during 1979-1997 with 2-3 cm increase in both sexes at each surveys. After 1997 the change rate of height while increasing is remained within less than 1 cm till 2010 survey. This pattern is consistent with recent Korean cultural emphasis on health and physical fitness according to the economic development. The causes of the observed trends, insofar as they have been identified, are related to cultural processes.
Keywords:Morphology, Anthropometry, Size, Silhouette, Growth
The author (s) agree to abide by the good publication practice guideline for medical journals.
The author (s) declare that there are no conflicts of interest.
Correspondence to : Young-suk LEE (Chonnam National University, Department of Clothing Science Yongbongdong, 300, Gwangju, Korea) E-mail : [email protected], [email protected]
Korean J Phys Anthropol Vol. 26, No. 2 (2013) pp. 61~69
http://dx.doi.org/10.11637/kjpa.2013.26.2.61 Original Article
Surveys 1st 2nd 3rd 4th 5th 6th
Years 1979 1986 1992 1997 2003 2010
Sample 17,000 21,650 8,800 13,000 14,000 14,000
Age Range 6-50 6-50 6-50 0-70 0-90 7-69
Dimensions 117 80 84 120 359 139
Methods 2D 2D 2D 2D 2D, 3D 2D, 3D
This paper deals with secular trend of height spanning 1979 to 2010 and also morphological growth patterns for Korean. It also investigates the comparison of the growth pattern between male and female based on the anthropo- metric data samples of KATS taken between the 1997 and 2010 surveys.
Methods
The anthropometric data of Korean measured in 1997 [11,14] and the data collected from 2003 and 2010 [12,13]
as well as the women’s data measured from 2003-2004 [21,22] which was conducted on 360 adult females bet- ween the ages of 20 and 60 were analysed in this section to obtain information on Korean women’s physical fea- tures. The 2004 data, generated by direct traditional mea- surement, sliding gauge measurement and 3D body scan- ner measurement, consisted of anthropometric data of 140 women in their twenties and of 220 middle-aged women.
Data on size and annual growth changes of measurements of subjects aged from 0 to 60 years based on 1997 [14]
and 2010 KATS samples were compared to clarify the tendency of maturation in body size.
The anthropometric data included stature, 3 girth dimen- sions (bust girth, waist girth and hip girth), 5 breadth dimensions (inter-bust point breadth, chest breadth, waist breadth, hip breadth and acromion to acromion breadth), 4 depth dimensions (chest depth, waist depth, abdominal depth and hip depth), 5 height dimensions (waist height, shoulder height, illiospinal height, crotch height and hip height) and span, which were analyzed to indicate body shape.
The drop values between bust and hip girth in women and between chest and waist girth in men are used to dis- tinguish the body type. The 3D modeling of the standard body shape of men and women in their twenties obtained from 2010 KATS photos [13] are presented to define Korean’s morphological features.
3D modeling data, body silhouette data of the mid-sagit- tal plane, front median line, form front and form side views measured by the sliding gauge, and index values calculat- ed from the differences between bust-waist, bust-hip girth and waist- hip girth measurements, were used as elements for body shape and proportion comparison.
Results
1. The secular trend of height in Korean
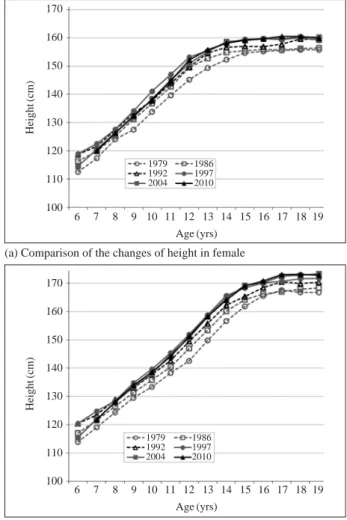
The changes of body height in subjects from 6 to 20 years are illustrated in Fig. 1. Fig. 1(a) is an example showing a secular change in mean height of female and male subjects’
samples aged from 6 to 20 years taken between 1979 to 2010. As shown in Fig. 1(a), the mean height value of 18 years women is 155.7 cm in 1979, 156.2 cm in 1986, 160 cm in 1997, 160.2 cm in 2003, and 160 cm in the 2010 data.
The mean height value of 18 years of men is 166.8 cm in 1979, 167.9 cm in 1986, 171.8 cm in 1997, 172.9 cm in 2003, and 172.9 cm in the 2010 data as shown in Fig. 1(b).
As shown in Fig. 1(a) and (b), compared to 1979 data, the mean height of 1997 and 2010 for both sexes increased about 4 cm to 5 cm.
Fig. 1. Secular trend of height in groups of Korean male and female.
6 7 8 9 10 11 12 13 14 15 16 17 18 19 Age (yrs)
(a) Comparison of the changes of height in female
6 7 8 9 10 11 12 13 14 15 16 17 18 19 Age (yrs)
(b) Comparison of the changes of height in male 170
160
150
140
130
120
110
100
170
160
150
140
130
120
110
100
Height(cm)Height(cm)
1979 1986 1992 1997 2004 2010
1979 1986 1992 1997 2004 2010
2. The comparison of the growth pattern in both sexes
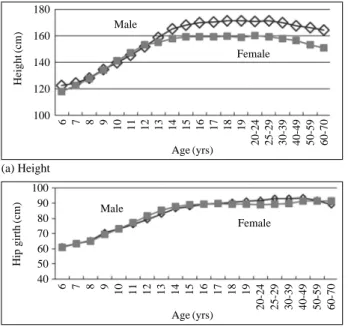
The data on height and hip girth of male and female from 1997 and 2010 samples were compared according to age in both sexes (see Figs. 2 and 3). The average stature of male from 2010 data has been found to be 173.3 cm with a 95 percentile of 185.9 cm for young men in their twenties.
In comparison with the 1997 data, which showed an aver-
age stature of 171.8 cm, there has been a 2 cm increase.
The size changes of height, bust girth, waist girth and hip girth measurements, which present body development features and annual growth changes of measurements by age 6-20 years in the Korean female, are shown in Fig. 4.
According to the 2010 data, the average bust, waist and hip girths of men were 93.0 cm, 80.2 cm and 94.3 cm, re- spectively. In 1997, the sizes of subjects in their twenties were 89.6 cm, 76.4 cm and 92.6 cm, respectively. As for the data of women, the average height, bust, waist and hip girth from 2010 data were 160.4 cm, 83.0 cm, 70.2 cm and 91.5 cm, respectively. In 1997, the results for the twenties were 159.8 cm, 82.0 cm, 65.8 cm and 89.2 cm, respectively.
The growth rate at each age based on data 1997 and 2010 are illustrated in Fig. 5.
For girls at age 10 years, the values of height, arm length, bust girth, waist girth and hip girth are, respectively, 140.7 cm, 47.6 cm, 72.0 cm, 62.0 cm and 76.2 cm. For boys at age 10, the values of height, arm length, bust girth, waist girth and hip girth are, respectively, 141.4 cm, 47.6 cm, 72.0 cm, 64.9 cm and 75.2 cm. Each year, height increases
Fig. 2. Growth pattern of height and hip girth in groups of Korean male and female from 1997 data set.
Fig. 3. Growth pattern of height and hip girth in groups of Korean
male and female from 2010 data set. Fig. 4. Size changes of measurements in Korean.
180 160 140 120 100
100 90 80 70 60 50 40
6 7 8 9 10 11 12 13 14 15 16 17 18 19 20-24 25-29 30-39 40-49 50-59 60-70
6 7 8 9 10 11 12 13 14 15 16 17 18 19 20-24 25-29 30-39 40-49 50-59 60-70
Height(cm)Hip girth(cm)
Age (yrs) Male
Female
Male
Female
Age (yrs) (a) Height
(b) Hip girth
180 170 160 150 140 130 120 110 100
100 90 80 70 60 50
6 7 8 9 10 11 12 13 14 15 16 17 18 19 20s 30s 40s 50s 60s
6 7 8 9 10 11 12 13 14 15 16 17 18 19 20s 30s 40s 50s 60s
(a) Height
(b) Hip girth
Age (yrs)
Height(cm)Hip girth(cm)
Male Female Age
Male Female
180 160 140 120 100 80 60 40 20 0
200 180 160 140 120 100 80 60 40 20 0
6 7 8 9 10 11 12 13 14 15 16 17 18 19 20yrs
6 7 8 9 10 11 12 13 14 15 16 17 18 19 20yrs (cm)
(cm)
Size changes in women (2010 data)
Size changes by age in men (2010 data) (a) Womens data
(b) Mens data
Height Bust girth Waist girth Hip girth
Height Bust girth Waist girth Hip girth
4-6 cm between the ages of 6 and 12 years in both sexes.
And then the height increases 2-3 cm per year in girls group and 4-5cm in boys group aged from 12 to 15 years.
At age 6, height reaches approximately 74% of the adult height and arm length, bust girth, waist girth and hip girth reache respectively 72%, 71.7%, 77.7% and 67.9% of the adult size (adults of age 16-17 years). At age 6, weight reaches about 40% of the weight of adults aged 16-17. On average, maturity in growth is reached at the age of 18-19 years for males and 16-17 years for females.
3. The distribution of drop value in women
Fig. 6(a) suggests the drop value between bust girth and hip girth based on the data of women body dimension taken in 2010 (N==2,978). The drop values are concentrat- ed in the range from 6 to 9 cm which approximately repre- sent 40% cover rate of women. Data are divided into three zones corresponding to different body types of Korean women.
The three body shapes range in descriptive titles from N
Fig. 6. Drop values distribution in Korean.
Growth rate (%) 95
65
35
5
110
100
90
80
70
60
50 (%)
Height Weight Bust girth Waist girth Hip girth
Height Bust girth Waist girth Hip girth Age in years (a) Results from 1997 data
(b) Results from 2010 data
0-0.3 0.4-0.6 0.7-0.9 1.0-1.2 1.3-1.8 1.9-2.4 2 3 4 5 6 7 8 9 10 11 12 13 14 15 16 17 18 19 20-24
6 7 8 9 10 11 12 13 14 15 16 17 18 19 20yrs
Fig. 5. Annual growth rate in four measurements of Korean female.
350 300 250 200 150 100 50 0
300 250 200 150 100 50 0
-4 -3 -2 -1 0 1 2 3 4 5 6 7 8 9
10 11 12 13 14 15 16 17 18 19 20 21 22 23 24 25 26 27 (a) Distribution of drop values in women
(b) Distribution of drop values in men
(c) Distribution of chest-waist girth in men Chest girth-Waist girth (cm)
-4 -3 -2 -1 0 1 2 3 4 5 6 7 8 9 10 11 12 13 14 15 Hip girth-Bust girth (cm)
16 17
100
95
90
85
80
75
70
65
60
Chest- Waist
75 80 85 90 95 100 105 110
Chest girth (cm)
Waist girth (cm)
(regular), H (slim hips) and A (broad hips) are as follows:
Type N, whose drop value ranges from 6 cm to 10 cm, can be defined as the standard type for Korean women. Women who have a drop value between 10 cm and 16 cm belong to type A. This type indicates that she has a well-developed hip compared to that of Type H (drop value of -1 cm ~6 cm reflects a woman with a well-developed bust and slim hips).
Fig. 6(b) and (c) suggest the drop value between chest girth and waist girth based on the 2010 data set of men from 19 to 60 years. The drop values are concentrated in the range from 10 to 20 cm which approximately represent 50% cover rate of men.
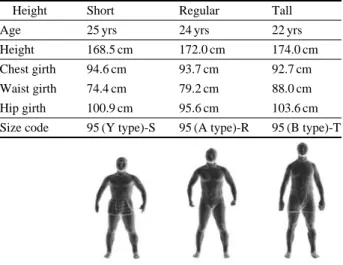
Data are divided into three zones corresponding to dif- ferent body types of Korean men. The three body shapes range in descriptive titles from A (athletic), Y (slim) and B (broad waist) are as follows: Type A, whose drop value ranges from 12 cm to 18cm, can be defined as the standard type for Korean men. Men who have a drop value between 18 cm and 22 cm belong to type Y. This type indicates that he has a slim waist compared to that of Type B (drop value of 6-10 cm reflects a men with a large size of waist). For men, the main relationships between chest and waist girths were summerizes as following: For Y type, chest girth is 18-22 cm smaller than waist girth. For A type, chest girth is 12-18 cm smaller than waist girth. For B type, chest girth is 6-12 cm smaller than waist girth. 3D modeling of defined three different body types of men according to the following size codings are illustrated in Fig. 7.
4. Standard body type of Korean in twenties
As showing in Fig. 4, the means of height, bust, waist and hip girth are respectively, 173.2 cm, 93.0 cm, 78.4 cm and 94.3 cm in men aged 19 years, and respectively 160.2 cm, 83.6 cm, 69.3 cm and 92.8 cm in women aged 19 years.
These sizes can be regarded as the standard young adult body shape in Korean as shown (Photos from “Size Korea 2010”).
5. 3D body silhouette
Fig. 8 shows an example of body shape modeling of Korean women in their twenties using sliding guage based on form front and side silhouette. This figure realizes a comparison of body silhouette shape according to the bust, waist and hip breadth and depth. We can evaluate the body silhouette with the index of bust and hips against waist.
Desired S-Line body silhouette index of B/W and H/W of women in their twenties ranges from 1.50 to 1.66. And the
Size code according to body type for men
Height Short Regular Tall
Age 25 yrs 24 yrs 22 yrs
Height 168.5 cm 172.0 cm 174.0 cm
Chest girth 94.6 cm 93.7 cm 92.7 cm
Waist girth 74.4 cm 79.2 cm 88.0 cm
Hip girth 100.9 cm 95.6 cm 103.6 cm
Size code 95 (Y type)-S 95 (A type)-R 95 (B type)-T
Fig. 7. An example of three different body type modeling in Korean men.
Women (Height 160) Men (Height 173) B-W-H: 84-70-93 B-W-H: 93-77-94
Fig. 8. An example of body shape modeling using sliding guage data.
Front form Breadth Depth
Breast Side form Hip
index move to range 1.30-1.20 in their 30-40ties, and then decrease to 1.00 in their 50-60ies.
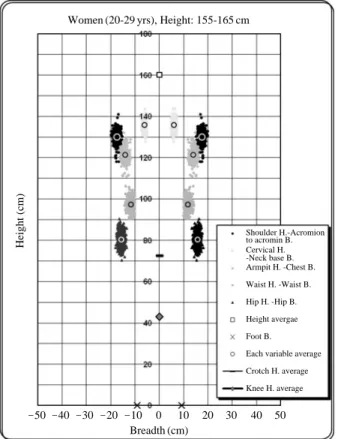
Fig. 9 shows an example of body shape modeling of Korean women using body size data plotting from 235 women from 20 to 29 years selected as harmonious body shape.
This sort of figure realizes a comparison of existing shapes with the desired virtual ones (i.e. a well- proportion- ed body figure in which height corresponds to 8 times the height of the head) considered as a harmonious body shape by a given or targeted population.
Discussion
In Korea, like many other countries, the mean height has been increasing in last several decades. In such countries anthropometric data will be outdated sooner or later. The information on the speed of the secular change in height in last several decades is useful to judge if the database is still representing the intended target population or to judge
how long the latest database will serve as the reference data [15]. Fig. 1 shows the secular trend of height in sub- jects from 6 to 20 years. The mean height of both adults remains almost the same in the surveys of 1997 and 2010.
However, the mean height of girls aged from 8-9 years increased about 1-2 cm from 1997 to 2010 which shows the early fast maturing somatotype. Also, the mean height of girls aged from 8-9 years increased 7-8 cm in last several decades from 1986 to 1997 [9,11].
The comparison of the growth in both sexes are plotted in Fig. 2 and Fig. 3. In women, height increases from birth to maturity 3.2 times (for comparison it is 3.5 times for men) mainly due to rapid growth in leg length. The lines are very similar for both survey data. On average, maturity of growth in height is reached at the age of 18-19 years for males and 16-17 years for females.
As can be seen in Fig. 4, the means of height, bust, waist and hip girth are respectively, 173.2 cm, 93.0 cm, 78.4 cm and 94.3 cm in men aged 19 years, and respectively 160.2 cm, 83.6 cm, 69.3 cm and 92.8 cm in women aged 19 years.
These sizes are as large as Europeans in height [3], and have a narrower hips compared to American data from the ASTM standard [1,23,17].
Fig. 5 shows the growth rate from age 0 to 20 years. In the body development features of the population group re- presented by the height, girl subjects are shown to grow up- ward rapidly during the height range 104-135 cm (approx- imately 4-9 years). For during the years represented by the height range 104-135 cm boy subjects also grow up- wards rapidly, remaining slim, while in the latter years they tend to consolidate or broaden. The body girth dimensions which exibit a jump in magnitude at the 140 cm height dis- tinguish primarily for bust and hip development combined with the normal body ‘consolidation’ that occurs also with boys. It is only to be expected that limb development pro- gresses proportionately with height development or applox- imately so. Increasing annual growth in bust, waist and hip girth, with 3.80 cm, 3.11 cm and 3.70 cm respectively at age 9-10 (with height of 134 cm) corresponds to female child-adult transformation in body shape. There have been increases in growth rates in the more recent period com- pared to 1986, and there is a definite trend toward earlier maturation and greater total body build. A number of stud- ies have been carried out on the growth stages of puberty [2,25,27,28]. These reports showed that the puberty stages for boys appear at the age 9.1 to 12.5 years, while girls Fig. 9. Modeling of Korean women’s body proportion using data
plotting.
Women (20-29 yrs), Height: 155-165 cm
Shoulder H.-Acromion Cervical H.
Armpit H. -Chest B.
Waist H. -Waist B.
Hip H. -Hip B.
Height avergae Foot B.
Each variable average Crotch H. average Knee H. average to acromin B.
-Neck base B.
Height (cm)
-50 -40 -30 -20 -10 0 10 20 30 40 50 Breadth (cm)
reaches the stages as early as 10.0 years. The growth stages are highly correlated to height growth as shown in Fig. 5.
The results of growth pattern and growth rate from the 2010 data are similar to those patterns of 1997 results.
Fig. 6 shows the body type of Korean divided by drop value. The values of chest girth according to waist girth are plotted in Fig. 6(c). The regular body type N in women has the 6-9 drop value for bust and hip girth. These drop value distributions are quite similar in Japanese body type showing from JIS [7,16,24].
Fig. 7 shows the standard type of Korean. Koreans have shown a large increase in stature since 1980. However, there has been virtually no change in sitting height in that period. Thus, height increases has been due entirely to an increases in leg length with the result that body shape has altered. Similar results were reported for Chinese [29].
Fig. 8 shows an example of body shape index plotting by calculation of the bust/waist and hip/waist values As shown in Fig. 8, the cluster of both index B/W and H/W is moving from index 1.55 to 1.0 according to body shape.
And then we can suggest from these data that the oldest groups are undergoing the biggest change in waist and with smaller bust, and a lean body [20,24].
Fig. 9 shows the comparison between existing shapes with the desired virtual ones (i.e. a 8 head-tall-well-propor- tioned body), and with body shapes from 235 women from 20 to 29 years selected as harmonious body shape.
According to the 8 head-tall-well proportioned body, the waist height position should be at 100 cm high for a woman being 160 cm high (see the horizontal line). The Fig. 9 shows that the selected subjects’ waist height ranges from 90 to 102 cm. Thus, the range is wide due to diverse body shape that we observed. The results of body proportion show that the Korean women in their twenties have long legs and a 7.8 head- tall body proportion [17,24].
Conclusion
As shown in the survey results, small differences in body proportions at birth are continuously multiplied by differ- ential growth rates up until maturity, after which body shape changes are influenced by age, quality and quantity of food intake, exercise and social conditions. This pattern is consistent with recent Korean cultural emphasis on health and physical fitness according to the economic develop-
ment. The causes of the observed trends, insofar as they have been identified, are related to cultural processes.
There are several studies which cover growth features of the entire range from birth to maturity, and they have re- ported the comparison of the growth patterns amongst Eu- ropean. Even though such research have been made, as for the clothing industry, the human modeling tools based on the anthropometric data and morphological features that cover all the countries should be developed for well fitting garments design.
Acknowledgements
The author would like to thank KATS for the database of Koreans used in the present study.
This paper is presented at the conference of the JES and DHM symposium 2013.
References
1. ASTM D 5585. Standard tables of body measurements for adult female misses figure type. ASTM; 2011.
2. Duke PM, Litt IF, Gross RT. Adolescents’ self-assessment of sexual maturation. Pediatrics1980; 66:918.
3. EN 13402-2 . Primary and secondary dimension. EN; 2009.
4. Hans W Jurgens, Ivar A Aune, Ursula Pieper. International data on anthropometry. Geneva: International Labour Offi- ce; 1990.
5. ISO 3635. Size designation of clothes, definitions, and body measurement procedures. ISO; 1981.
6. ISO 8559. Garment construction and anthropometric sur- veys. ISO; 1989.
7. JIS L 4005. Sizing systems for women’s garments. JIS;
2001.
8. KATS. The Report of the anthropometry survey. Korea:
KATS Report; 1979.
9. KATS. The Report of the anthropometry survey. Korea:
KATS Report; 1986.
10. KATS. The Report of the anthropometry survey. Korea:
KATS Report; 1992.
11. KATS. The Report of the anthropometry survey. Korea:
KATS Report; 1997.
12. KATS. The Report of the anthropometry survey. Korea:
KATS Report; 2003.
13. KATS. The Report of the anthropometry survey. Korea:
KATS Report; 2010.
14. Kim DJ, Lee YS. Korea national anthropometry survey. Re- port of Korea National Institute of Technology and Quality;
1997.
15. Kouchi M, Mochimaru M. Quality assurance of anthropo- metric data. Japan: Report WEAR; 2005.
16. KS K 0059. Sizing systems for women’s garments. KS;
2009.
17. Lee YS. Morphological study in Korean for the garments sizing system. Report of Korea National Institute of Tech- nology and Quality; 1999.
18. Lee YS. The Measure of Youths, Human body demension data in design. Korea: Shinsunsa Publication; 1999.
19. Lee YS. The Measure of Infants, Human body demension data in design. Korea: Shinsunsa Publication; 1999.
20. Lee YS. Recent advances in Korea anthropometry. CARS 2002; 57.
21. Lee YS. A study on the anthropometric change of Korean women body shape. Report of KATS; 2003.
22. Lee YS. The 2D and 3D anthropometry survey. Report of Chonnam University; 2004.
23. Lee YS. Comparing samples from different countries for key sizing dimensions. 20th International Co Data Confer- ence. 2006; 65-68.
24. Lee YS. Anthropometry, apparel sizing and design, Chapter 8 Developing apparel sizing systems for particular groups.
UK: Woodhead publishing Co; 2013.
25. Marshall WA, Tanner JM. Puberty, in human growth. New York and London: Plenum Press; 1986.
26. Sanders MS, McCormick EJ. Human factors in engineering and design. U.S.A.: McGraw-Hill; 1992.
27. Tanner JM. Physical growth from conception to maturity.
Cambridge: Massachusetts, Harvard University Press; 1978.
28. Tanner JM, White house RH, Healy MJR. A new system for estimating the maturity of the hand and wrist, with stan- dards derived from 2,600 healthy British children. Paris:
International Children’s Center; 1962.
29. Zhang & Huang. The second national growth and develop- ment survey of children in China. Annals of Human Bio- logy. 1988; 15:289-306.
한국인의 체형 특성 모델링을 위한 인체 측정데이터 분석 연구
이영숙
전남대학교 의류학과
간추림 : 본 연구는 1979년부터 2010년까지 매 5-6년 간격으로 행하여진 한국인 인체치수데이터를 분석 비교하 였다. 또한 1997년과 2010년에 측정되어진 데이터를 중심으로 인체 체형특성을 비교 분석하였다.
체형특성 분석은 체형을 나타내는 주요 부위인 키, 가슴둘레, 허리둘레, 엉덩이둘레에 대한 연령별 성장특성을 비교하였다. 또한 인체의 너비부위와 두께부위에 대한 분석을 통하여 인체의 실루엣 특성을 비교하였다.
1997년 이후 1997년까지는 한국인은 남녀모두 매 조사주기에서 2-3 cm 키의 증가를 보이고 있으며, 1997년 이후 부터는 2010년 6차 조사까지 1 cm 전후의 미미한 증가를 나타내었다.
이러한 키의 증가율은 한국인 인체특성의 변화가 사회적 경제적 여건에 의한 생활패턴의 변화로부터의 영향 이 현저함을 설명하고 있다.
찾아보기 낱말 : 체형, 인체측정, 사이즈, 성장, 실루엣
교신저자 : 이영숙(전남대학교 의류학과)
전자우편 : [email protected], [email protected]