A Higher Salt Intake Leads to a Lower Rate of Adequate Blood Pressure Control
The relationship between salt intake and adequate blood pressure control is not well investigated in Korea populations, especially in patients with cardiovascular disease. This cross-sectional study enrolled 19,083 subjects who participated in the Korea National Health and Nutrition Examination Survey conducted from 2009-2011. The amount of salt intake was estimated using the Tanaka equations based on spot urine samples. Comparing patients with and without cardiovascular disease, systolic blood pressure (129.1 ± 18.1 mmHg vs. 120.0 ± 18.1 mmHg, P < 0.001) and the amount of urinary sodium excretion (149.4 ± 37.5 mM/day vs. 144.1 ± 36.2 mM/day, P < 0.001) were higher in patients with cardiovascular diseases. Among patients with cardiovascular disease, the high blood pressure group showed an increased amount of urinary sodium excretion compared to the normal blood pressure group (155.5 ± 38.2 vs. 146.6 ± 36.9 mM/day, P < 0.001). The odds ratio (OR) of high blood pressure was higher (OR, 1.825; 95% CI, 1.187-2.807;
P-for-trend 0.003, highest quartile of urinary sodium excretion vs. lowest quartile) in patients with cardiovascular disease. A higher amount of urinary sodium excretion was associated with a lower rate of adequate blood pressure control in Korean population, especially with cardiovascular disease.
Keywords: Blood Pressure; Cardiovascular Diseases; KNHANES; Sodium Jeonghwan Lee,1 Hajeong Lee,2
Kiwon Kim,3 Jung Hwan Park,4 Suhnggwon Kim,5 and Jieun Oh6
1Department of Internal Medicine, Hallym University Hangang Sacred Heart Hospital, Seoul; 2Department of Internal Medicine, Seoul National University Hospital, Seoul; 3Nephrology Clinic, National Cancer Center, Goyang; 4Department of Internal Medicine, Konkuk University School of Medicine, Chungju;
5Research Institute of Salt and Health, Seoul K-Clinic, Seoul; 6Department of Internal Medicine, Hallym University Kangdong Sacred Heart Hospital, Seoul, Korea
Received: 8 May 2014 Accepted: 10 July 2014 Address for Correspondence:
Jieun Oh, MD
Department of Internal Medicine, Hallym University College of Medicine, Kangdong Sacred Heart Hospital, 150 Seongan-ro, Gangdong-gu, Seoul 134-701, Korea
Tel: +82.2-224-2190, Fax: +82.2-478-6925 Email: [email protected]
http://dx.doi.org/10.3346/jkms.2014.29.S2.S103 • J Korean Med Sci 2014; 29: S103-108
INTRODUCTION
Sodium is an essential electrolyte for regulating blood volume and osmotic equilibrium in the human body. However, high sodium intake leads to fluid retention and subsequent increase in blood pressure. Animal research has demonstrated that in- creased sodium intake could result in volume overload and hy- pertension (1), and clinical studies have shown that high sodi- um intake is closely associated with elevated blood pressure (2).
Hypertension is a risk factor for cardiovascular disease and one of the leading causes of mortality in the general population (3).
Therefore, dietary sodium intake is considered to be a modifi- able risk factor for the development of hypertension and car- diovascular disease, and the importance of salt restriction is emphasized in the general population, especially in patients with cardiovascular disease. The World Health Organization has emphasized salt reduction as one of the top three priorities for improving the global non-communicable disease crisis (4), and it is recommended that sodium intake be below 2 g/day to reduce blood pressure and the risk of cardiovascular disease, stroke, and coronary heart disease in adults (5). The 2010 Di- etary Guidelines for Americans recommend that adults in gen-
eral should consume no more than 2,300 mg of sodium per day; additionally, those who are 51 yr of age and older, African Americans, and those who have high blood pressure, diabetes, or chronic kidney disease should limit their intake to 1,500 mg of sodium per day (6). Indeed, a recent meta-analysis revealed the blood pressure-lowering effects of sodium restriction (7).
Despite the risks associated with high salt intake, general population consumes much more sodium than recommended.
The average daily sodium intake of Americans aged 2 yr and older is more than 3,400 mg (8). In 2010, South Koreans con- sumed 4,878 mg of sodium on average, which is 2.4 times high- er than the WHO recommended daily intake of 2,000 mg per day (9). Although it is recommended that patients with cardio- vascular disease reduce their sodium intake, the actual amount of sodium consumed and the relationship between the amount of sodium consumed and blood pressure in those with cardio- vascular disease have not been well investigated. The aim of this cross-sectional study was to evaluate the effects of dietary sodium intake on blood pressure in the general populations and in subjects with cardiovascular disease in Korea. We aimed to investigate whether the effects of high sodium intake on blood pressure would be the same or different among patients
with or without cardiovascular diseases.
MATERIALS AND METHODS Description of study subjects
This present study was performed based on data acquired from the fourth Korea National Health and Nutrition Examination Survey (KNHANES) conducted in 2009-2011. The KNHANES has been carried out periodically since 1998 to assess the health and nutritional status of the civilian Korean population. The number of patients after primary selection was 42,347. Patients (n = 10,972) younger than 20 yr were excluded. Among the 31,375 adult patients, the amount of urinary sodium excretion could be calculated in 19,083, and these subjects were included in the final statistical analysis. High blood pressure was defined as systolic blood pressure above 140 mmHg or diastolic blood pressure above 90 mmHg. Patients with hypertension were de- fined as patients with high blood pressure or those currently taking antihypertensive medications. Patients with coronary heart disease were defined as patients who had a history of an- gina or myocardial infarction. Patients with cerebrovascular disease were defined as patients who had history of diagnosis or treatment of brain hemorrhage or stroke. Cardiovascular dis- ease was defined as either coronary heart disease or cerebro- vascular disease.
Study measurements
The amount of salt intake was estimated based on the amount of urinary salt excretion. In this study, the amount of salt excret- ed was calculated with the Tanaka equations using a random urine sample. Essentially, the amount of salt excreted was cal- culated by multiplying the urinary sodium and creatinine ratio by the 24-hr urinary creatinine excretion rate. The Tanaka equations are as follows: 24-hr urinary sodium excretion (mM/
day) = 21.98 × urinary sodium concentration/urinary creatinine concentration × (-2.04 × age+14.89 × body weight [kg]+16.14
× height [cm] - 2244.45)0.392 (10).
Statistical analysis
Statistical analyses were performed using the IBM SPSS soft- ware package, version 21.0 (SPSS Inc., Chicago, IL, USA). Con- tinuous data are presented as the means and standard devia- tion, and categorical data are presented as frequencies. The amount of urinary sodium excretion was categorized into quar- tile categories according to the existence of cardiovascular dis- ease. Comparisons of blood pressure across the urinary sodium excretion groups were performed using analysis of variance (ANOVA) methods for the primary analysis and analysis of co- variance (ANCOVA) adjusting for age, sex, BMI, diabetes melli- tus, hemoglobin levels, eGFR, and total cholesterol levels for the secondary analysis. Correlations between the 24-hr salt ex-
cretion and blood pressure measurements were identified us- ing linear correlation methods. A comparison of salt excretion between the blood pressure groups was performed using ANO- VA and ANCOVA. Finally, the risk of uncontrolled blood pres- sure according to the amount of salt excretion was investigated by univariate and multivariate logistic regression methods ad- justing for age, sex, and body mass index. All analyses were se- quentially performed in the total participants group and in the cardiovascular disease group. All tests were two-sided, and P values of < 0.05 were considered to be significant.
RESULTS
Participant characteristics
The clinical and laboratory characteristics of the participants are summarized in Table 1. A total of 19,083 adult participants were enrolled in this study. In the total participants group, the mean age was 50.2 ± 16.1 yr, and 45.4% of the participants were male. The body mass index was 23.7 ± 3.3. Systolic blood pres- sure was 120.4 ± 17.6 mmHg, and diastolic blood pressure was 77.1 ± 10.7 mmHg. The estimated urinary sodium excretion was 144.3 ± 36.3 mM/day. The total number of patients with cardiovascular disease was 843 (4.4%). The mean age of the participants with cardiovascular disease was 65.3 ± 10.5 yr; sys- tolic blood pressure was 129.1 ± 18.1 mmHg, diastolic blood pressure was 77.1 ± 10.4 mmHg, and the estimated urinary so- dium excretion was 149.4 ± 37.5 mM/day. Compared to the pa- tients without cardiovascular disease, the patients with cardio- vascular disease were older with a male preponderance, high Table 1. Baseline characteristics according to comorbidities
Characteristics All participants (n = 19,083)
Participants with cardiovascular
disease (n = 843)
Participants without cardiovascular
disease (n = 18,240)
P value
Age (yr) 50.2 ± 16.1 65.3 ± 10.5 49.5 ± 16.0 < 0.001 Sex (male) 8,673 (45.4%) 439 (52.1%) 8,234 (45.1%) < 0.001 BMI (kg/m2) 23.7 ± 3.3 24.7 ± 3.1 23.6 ± 3.3 < 0.001 SBP (mmHg) 120.4 ± 17.6 129.1 ± 18.1 120.0 ± 18.1 < 0.001 DBP (mmHg) 77.1 ± 10.7 77.1 ± 10.4 77.1 ± 10.7 0.962 Diabetes 2,219 (11.1%) 243 (28.8%) 1,876 (10.3%) < 0.001 Hemoglobin (g/dL) 14.0 ± 1.6 13.8 ± 1.6 14.0 ± 1.6 < 0.001 BUN (mg/dL) 14.4 ± 4.4 16.6 ± 5.1 14.3 ± 4.3 < 0.001 Creatinine (mg/dL) 0.83 ± 0.21 0.93 ± 0.30 0.82 ± 0.21 < 0.001 eGFR (mL/min/1.73 m2) 94.5 ± 18.5 82.1 ± 19.9 95.0 ± 18.2 < 0.001 Glucose (mg/dL) 97.9 ± 23.0 105.2 ± 26.2 97.6 ± 22.7 < 0.001 Total cholesterol (mg/dL) 189.4 ± 36.4 179.1 ± 39.1 189.9 ± 36.2 < 0.001 Daily sodium
excretion* (mM/day) 144.3 ± 36.3 149.4 ± 37.5 144.1 ± 36.2 < 0.001 Data expression as mean ± standard deviation or numbers with percentage, as ap- propriate. P values are those of independent t-test or chi-square test. *The amount of daily sodium excretion was estimated using the Tanaka equations based on spot urine sample. BMI, body mass index; BUN, blood urea nitrogen; DBP, diastolic blood pressure; eGFR, estimated glomerular filtration rate; SBP, systolic blood pressure.
body mass index, high systolic blood pressure, high incidence of diabetes, high cholesterol levels, and decreased renal func- tion. However, diastolic blood pressure did not differ between the two groups. The amount of urinary sodium excretion was significantly higher in the patients with cardiovascular disease (149.4 ± 37.5 mM/day) than in those without cardiovascular disease (144.1 ± 36.2 mM/day).
The relationship between blood pressure control and urinary sodium excretion
The correlation between urinary sodium excretion and blood pressure is illustrated in Fig. 1. Systolic blood pressure (Fig. 1A;
β = 0.107, P < 0.001, R2= 0.049) and diastolic blood pressure (Fig. 1B); β = 0.045, P < 0.001, R2= 0.023) were significantly as-
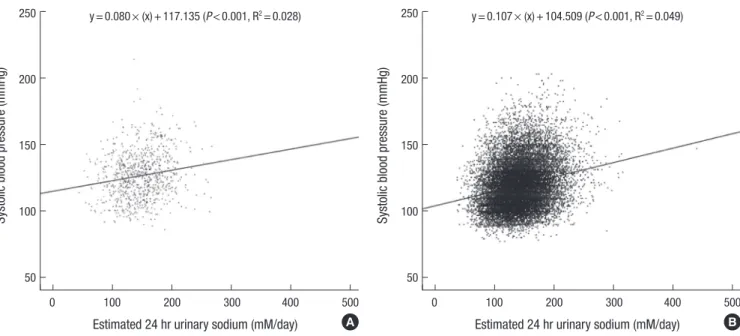
sociated with the amount of urinary sodium excretion. The ef- fect of comorbidities on the association between systolic blood pressure and the amount of urinary sodium excretion is illus- trated in Fig. 2. Systolic blood pressure in the participants with cardiovascular disease (Fig. 2A; β = 0.080, P < 0.001, R2= 0.028) and participants without cardiovascular disease (Fig. 2B; β = 0.107, P < 0.001, R2= 0.049) was associated with the amount of urinary sodium excretion.
Systolic and diastolic blood pressure values were compared according to the amount of urinary sodium excretion (Table 2), and the amount of urinary sodium excretion was categorized into the quartiles in each group. In the total participants group, an increase in both systolic and diastolic blood pressure was associated with an increase in the amount of urinary sodium
Fig. 1. Systolic and diastolic blood pressure according to the amount of urinary salt excretion in the total participants (n = 19,083). (A) Systolic blood pressure (β = 0.107, P <
0.001, R2 = 0.049) and (B) diastolic blood pressure (β = 0.045, P < 0.001, R2 = 0.023) were significantly associated with the amount of urinary sodium excretion.
Systolic blood pressure (mmHg) Diastolic blood pressure (mmHg)
0 100 200 300 400 500 0 100 200 300 400 500
250
200
150
100
50
150
125
100
75
50
25
Estimated 24 hr urinary sodium (mM/day) Estimated 24 hr urinary sodium (mM/day) y = 0.107 × (x) + 104.871 (P < 0.001, R2 = 0.049) y = 0.045 × (x) + 70.581 (P < 0.001, R2 = 0.023)
A B
Table 2. Systolic and diastolic blood pressure according to the amount of urinary sodium excretion
Blood pressure Group Amount of urinary sodium excretion* P value
(ANOVA)
P value (ANCOVA)
Q1 Q2 Q3 Q4
Systolic blood pressure
All participants (n = 19,083) Cardiovascular
(n = 843) Non-cardiovascular
(n = 18,240)
115.4 ± 16.2 124.7 ± 16.3 115.0 ± 16.1
118.9 ± 16.9 127.1 ± 18.0 118.5 ± 16.8
120.8 ± 17.1 128.3 ± 17.4 120.5 ± 17.0
125.4 ± 18.6 133.6 ± 18.6 124.9 ± 18.5
< 0.001
< 0.001
< 0.001
< 0.001
< 0.001
< 0.001 Diastolic blood
pressure All participants (n = 19,083) Cardiovascular
(n = 843) Non-cardiovascular
(n = 18,240)
74.9 ± 10.4 76.3 ± 11.3 74.9 ± 10.4
76.6 ± 10.5 76.0 ± 10.4 76.6 ± 10.6
77.3 ± 10.5 76.9 ± 10.1 77.3 ± 10.5
79.0 ± 10.9 78.2 ± 10.1 79.1 ± 10.9
< 0.001 0.006
< 0.001
< 0.001 0.001
< 0.001
Data expression as mean ± standard deviation. P values are those of ANOVA or ANCOVA adjusted for age, sex, BMI, diabetes mellitus, hemoglobin levels, eGFR, and total cho- lesterol levels. *The amount of urinary sodium excretion was categorized according to the quartile range (Q1-Q4) in each groups. Three cut-points dividing the quartiles are as follows: 119.3, 142.2, and 167.2 in all participants; 123.3, 149.0, and 175.1 in subjects with cardiovascular disease; 119.1, 142.0, and 166.8 in subjects without cardiovas- cular disease.
excretion. When the participants were compared according to the existence of cardiovascular disease, both systolic and dia- stolic blood pressure tended to increase in accordance with urinary sodium excretion in the participants with cardiovascu- lar disease.
The amount of daily sodium excretion was compared ac- cording to blood pressure status (Table 3). The high blood pres- sure group included patients with systolic blood pressure at or over 140 mmHg or diastolic blood pressure at or over 90 mmHg. The low blood pressure group included patients with systolic blood pressure under 140 mmHg and diastolic blood pressure under 90 mmHg. The high blood pressure group showed an increased amount of urinary sodium excretion compared to the low blood pressure group (154.5 ± 38.3 vs.
141.5 ± 35.2 mM/day, P < 0.001, in the total participants; 155.5
± 38.2 vs. 146.6 ± 36.9 mM/day, P < 0.001, in the patients with
cardiovascular disease).
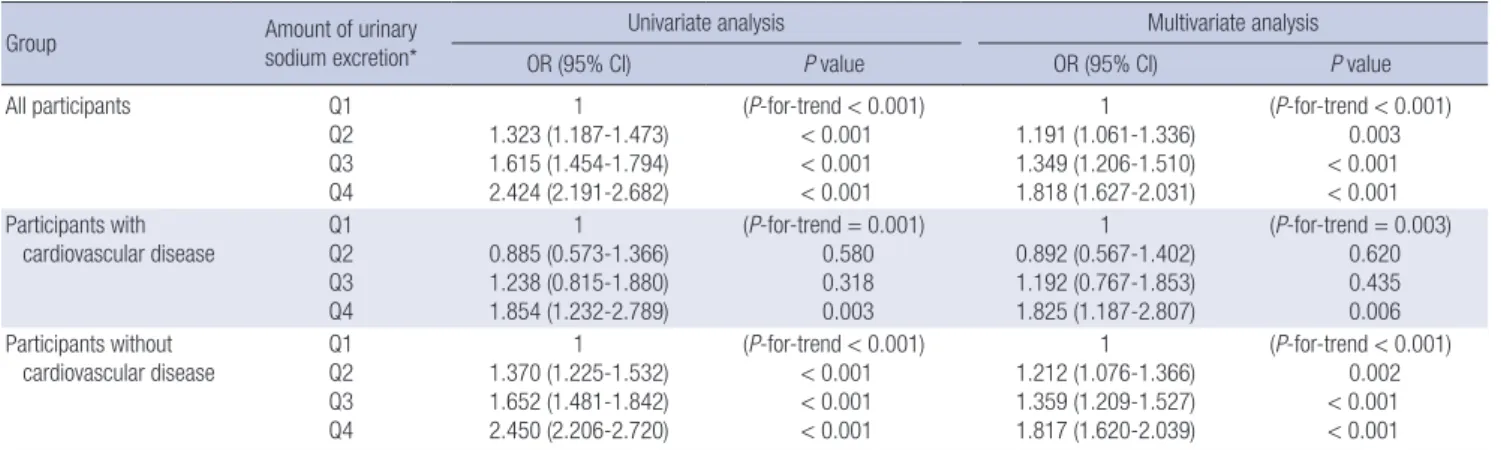
The prevalence of high blood pressure was analyzed with uni- variate and multivariate logistic regression methods (Table 4). In all groups, an increased amount of urinary sodium excretion was significantly associated with the development of hyperten- sion. In the patients with cardiovascular disease, the odds ratio (OR) of high blood pressure was significantly higher (OR, 1.825;
95% CI, 1.187-2.807; P-for-trend 0.003, highest quartile of uri- nary sodium excretion vs. lowest quartile) in the multivariate analysis.
DISCUSSIONS
In this study, we investigated whether high sodium intake is closely associated with an increase in blood pressure, irrespec- tive of comorbidities, in the Korean population. Both systolic and diastolic blood pressure were significantly associated with the amount of urinary sodium excretion, and the relationship was more evident for systolic blood pressure.
High sodium intake is an important cause of elevated blood pressure and is closely associated with cardiovascular events and mortality. The INTERSALT study showed that excessive so- dium intake is related to high blood pressure, and the DASH- Sodium study reported that reducing the intake of sodium along with consuming a diet rich in fruits, vegetables, and low- fat dairy foods is effective for lowering blood pressure (2, 11). In addition, hypertension is one of the main risk factors for cardio- vascular disease and mortality (12, 13), and high salt intake has a direct effect on the cardiovascular system, independent of its effects on blood pressure (14). Considering the risk and medi- Table 3. Amount of salt excretion according to blood pressure status
Group Low BP group High BP group P value
(ANOVA)
P value (ANCOVA) All participants
(n = 19,083) 141.5 ± 35.2 154.5 ± 38.3 < 0.001 < 0.001 Cardiovascular
(n = 843)
146.6 ± 36.9 155.5 ± 38.2 0.001 0.003 Non-cardiovascular
(n = 18,240) 141.3 ± 35.2 154.4 ± 38.3 < 0.001 < 0.001 Data expression as mean ± standard deviation. P values are those of ANOVA or AN- COVA adjusted for age, sex, BMI, diabetes mellitus, hemoglobin levels, eGFR, and to- tal cholesterol levels. BP, blood pressure; cardiovascular, participants with coronary heart disease or cerebrovascular disease; high BP group, participants with systolic blood pressure at or over 140 mmHg or diastolic blood pressure at or over 90 mmHg;
low BP group, participants with systolic blood pressure under 140 mmHg and dia- stolic blood pressure under 90 mmHg.
Fig. 2. Relationship between systolic blood pressure and the amount of urinary salt excretion according to the existence of comorbidities. Systolic blood pressure in participants with cardiovascular disease (A) (β = 0.080, P < 0.001, R2 = 0.028) and participants without cardiovascular disease (B) (β = 0.107, P < 0.001, R2 = 0.049) was associated with the amount of urinary sodium excretion.
Systolic blood pressure (mmHg) Systolic blood pressure (mmHg)
0 100 200 300 400 500 0 100 200 300 400 500
250
200
150
100
50
250
200
150
100
50
Estimated 24 hr urinary sodium (mM/day) Estimated 24 hr urinary sodium (mM/day) y = 0.080 × (x) + 117.135 (P < 0.001, R2 = 0.028) y = 0.107 × (x) + 104.509 (P < 0.001, R2 = 0.049)
A B
Table 4. Risk of high blood pressure according to the amount of salt excretion
Group Amount of urinary
sodium excretion*
Univariate analysis Multivariate analysis
OR (95% CI) P value OR (95% CI) P value
All participants Q1
Q2 Q3 Q4
1 1.323 (1.187-1.473) 1.615 (1.454-1.794) 2.424 (2.191-2.682)
(P-for-trend < 0.001)
< 0.001
< 0.001
< 0.001
1 1.191 (1.061-1.336) 1.349 (1.206-1.510) 1.818 (1.627-2.031)
(P-for-trend < 0.001) 0.003
< 0.001
< 0.001 Participants with
cardiovascular disease Q1 Q2 Q3 Q4
1 0.885 (0.573-1.366) 1.238 (0.815-1.880) 1.854 (1.232-2.789)
(P-for-trend = 0.001) 0.580 0.318 0.003
1 0.892 (0.567-1.402) 1.192 (0.767-1.853) 1.825 (1.187-2.807)
(P-for-trend = 0.003) 0.620 0.435 0.006 Participants without
cardiovascular disease Q1 Q2 Q3 Q4
1 1.370 (1.225-1.532) 1.652 (1.481-1.842) 2.450 (2.206-2.720)
(P-for-trend < 0.001)
< 0.001
< 0.001
< 0.001
1 1.212 (1.076-1.366) 1.359 (1.209-1.527) 1.817 (1.620-2.039)
(P-for-trend < 0.001) 0.002
< 0.001
< 0.001 Data expression as the odd ratio (95% confidence interval). High blood pressure was defined as either systolic blood pressure above 140 mmHg or diastolic blood pressure above 90 mmHg. Covariates in the multivariate analysis included age, sex, BMI, diabetes mellitus, hemoglobin levels, eGFR, and total cholesterol levels. *The amount of urinary sodium excretion was categorized according to the quartile range (Q1-Q4) in each group. Three cut-points dividing the quartiles are as follows: 119.3, 142.2, and 167.2 in all participants; 123.3, 149.0, and 175.1 in subjects with cardiovascular disease; 119.1, 142.0, and 166.8 in subjects without cardiovascular disease.
cal burden of cardiovascular morbidity and mortality in pa- tients with cardiovascular disease, the importance of sodium restriction in this group is more important than sodium restric- tion in the general population. Although many clinical studies have explored the effect of dietary sodium intake on blood pressure in the general population, studies on patients with cardiovascular disease are lacking.
In the present study, the patients with cardiovascular disease were older, were predominantly male, and had higher systolic blood pressure with a higher amount of sodium excretion than the other participants. Age, sex, and body mass index are im- portant factors influencing the blood pressure status and amount of salt intake. Therefore, we included these factors in our multivariate analysis and found that the amount of salt in- take is significantly associated with systolic and diastolic blood pressure after adjusting for age, sex, and body mass index. In a recent meta-analysis, a modest reduction in salt intake for 4 or more weeks caused significant reductions in blood pressure in both hypertensive and normotensive individuals, irrespective of sex and ethnic group (15). Zhou et al. (16) found that the adoption of a diet low in sodium and high in potassium low- ered systolic blood pressure in hypertensive patients and low- ered both systolic and diastolic blood pressure in normotensive controls. Considering the effects of the amount of sodium ex- cretion on systolic and diastolic blood pressure in the present study, we can conclude that both systolic and diastolic blood pressure are significantly associated with the amount of urinary sodium excretion, and this association does not differ regard- less of the existence of cardiovascular disease.
In this study, the amount of urinary sodium excretion was estimated using the Tanaka equation with a spot urine sample.
The amount of sodium intake is generally assessed by either the evaluation of dietary content or the measurement of urinary sodium excretion. However, because estimating sodium intake
using food records or dietary recall questionnaires is cumber- some, a method for measuring urinary sodium excretion is pre- ferred in clinical studies. The entire amount of ingested sodium is not excreted through urine, with approximately 10%-20% ex- creted via the gastrointestinal tract or as sweat (17); therefore, the amount of urinary sodium excretion is generally lower than the actual sodium intake (18). The gold standard method of measuring urinary sodium excretion is 24-hr urine collection and calculation of the amount of urinary sodium. However, 24- hr urine collection is inconvenient and can be inaccurate due to the possibility of missed urine samples. The Tanaka equation estimates 24-hr urinary sodium excretion by measuring the so- dium to creatinine ratio from a spot urine sample obtained at any time from 9 AM to 7 PM (10). The Tanaka formula was gen- erated using a database of Japanese subjects who participated in the INTERSALT study. Convenience and simplicity are the merits of the Tanaka equation; however, diurnal variation in urinary sodium excretion due to posture changes can introduce random error in measurements of 24-hr urinary sodium excre- tion. Although amount of urinary sodium excretion is closely associated with amount of dietary sodium intake, use of diuret- ics and its’ dosage can affect the amount urinary sodium excre- tion. In this cross-sectional, it is a limitation that the diuretics usage could not be evaluated according to the urinary sodium excretion and blood pressure.
In the Korean population, patients with cardiovascular dis- ease are assumed to consume an excess of sodium even though they are more hypertensive than the general population. The amount of urinary sodium excretion is closely related to the blood pressure level, irrespective of the cardiovascular disease status. Because high sodium intake is one of the main risk fac- tors for hypertension and cardiovascular mortality, the impor- tance of sodium restriction in patients with cardiovascular dis- ease should be emphasized.
ACKNOWLEDGMENTS
The authors thank all participants and investigators in Korean National Health and Nutrition Examination Survey.
DISCLOSURE
The authors have no conflicts of interest.
ORCID
Jeonghwan Lee http://orcid.org/0000-0003-3199-635X Hajeong Lee http://orcid.org/0000-0002-1873-1587 Kiwon Kim http://orcid.org/0000-0002-2885-0053 Jung Hwan Park http://orcid.org/0000-0002-8737-0084 Jieun Oh http://orcid.org/0000-0001-9429-9602
REFERENCES
1. Elliott P, Walker LL, Little MP, Blair-West JR, Shade RE, Lee DR, Rou- quet P, Leroy E, Jeunemaitre X, Ardaillou R, et al. Change in salt intake affects blood pressure of chimpanzees: implications for human popula- tions. Circulation 2007; 116: 1563-8.
2. Intersalt: an international study of electrolyte excretion and blood pres- sure. Results for 24 hr urinary sodium and potassium excretion. Intersalt Cooperative Research Group. BMJ 1988; 297: 319-28.
3. Lewington S, Clarke R, Qizilbash N, Peto R, Collins R. Age-specific rele- vance of usual blood pressure to vascular mortality: a meta-analysis of individual data for one million adults in 61 prospective studies. Lancet 2002; 360: 1903-13.
4. Beaglehole R, Bonita R, Horton R, Adams C, Alleyne G, Asaria P, Baugh V, Bekedam H, Billo N, Casswell S, et al. Priority actions for the non- communicable disease crisis. Lancet 2011; 377: 1438-47.
5. World Health Organization. Guideline: Sodium intake for adults and children. Geneva: World Health Organization, 2012.
6. McGuire S. U.S. Department of Agriculture and U.S. Department of Health and Human Services, Dietary Guidelines for Americans, 2010.
7th ed. Washington DC: U.S. Government Printing Office, January 2011.
Adv Nutr 2011; 2: 293-4.
7. He FJ, MacGregor GA. Salt reduction lowers cardiovascular risk: meta- analysis of outcome trials. Lancet 2011; 378: 380-2.
8. US Department of Health and Human Services. Dietary guidelines for Americans 2010. US Department of Agriculture. 7th ed. Washington DC:
US Government Printing Office, 2010.
9. Korea Centers for Disease Control and Prevention. The forth Korea Na- tional Health and Nutrition Examination Survey (KNHANES IV-3): Ko- rea Health Statistics, 2009.
10. Tanaka T, Okamura T, Miura K, Kadowaki T, Ueshima H, Nakagawa H, Hashimoto T. A simple method to estimate populational 24-hr urinary sodium and potassium excretion using a casual urine specimen. J Hum Hypertens 2002; 16: 97-103.
11. Sacks FM, Svetkey LP, Vollmer WM, Appel LJ, Bray GA, Harsha D, Obarzanek E, Conlin PR, Miller ER 3rd, Simons-Morton DG, et al. Ef- fects on blood pressure of reduced dietary sodium and the Dietary Ap- proaches to Stop Hypertension (DASH) diet. DASH-Sodium Collabora- tive Research Group. N Engl J Med 2001; 344: 3-10.
12. Kannel WB. Blood pressure as a cardiovascular risk factor: prevention and treatment. JAMA 1996; 275: 1571-6.
13. Lawes CM, Rodgers A, Bennett DA, Parag V, Suh I, Ueshima H, Mac- Mahon S. Blood pressure and cardiovascular disease in the Asia Pacific region. J Hypertens 2003; 21: 707-16.
14. He FJ, MacGregor GA. Reducing population salt intake worldwide: from evidence to implementation. Prog Cardiovasc Dis 2010; 52: 363-82.
15. He FJ, Li J, Macgregor GA. Effect of longer-term modest salt reduction on blood pressure. Cochrane Database Syst Rev 2013; 4: CD004937.
16. Zhou B, Wang HL, Wang WL, Wu XM, Fu LY, Shi JP. Long-term effects of salt substitution on blood pressure in a rural north Chinese population.
J Hum Hypertens 2013; 27: 427-33.
17. Holbrook JT, Patterson KY, Bodner JE, Douglas LW, Veillon C, Kelsay JL, Mertz W, Smith JC Jr. Sodium and potassium intake and balance in adults consuming self-selected diets. Am J Clin Nutr 1984; 40: 786-93.
18. Tsuchihashi T, Kai H, Kusaka M, Kawamura M, Matsuura H, Miura K, Ando K, Maruyama S, Hayabuchi H, Takagi Y, et al. [Scientific state- ment] Report of the Salt Reduction Committee of the Japanese Society of Hypertension (3) Assessment and application of salt intake in the man- agement of hypertension. Hypertens Res 2013; 36: 1026-31.