Comparison of Acarbose and Voglibose in Diabetes Patients Who Are Inadequately Controlled with Basal Insulin Treatment:
Randomized, Parallel, Open-Label, Active-Controlled Study
We studied the efficacy and safety of acarbose in comparison with voglibose in type 2 diabetes patients whose blood glucose levels were inadequately controlled with basal insulin alone or in combination with metformin (or a sulfonylurea). This study was a 24- week prospective, open-label, randomized, active-controlled multi-center study.
Participants were randomized to receive either acarbose (n = 59, 300 mg/day) or voglibose (n = 62, 0.9 mg/day). The mean HbA1c at week 24 was significantly decreased
approximately 0.7% from baseline in both acarbose (from 8.43% ± 0.71% to
7.71% ± 0.93%) and voglibose groups (from 8.38% ± 0.73% to 7.68% ± 0.94%). The mean fasting plasma glucose level and self-monitoring of blood glucose data from 1 hr before and after each meal were significantly decreased at week 24 in comparison to baseline in both groups. The levels 1 hr after dinner at week 24 were significantly decreased in the acarbose group (from 233.54 ± 69.38 to 176.80 ± 46.63 mg/dL) compared with the voglibose group (from 224.18 ± 70.07 to 193.01 ± 55.39 mg/dL). In conclusion, both acarbose and voglibose are efficacious and safe in patients with type 2 diabetes who are inadequately controlled with basal insulin. (ClinicalTrials.gov number, NCT00970528) Keywords: Diabetes Mellitus, Type 2; Acarbose; Voglibose
Mi Young Lee,1 Dong Seop Choi,2 Moon Kyu Lee,3 Hyoung Woo Lee,4 Tae Sun Park,5 Doo Man Kim,6 Choon Hee Chung,1 Duk Kyu Kim,7 In Joo Kim,8 Hak Chul Jang,9 Yong Soo Park,10 Hyuk Sang Kwon,11 Seung Hun Lee,12 and Hee Kang Shin12
1Division of Endocrinology & Metabolism, Department of Internal Medicine, Yonsei University Wonju College of Medicine, Wonju; 2Division of Endocrinology & Metabolism, Department of Internal Medicine, Korea University College of Medicine, Seoul; 3Division of Endocrinology &
Metabolism, Department of Internal Medicine, Samsung Medical Center, Sungkyunkwan University School of Medicine, Seoul; 4Division of
Endocrinology & Metabolism, Department of Internal Medicine, Yeungnam University College of Medicine, Daegu; 5Division of Endocrinology &
Metabolism, Department of Internal Medicine, Chonbuk National University Medical School, Jeonju; 6Division of Endocrinology & Metabolism, Department of Internal Medicine, Hallym University College of Medicine, Seoul; 7Division of
Endocrinology & Metabolism, Department of Internal Medicine, Dong-A University College of Medicine, Busan; 8Division of Endocrinology &
Metabolism, Department of Internal Medicine, Pusan National University College of Medicine, Busan; 9Division of Endocrinology & Metabolism, Department of Internal Medicine, Seoul National University Bundang Hospital, Seoul National University College of Medicine, Seongnam;
10Division of Endocrinology & Metabolism, Department of Internal Medicine, Hanyang University College of Medicine, Seoul; 11Division of Endocrinology & Metabolism, Department of Internal Medicine, The Catholic University of Korea, Seoul; 12Bayer Korea Ltd., Seoul, Korea
Received: 1 August 2013 Accepted: 31 October 2013 Address for Correspondence:
Dong Seop Choi, MD
Division of Endocrinology & Metabolism, Department of Internal Medicine, Korea University Anam Hospital, 73 Inchon-ro, Seongbuk-gu, Seoul 136-705, Korea
Tel: +82.2-920-5114, Fax: +82.2-953-9355 E-mail: [email protected]
The work was funded by a research grant from the Bayer Korea Ltd (2009.09.22-2012.09.18).
http://dx.doi.org/10.3346/jkms.2014.29.1.90 • J Korean Med Sci 2014; 29: 90-97
INTRODUCTION
Given the progressive nature of diabetes and the substantial evidence supporting the beneficial effects of insulin regimens, it is imperative that patients utilize insulin thera- py to maintain glycemic control as well as reduce morbidity and mortality rates associ- ated with diabetes and its related complications (1-3). The American Diabetes Associa- tion (ADA) and European Association for the Study of Diabetes (EASD) recommend that an HbA1c≥ 7.0% should serve as a call to action, using insulin therapy to reverse the inevitable deterioration in glycemic control. Initial treatment targeting fasting blood glucose is expected to facilitate reaching treatment goals and is the recommended ap- proach for early insulin initiation (4, 5). A once-daily injection of basal insulin, with once-daily monitoring of blood glucose, provides a simple-to-manage cornerstone of therapy.
However, basal insulin treatment, such as insulin glargine and detemir, has less ef- fect on postprandial glucose level management compared with fasting glucose levels (6). Furthermore, a recent study suggests that a gradual loss in daytime postprandial glycemic control precedes a stepwise deterioration in nocturnal fasting periods in wors- ening diabetes, whereas nocturnal fasting glycemic control remains essentially un- changed as long as HbA1c levels remain < 8% (7). Once fasting glucose is tightly con- trolled with basal insulin, adding oral hypoglycemic agents or short-acting insulin can help achieve the target goal of HbA1c through improving postprandial blood glucose excursion (8, 9).
Acarbose and voglibose are α-glucosidase inhibitors that typically reduce postpran-
dial glucose concentrations by delaying carbohydrate digestion and therefore absorption in the gut, and can be a useful first- line treatment in the patients who have a combination of slight- ly raised basal glucose concentrations and marked postprandi- al hyperglycemia (10-14). α-glucosidase inhibitors have been used in Asian patients with type 2 diabetes as first-line and sec- ond-line therapies targeting the postprandial glucose level, and often used with a basal insulin regimen when basal insulin treatment alone did not result in glycemic control because they had eaten a high carbohydrate containing meal. However, there are no direct comparison data between acarbose and voglibose regarding glycemic control and side effects when added to bas- al insulin treatment in patients with type 2 diabetes.
In this study, we evaluated the efficacy and safety of acarbose and voglibose in type 2 diabetes patients whose blood glucose levels were inadequately controlled with insulin glargine (or in- sulin detemir) alone or in combination with metformin (or a sulfonylurea).
MATERIALS AND METHODS Study population and design
This study was a prospective, parallel group, open-label, ran- domized, active-controlled clinical trial that was conducted at 11 study centers in Korea. Patients with type 2 diabetes aged 18- 79 yr who were already taking insulin glargine (or insulin de- temir) alone or in combination with metformin (or a sulfonyl- urea) for at least 3 months prior to screening, and had an HbA1C
> 7.0% and ≤ 10.0%, were eligible to be randomized.
Eligible patients gave informed consent and were randomized in a ratio of 1:1 to receive acarbose (up to 100 mg three times daily) or voglibose (up to 0.3 mg three times daily). All subjects were instructed to keep their metformin and sulfonylurea dose throughout the study.
Of the 156 subjects screened for this study, 124 subjects were randomized to either the acarbose or voglibose group. A total of 32 subjects was screened but not randomized. Of these 32 sub- jects, 29 were excluded for unmet eligibility criteria (24 for in- clusion and 5 for exclusion criteria). The other 3 subjects were excluded for the following reasons: one subject was recommend- ed to be hospitalized for blood glucose control by the investiga- tor, another was not able to be contacted and was withdrawn from the study due to problems related to patient’s diary, and the final subject was withdrawn with consent.
Among 124 randomized subjects, 2 subjects in the acarbose group whose medication compliance was not reported were regarded as non-treated with the study drug. A total of 122 sub- jects (60 in the acarbose group and 62 in the voglibose group) who were treated with study medications were included in the safety set. Of those subjects who were included in the safety set, one subject in the treatment group was excluded from the mod-
ified intent-to-treat (mITT) set due to no HbA1c values after treatment. A total of 121 subjects (59 in the acarbose group and 62 in the voglibose group) were included in the mITT set. A to- tal of 102 subjects (47 in the acarbose group and 55 in the vogli- bose group) who complied with all study protocol criteria and the study medication regimen was included in the per-protocol (PP) set.
Efficacy and safety evaluation
The primary endpoint was mean HbA1c change from baseline to week 24. Secondary endpoints were diurnal glucose concen- tration checked by self-monitoring of blood glucose (SMBG), fasting plasma glucose level, lipid parameters including total cholesterol, low-density lipoprotein cholesterol (LDL-C), high- density lipoprotein cholesterol (HDL-C), triglycerides (TG), apolipoprotein A (Apo A), apolipoprotein B (Apo B), as well as body weight, body mass index (BMI), and high sensitivity C re- active protein (hs-CRP) level. The HbA1c level was evaluated at 0, 8, 24 weeks, and fasting glucose and SMBG information were collected from patient diary at every visit. The other parameters were checked at baseline and week 24. To determine efficacy parameters, all laboratory determinations were performed by a central laboratory, Seoul Clinical Laboratories (SCL) in Korea.
HbA1C was determined by turbidimetric inhibition immunoas- say (NGSP, Roche Diagnostics, Indianapolis, IN, USA). Lipid profiles were done by enzymatic colorimetic assays (HITACHI, Tokyo, Japan) and hs-CRP level was determined by immuno- turbidimetric assays (HITACHI).
Subjects tested six-point SMBG profiles (pre-meal and 1 hr post-meal) using the same type of blood-glucose meter (pro- vided by investigators) on any 2 days within a week and record- ed it in a patient diary prior to every visit (CareSens, i-sens, Seoul, Korea). Subjects checked preprandial glucose levels 1 hr before each meal and postprandial glucose levels 1 hr after the begin- ning of each meal. At every visit, we performed physical exami- nations and checked whether patients experienced hypoglyce- mic events. Hypoglycemia was defined as blood glucose con- centrations less than 50 mg/dL with or without symptoms of hypoglycemia. Hypoglycemia symptoms included fatigue, sweat- ing, palpitation, tremor, confusion, seizure, and loss of consci- ousness. Severe hypoglycemia was defined as an event with symptoms consistent with hypoglycemia which the subject re- quired assistance from another person and was associated with prompt recovery after oral carbohydrates, or intravenous glu- cose or glucagon administration. Subjects were asked to self- monitor glucose values whenever they experienced symptoms that might have resulted from hypoglycemia.
To evaluate adverse events, blood pressure, electrocardiogra- phy, hematologic parameters, blood chemistry, and urine anal- yses were also monitored.
Statistical methods
The primary efficacy variable was mean HbA1c change from baseline to week 24 in the modified intent to treat (mITT) pop- ulation with last observation carried forward for the patients who discontinued prematurely, comparing acarbose group with voglibose group. Subjects included in the mITT analysis received at least one dose of study medication, had efficacy data at baseline, and had at least one post-baseline measure- ment of the respective variable. Sample size calculation was based on a margin of non-inferiority, the value of 0.5, in adjust- ed mean change from baseline to HbA1c and standard deviation of difference between groups of 1.0. We calculated that 51 pa- tients per group were needed to demonstrate non-inferiority of acarbose group (alpha 0.05, one-sided, 80% power).
Statistics were performed using the SAS 9.1 package. Data were presented as mean ± SD for continuous variables and as frequency and percentage for categorical variables, unless oth- erwise specified. Baseline characteristics and safety evaluation were compared using two sample t-test and Pearson’s chi-square test, as appropriate. Primary and secondary variables were ana- lyzed using an ANCOVA model with treatment and pooled cen- ter as the classification variables and baseline value as the co- variate. Except for efficacy analysis, all statistical analysis for the baseline character and safety evaluation was performed by us- ing two-sided test and at 5% level of significance. Efficacy anal- ysis was performed by using one-sided test and at 5% level of significance. And all P value were considered statistically signif-
icant when P < 0.05. Safety analyses were performed in the all treated patients, which included randomized patients who re- ceived at least one dose of study medication. Safety parameters included any adverse events, hypoglycemia, laboratory safety findings, vital signs and physical examination.
Ethics statement
This study protocol was reviewed and approved by the institu- tional review board of Korea University Anam Hospital (AN09158) and other involved centers. The study protocol was registered at the ClinicalTrials.gov (NCT00970528). Informed consent form explaining the procedures of the study and potential hazards was reviewed and approved by the board. All participants sub- mitted the informed consent.
RESULTS
Baseline characteristics of the study subjects
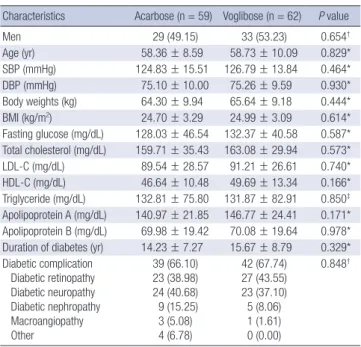
The demographics and clinical characteristics of the random- ized subjects are summarized in Table 1. For the acarbose group, 49.2% of the subjects were male, the mean age was 58.4 yr, and 66.1% of subjects had diabetic complications. For voglibose group, 53.2% of subjects were male, the mean age was 58.7 yr, and 67.7% of subjects had diabetic complications. The demo- graphics and baseline characteristics of acarbose group were comparable to voglibose group, and there were no significant differences between groups. Most subjects (91.7% of the acar- bose group and 98.4% of the voglibose group) had comorbidi- ties such as hypertension, dyslipidemia, hepatic steatosis, and gastritis (data not shown).
Change of HbA1c
Table 2 presents the change in HbA1c from baseline to week 24 by group as well as the difference between the groups. At week 24, the mean HbA1c decreased from 8.43% ± 0.71% to 7.71% ± 0.93% in acarbose group and from 8.38% ± 0.73% to 7.68% ± 0.94% in voglibose group, respectively. The difference in least square means (LSM) between groups was -0.01% without sig- nificance (90% confidence interval [CI] -0.27, 0.24; P = 0.467).
The upper limit of the 90% CI is 0.24 did not exceed 0.5, there- Table 1. Demographics and other baseline characteristics
Characteristics Acarbose (n = 59) Voglibose (n = 62) P value
Men 29 (49.15) 33 (53.23) 0.654†
Age (yr) 58.36 ± 8.59 58.73 ± 10.09 0.829*
SBP (mmHg) 124.83 ± 15.51 126.79 ± 13.84 0.464*
DBP (mmHg) 75.10 ± 10.00 75.26 ± 9.59 0.930*
Body weights (kg) 64.30 ± 9.94 65.64 ± 9.18 0.444*
BMI (kg/m2) 24.70 ± 3.29 24.99 ± 3.09 0.614*
Fasting glucose (mg/dL) 128.03 ± 46.54 132.37 ± 40.58 0.587*
Total cholesterol (mg/dL) 159.71 ± 35.43 163.08 ± 29.94 0.573*
LDL-C (mg/dL) 89.54 ± 28.57 91.21 ± 26.61 0.740*
HDL-C (mg/dL) 46.64 ± 10.48 49.69 ± 13.34 0.166*
Triglyceride (mg/dL) 132.81 ± 75.80 131.87 ± 82.91 0.850‡ Apolipoprotein A (mg/dL) 140.97 ± 21.85 146.77 ± 24.41 0.171*
Apolipoprotein B (mg/dL) 69.98 ± 19.42 70.08 ± 19.64 0.978*
Duration of diabetes (yr) 14.23 ± 7.27 15.67 ± 8.79 0.329*
Diabetic complication Diabetic retinopathy Diabetic neuropathy Diabetic nephropathy Macroangiopathy Other
39 (66.10) 23 (38.98) 24 (40.68) 9 (15.25) 3 (5.08) 4 (6.78)
42 (67.74) 27 (43.55) 23 (37.10) 5 (8.06) 1 (1.61) 0 (0.00)
0.848†
Data are presented as the means ± SD, or No. (%). *Unpaired t-test; †Pearson’s chi- square test; ‡Wilcoxon rank sum test. SBP, systolic blood pressure; DBP, diastolic blood pressure, BMI, body mass index; LDL-C, low dense lipoprotein cholesterol, HDL-C, high dense lipoprotein cholesterol. Missing [Subject]: Acarbose-(Fasting glucose[1]), Voglibose-(BMI [1]).
Table 2. Change of HbA1c from baseline data
Parameters Acarbose (n = 59) Voglibose (n = 62) P value
Baseline (%) 8.43 ± 0.71 8.38 ± 0.73
Week 24 (%) 7.71 ± 0.93 7.68 ± 0.94
Change -0.72 ± 0.98 -0.70 ± 0.82
P value (within group) < 0.001* < 0.001*
Difference of LSM (90% CI)
(between group ) -0.01 (-0.27-0.24) 0.467†
Data are presented as the means ± SD. Change = week 24-baseline. *Paired t-test;
†ANCOVA model with treatment, baseline value as covariate and pooled center as factors (one-side test). LSM, Least squares mean.
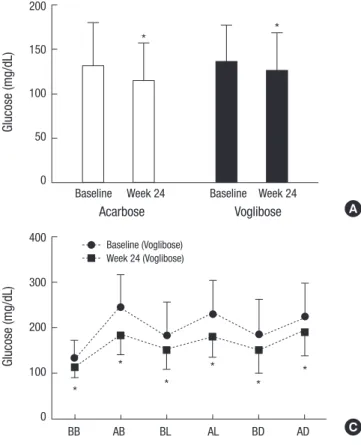
Fig. 1. Fasting plasma glucose and mean glucose levels checked by 6 points during a day. (A) The mean fasting plasma glucose level at week 24 decreased by 16.27 ± 59.63 mg/dL in acarbose group and 10.44 ± 42.30 mg/dL in voglibose group. There were no statistically significant differences between the groups in changes in fasting glucose levels from baseline to week 24. (B) The glucose levels of 6 points at week 24 in acarbose group. (C) The glucose levels of 6 points at week 24 in voglibose group. The glucose levels of all time points significantly decreased compared with baseline within each acarbose and voglibose groups. Only those of 1 hr after dinner at week 24 significantly decreased in acarbose group compared with voglibose group.
BB, before breakfast; AB, after breakfast; BL, before lunch; AL, after lunch; BD, be- fore dinner; AD, after dinner. *P < 0.05; Change from baseline.
Glucose (mg/dL)
Acarbose Voglibose
Baseline Week 24 Baseline Week 24 200
150 100 50 0
* *
A B
C
Glucose (mg/dL)
BB AB BL AL BD AD
400 300 200 100 0
*
*
*
*
*
* Baseline (Acarbose)
Week 24 (Acarbose)
Glucose (mg/dL)
BB AB BL AL BD AD
400 300 200 100 0
*
*
*
*
* *
Baseline (Voglibose) Week 24 (Voglibose)
Table 3. Fasting plasma glucose and diurnal glucose concentration (mITT analysis)
Glucose level at Acarbose (n = 59) Voglibose (n = 62) P value
(between group)
No. Mean ± SD No. Mean ± SD
Fasting (mg/dL) Baseline Week 24 Change
P value (within group)
Difference of LSM (90% CI) (between group ) 59 59 59
131.63 ± 48.55 115.36 ± 41.88 -16.27 ± 59.63
0.041*
62 62 62
136.16 ± 41.33 125.73 ± 43.10 -10.44 ± 42.30
0.057*
0.112† 1 hr before dinner
(mg/dL) Baseline
Week 24 Change
P value (within group)
Difference of LSM (90% CI) (between group ) 54 58 53
170.57 ± 75.32 139.64 ± 36.23 -31.80 ± 67.66
0.001*
57 61 56
177.19 ± 78.80 151.24 ± 49.94 -25.02 ± 78.92
0.086†
0.021*
1 hr after dinner
(mg/dL) Baseline
Week 24 Change
P value (within group)
Difference of LSM (90% CI) (between group ) 57 58 56
233.54 ± 69.38 176.80 ± 46.63 -55.99 ± 68.93
< 0.001*
56 61 55
224.18 ± 70.07 193.01 ± 55.39 -33.52 ± 73.24
0.040†
0.001*
Data are presented as the number of subjects, means and SD. Change = week 24-Baseline. *Paired t-test; †ANCOVA model with treatment, baseline value as covariate and pooled center as factors (one-side test). LSM, Least squares mean.
-9.11 (-23.88-5.65)
-10.66 (-26.03-4.70)
-15.88 (-33.72-1.96) fore the non-inferiority of acarbose group declared.
Glycemic measurements
The fasting glucose level and the change in self-monitored di- urnal blood glucose levels from baseline to week 24 by group, as well as the differences between groups, are shown in Fig. 1.
The mean fasting plasma glucose level at week 24 decreased by 16.27 ± 59.63 mg/dL in acarbose group and 10.44 ± 42.30 mg/
dL in voglibose group (Fig. 1A). The difference in LSM between groups was -9.11 mg/dL but without significance (90% CI, -21.47-
3.25; P = 0.112). At all time-points in SMBG measurement, the changes in blood glucose level from baseline to week 24 were significant in both treatment groups (Table 3, Fig. 1B). There were no significant differences between treatment groups, ex- cept 1 hr after dinner time-point. At week 24, the SMBG values 1 hr after dinner decreased by 55.99 ± 68.93 (Median, -52.25;
Ran ge, -295.00-113.50) mg/dL in acarbose group and 33.52 ± 73.24 (Median, -19.50; Range, -267.00-100.00) mg/dL in voglib- ose group compared to baseline. The difference of LSM between groups was -15.88 mg/dL (90% CI, -30.81-0.95) and was statisti-
Table 4. Changes in efficacy variables from baseline to week 24
Variables Acarbose (n = 59) Voglibose (n = 62)
P value†
No. Mean ± SD Median (Range) No. Mean ± SD Median (Range)
Body weight (kg) 59 -0.67 ± 1.89* -0.70 (-7.20-2.90) 62 -0.87 ± 1.81* -0.80 (-5.10-3.50) 0.291
BMI (kg/m2) 59 -0.26 ± 0.71* -0.26 (-2.68-0.98) 61 -0.32 ± 0.68* -0.31 (-1.92-1.51) 0.332
Total cholesterol (mg/dL) 56 5.63 ± 29.66 4.50 (-69.00-104.00) 62 -1.29 ± 27.02 -3.00 (-97.00-46.00) 0.119
LDL-C (mg/dL) 56 5.20 ± 25.01 3.00 (-62.00-101.00) 62 -0.29 ± 23.58 -2.00 (-87.00-42.00) 0.111
HDL-C (mg/dL) 56 1.84 ± 8.54 1.00 (-19.00-38.00) 62 0.19 ± 6.91 1.50 (-26.00-16.00) 0.118
Non-HDL-C (mg/dL) 56 3.79 ± 27.58 1.00 (-59.00-107.00) 62 -1.48 ± 25.50 -2.00 (-87.00-59.00) 0.267
TG (mg/dL) 56 -5.43 ± 64.13 -7.00 (-182.00-194.00) 62 -8.48 ± 58.54 -5.00 (-218.00-156.00) 0.341
ApoA (mg/dL) 56 -2.68 ± 17.76 -4.00 (-51.00-37.00) 62 -4.00 ± 16.99 -4.50 (-48.00-32.00) 0.493
ApoB (mg/dL) 56 8.32 ± 17.46* 6.00 (-18.00-64.00) 62 4.21 ± 16.43* 4.00 (-45.00-41.00) 0.073
CRP (mg/L) 56 0.34 ± 7.27 0.10 (-28.30-34.60) 62 0.03 ± 5.90 -0.10 (-29.50-30.60) 0.183
Data are presented as the number of subjects, means ± SD, Median and Range (min-max). *P < 0.05; Change from baseline in group; †ANCOVA model with treatment, base- line value as covariate and site as factors (one-side test). BMI, body mass index; TC, total cholesterol; TG, triglyceride; LDL-C, low dense lipoprotein cholesterol; HDL-C, high dense lipoprotein cholesterol; non-HDL-C, non-high dense lipoprotein cholesterol; ApoA, apolipoprotein A; ApoB, apolipoprotein B; CRP, C-reactive protein.
Table 5. Adverse events (safety set) by acarbose and voglibose Adverse events
Acarbose
(n = 59) Voglibose
(n = 62) P value No. (%) No. (%)
Serious adverse events (SAE) 2 (3.3) 4 (6.5) 0.680‡ Gastrointestinal adverse events 20 (33.3) 16 (25.8) 0.362†
Any hypoglycemia 7 (11.7) 6 (9.7) 0.722†
Discontinued due to adverse events 1 (1.7) 1 (1.6) 1.000‡ Adverse drug reaction*
Gastrointestinal disorders Abdominal discomfort Dyspepsia Flatulence
Gastrointestinal disorder Abdominal distension Diarrhea
Nausea Abdominal pain General disorders
Chills Asthenia Fatigue Hunger Metabolic disorders
Hypoglycemia Eye disorders
Retinopathy
Nervous system disorders Dizziness
Tremor
Respiratory disorders Dyspnea Skin disorders
Hyperhidrosis
10 (16.7) 9 (15.0) 2 (3.3) 2 (3.3) 2 (3.3) 1 (1.7) 1 (1.7) 1 (1.7) 1 (1.7) 0 (0.0) 1 (1.7) 1 (1.7) 0 (0.0) 0 (0.0) 0 (0.0) 3 (5.0) 3 (5.0) 1 (1.7) 1 (1.7) 1 (1.7) 1 (1.7) 1 (1.7) 0 (0.0) 0 (0.0) 0 (0.0) 0 (0.0)
6 (9.7) 2 (3.2) 1 (1.6) 0 (0.0) 0 (0.0) 0 (0.0) 1 (1.6) 0 (0.0) 0 (0.0) 1 (1.6) 3 (4.8) 0 (0.0) 1 (1.6) 1 (1.6) 1 (1.6) 0 (0.0) 0 (0.0) 0 (0.0) 0 (0.0) 0 (0.0) 0 (0.0) 0 (0.0) 1 (1.6) 1 (1.6) 1 (1.6) 1 (1.6)
0.253†
*Causal relationship-Related; †Pearson’s chi-square test; ‡Fisher’s exact test.
cally significant (P = 0.040).
Anthropometric measurements, lipid parameters, and hs-CRP
Table 4 presents the changes in body weight, BMI, lipid profiles and hs-CRP levels from baseline to week 24 by group as well as the difference between groups in mITT set. The mean body weight at week 24 significantly decreased by 0.67 ± 1.89 kg in acarbose group and 0.87 ± 1.81 kg in the voglibose group com- pared to baseline, respectively. The mean BMI also significantly decreased by 0.26 ± 0.71 kg/m2 in the acarbose group and 0.32
± 0.68 kg/m2 in voglibose group, respectively. Both body weight and BMI differences between two groups were not statistically significant.
The change in lipid parameter levels (total cholesterol, LDL- C, HDL-C, non-HDL-C, triglycerides, and Apo- A, B) from base- line to week 24 by group, as well as the differences between groups, is shown in Table 4. The changes of total cholesterol, triglyceride, LDL cholesterol, HDL cholesterol, and non-HDL cholesterol levels between baseline and week 24 in both acar- bose and voglibose groups could not show the significant dif- ferences. The mean Apo B level increased by 8.32 ± 17.46 (Me- dian, 6.00; Range, -18.00-64.00) mg/dL and 4.21 ± 16.43 (Medi- an, 4.00; Range, -45.00-41.00) mg/dL in acarbose and voglibose groups, respectively. The differences of LSM between groups in all lipid parameters were not statistically significant. The change of hs-CRP level from baseline to week 24 did not show any dif- ferences within and between the two groups.
Adverse events
The adverse events reported during study are summarized in Table 5. A total of 137 adverse events in 44/60 (73.3%) subjects in acarbose group and 143 adverse events in 42/62 (67.7%) sub- jects in voglibose group were reported during the study. Of those, 125 events in 43/60 (71.7%) subjects in the acarbose group and 132 events in 41/62 (66.1%) subjects in voglibose group were
reported after treatment with the study medications. Among them, 22 events reported in 10/60 (16.7%) subjects in the acar- bose group and 8 events reported in 6/62 (9.8%) subjects in vo- glibose group were judged to be related to the study drugs. Gas- trointestinal side effects were reported in 20/60 (33.3%) subjects and 16/62 (25.8%) subjects in acarbose and voglibose group, respectively.
No deaths occurred during the study. Serious adverse events (SAEs) were reported in 2/60 (3.3%) subjects in acarbose group and 4/62 (6.5%) subjects in voglibose group. In acarbose group, 2/60 (3.3%) subjects experienced two SAEs (pancreatic carci- noma in one subject and Escherichia sepsis in another subject).
In voglibose group, 4/62 (6.5%) subjects experienced four SAEs (one subject with each cartilage injury, radius fracture, malig- nant lung neoplasm, and varicose veins). None of the SAEs was assessed by the investigator as related to the study drug.
DISCUSSION
Alpha-glucosidase inhibitors (AGIs) may be used for patients with type 2 diabetes to target postprandial hyperglycemia by delaying absorption of carbohydrates (10, 11). Currently, four AGIs (acarbose, miglitol, voglibose, and emiglitate) have been used. Of these, acarbose is the most commonly prescribed. AGIs are much cheaper than many other newly developed medica- tions and therefore these drugs can be continued for long peri- ods of time (15). In particular, because AGIs lower the postpran- dial elevation of glucose and insulin levels (16), they may be used as an additional therapy to basal insulin, which targets control of fasting blood glucose but not postprandial glucose excursion. AGIs have been widely used in Asian patients with type 2 diabetes who consume high carbohydrate diets (17-20).
In this study, the mean HbA1c level at week 24 decreased sig- nificantly by approximately 0.7% from baseline in both acar- bose and voglibose groups. There was no statistically significant difference between two groups in the change of HbA1c level. We consider the reduction in HbA1c level after the addition of acar- bose or voglibose might be derived not only from decreased postprandial glucose levels but also from decreased fasting glu- cose level, although the mean changes in SMBG levels 1 hr after the meal were larger than 1 hr before the meal. In many studies (16, 21-23), AGIs reduce both fasting and postprandial glucose levels, a phenomenon that the authors suggest was due to a greater reduction in postprandial hyperglycemia that second- arily leads to a decreased fasting plasma glucose concentration.
In our study, the mean changes in SMBG levels were not signif- icantly different between the groups, except the SMBG level 1 hr after dinner. The mean change in SMBG levels 1 hr after din- ner in acarbose group was larger than in voglibose group. Based on these results, both drugs were regarded to have similar ef- fects on glycemic control. However, the effects of acarbose on postprandial glucose were slightly superior to those of voglibose.
In this study, both acarbose and voglibose reduced body wei- ght, which is thought to result from improving the postprandial hyperinsulinemia that causes weight gain (16, 23, 24). Although several studies have reported that AGIs have neutral effects on body weight (25), many other studies and latest meta-analyses showed that AGIs positively affect body weight change due to
decreased caloric absorption and less food intake as a result of gastrointestinal adverse effects (26-28).
Upon examining the lipid profiles, ApoA showed a tendency to decrease in both groups. Total cholesterol, HDL-C, non-HDL- C, and LDL-C did not change significantly in both group. How- ever, both acarbose and voglibose significantly elevated the ApoB level, which is associated with LDL-cholesterol. Hegele et al. (29) also reported ApoB elevation after acarbose treatment, which is thought to be caused by chronically increased acetate production due to fermentation of non-absorbed carbohydra- tes, similar to lactulose ingestion (30, 31). However, the exact mechanism has not yet been studied and requires further in- vestigation. Currently available studies on cardiovascular dis- ease (CVD) contain no evidence of an increased CVD risk asso- ciated with AGI use, despite the elevation in ApoB (29, 32-34).
In addition, CRP, which is a marker of CVD, was not elevated after using these medications. These results suggest that the drugs exert greater influence on secondary changes due to re- duced blood glucose rather than directly influencing dyslipid- emia.
The most common reported side effect of AGIs is abdominal flatulence, and other gastrointestinal side effects are frequently found (12, 35). Gastrointestinal adverse effects (flatulence, diar- rhea, etc.) were the most frequent side effect in this study as well, but there was only a single case in each study group result- ing in discontinuation of the medication because of an adverse event. Therefore, there were no major problems using the drugs.
Hypoglycemia was reported in 11.7% of subjects in the acar- bose group and 9.7% of subjects in the voglibose group. Hypo- glycemic events in this study do not appear to have been caused by AGIs because the frequencies are similar to or lower than that reported in studies on glargine or detemir (36-38). Further- more, there is a report that acarbose usage may reduce neces- sary insulin dose, therefore minimizing the risk of hypoglyce- mia and weight gain (39). Thus, both drugs seem to have no se- rious side effects and may be safely used.
Taken together, these data showed that the addition of α-glu- cosidase inhibitors could help lower the levels of HbA1c and blood glucose in patients with type 2 diabetes who were inade- quately controlled with insulin glargine (or insulin detemir) alone or in combination with metformin (or a sulfonylurea). In conclusion, both acarbose and voglibose are comparably effec- tive on glycemic control of HbA1c and blood glucose levels.
DISCLOSURE
The authors have no conflicts of interest to disclose. The co-au- thors, Seung Hun Lee and Hee Kang Shin, are employee of the funding pharmaceutical the Bayer Korea Ltd, but did not involve data production or writing. They have assisted only the study procedure. Both Seung Hun Lee and Hee Kang Shin do not hold
stock in the Bayer group.
REFERENCES
1. Nathan DM, Cleary PA, Backlund JY, Genuth SM, Lachin JM, Orchard TJ, Raskin P, Zinman B; Diabetes Control and Complications Trial/Epi- demiology of Diabetes Interventions and Complications (DCCT/EDIC) Study Research Group. Intensive diabetes treatment and cardiovascular disease in patients with type 1 diabetes. N Engl J Med 2005; 353: 2643- 53.
2. Bergenstal RM, Johnson M, Powers MA, Wynne A, Vlajnic A, Holland- er P, Rendell M. Adjust to target in type 2 diabetes: comparison of a sim- ple algorithm with carbohydrate counting for adjustment of mealtime insulin glulisine. Diabetes Care 2008; 31: 1305-10.
3. Holman RR, Farmer AJ, Davies MJ, Levy JC, Darbyshire JL, Keenan JF, Paul SK; 4-T Study Group. Three-year efficacy of complex insulin regi- mens in type 2 diabetes. N Engl J Med 2009; 361: 1736-47.
4. Inzucchi SE, Bergenstal RM, Buse JB, Diamant M, Ferrannini E, Nauck M, Peters AL, Tsapas A, Wender R, Matthews DR. Management of hy- perglycaemia in type 2 diabetes: a patient-centered approach: position statement of the American Diabetes Association (ADA) and the Europe- an Association for the Study of Diabetes (EASD). Diabetologia 2012; 55:
1577-96.
5. Inzucchi SE, Bergenstal RM, Buse JB, Diamant M, Ferrannini E, Nauck M, Peters AL, Tsapas A, Wender R, Matthews DR. Management of hy- perglycemia in type 2 diabetes: a patient-centered approach: position statement of the American Diabetes Association (ADA) and the Europe- an Association for the Study of Diabetes (EASD). Diabetes Care 2012; 35:
1364-79.
6. Bretzel RG, Nuber U, Landgraf W, Owens DR, Bradley C, Linn T. Once- daily basal insulin glargine versus thrice-daily prandial insulin lispro in people with type 2 diabetes on oral hypoglycaemic agents (APOLLO): an open randomised controlled trial. Lancet 2008; 371: 1073-84.
7. Monnier L, Colette C, Dunseath GJ, Owens DR. The loss of postprandial glycemic control precedes stepwise deterioration of fasting with worsen- ing diabetes. Diabetes Care 2007; 30: 263-9.
8. Abrahamson MJ, Peters A. Intensification of insulin therapy in patients with type 2 diabetes mellitus: an algorithm for basal-bolus therapy. Ann Med 2012; 44: 836-46.
9. Raccah D. Options for the intensification of insulin therapy when basal insulin is not enough in type 2 diabetes mellitus. Diabetes Obes Metab 2008; 10: 76-82.
10. Coniff R, Krol A. Acarbose: a review of US clinical experience. Clin Ther 1997; 9: 16-26.
11. Scheen AJ. Drug treatment of non-insulin-dependent diabetes mellitus in the 1990s: achievements and future developments. Drugs 1997; 54:
355-68.
12. Fujisawa T, Ikegami H, Inoue K, Kawabata Y, Ogihara T. Effect of two al- pha-glucosidase inhibitors, voglibose and acarbose, on postprandial hy- perglycemia correlates with subjective abdominal symptoms. Metabo- lism 2005; 54: 387-90.
13. Göke B, Fuder H, Wieckhorst G, Theiss U, Stridde E, Littke T, Kleist P, Arnold R, Lücker PW. Voglibose (AO-128) is an efficient alpha-glucosi- dase inhibitor and mobilizes the endogenous GLP-1 reserve. Digestion 1995; 56: 493-501.
14. Vichayanrat A, Ploybutr S, Tunlakit M, Watanakejorn P. Efficacy and safety of voglibose in comparison with acarbose in type 2 diabetic pa- tients. Diabetes Res Clin Pract 2002; 55: 99-103.
15. Roze S, Valentine WJ, Evers T, Palmer AJ. Acarbose in addition to exist- ing treatments in patients with type 2 diabetes: health economic analysis in a German setting. Curr Med Res Opin 2006; 22: 1415-24.
16. Hoffmann J, Spengler M. Efficacy of 24-week monotherapy with acar- bose, glibenclamide, or placebo in NIDDM patients: the Essen Study. Di- abetes Care 1994; 17: 561-6.
17. Internaltional Diabetes Federation. Global guideline for type 2 diabetes.
Available at http://www.idf.org/global-guideline-type-2-diabetes-2012 [accessed on 19 February 2013].
18. Service FJ, Hall LD, Westland RE, O’Brien PC, Go VL, Haymond MW, Rizza RA. Effects of size, time of day and sequence of meal ingestion on carbohydrate tolerance in normal subjects. Diabetologia 1983; 25: 316- 21.
19. Hwu CM, Ho LT, Fuh MM, Siu SC, Sutanegara D, Piliang S, Chan JC;
Asian Acarbose Study Group. Acarbose improves glycemic control in in- sulin-treated Asian type 2 diabetic patients: results from a multination- al, placebo-controlled study. Diabetes Res Clin Pract 2003; 60: 111-8.
20. Kim MK, Suk JH, Kwon MJ, Chung HS, Yoon CS, Jun HJ, Ko JH, Kim TK, Lee SH, Oh MK, et al. Nateglinide and acarbose for postprandial glu- cose control after optimizing fasting glucose with insulin glargine in pa- tients with type 2 diabetes. Diabetes Res Clin Pract 2011; 92: 322-8.
21. Coniff RF, Shapiro JA, Robbins D, Kleinfield R, Seaton TB, Beisswenger P, McGill JB. Reduction of glycosylated hemoglobin and postprandial hyperglycemia by acarbose in patients with NIDDM: a placebo-controll- ed dose-comparison study. Diabetes Care 1995; 18: 817-24.
22. Coniff RF, Shapiro JA, Seaton TB, Hoogwerf BJ, Hunt JA. A double-blind placebo-controlled trial evaluating the safety and efficacy of acarbose for the treatment of patients with insulin-requiring type II diabetes. Dia- betes Care 1995; 18: 928-32.
23. Hoffmann J, Spengler M. Efficacy of 24-week monotherapy with acar- bose, metformin, or placebo in dietary-treated NIDDM patients: the Es- sen-II Study. Am J Med 1997; 103: 483-90.
24. Hanefeld M, Fischer S, Schulze J, Spengler M, Wargenau M, Schollberg K, Fücker K. Therapeutic potentials of acarbose as first-line drug in NID- DM insufficiently treated with diet alone. Diabetes Care 1991; 14: 732-7.
25. Meneghini LF, Orozco-Beltran D, Khunti K, Caputo S, Damçi T, Liebl A, Ross SA. Weight beneficial treatments for type 2 diabetes. J Clin Endocri- nol Metab 2011; 96: 3337-53.
26. Gross JL, Kramer CK, Leitão CB, Hawkins N, Viana LV, Schaan BD, Pin- to LC, Rodrigues TC, Azevedo MJ; Diabetes and Endocrinology Meta- analysis Group (DEMA). Effect of antihyperglycemic agents added to metformin and a sulfonylurea on glycemic control and weight gain in type 2 diabetes: a network meta-analysis. Ann Intern Med 2011; 154:
672-9.
27. McIntosh B, Cameron C, Singh SR, Yu C, Ahuja T, Welton NJ, Dahl M.
Second-line therapy in patients with type 2 diabetes inadequately con- trolled with metformin monotherapy: a systematic review and mixed- treatment comparison meta-analysis. Open Med 2011; 5: e35-48.
28. Phung OJ, Scholle JM, Talwar M, Coleman CI. Effect of noninsulin anti- diabetic drugs added to metformin therapy on glycemic control, weight gain, and hypoglycemia in type 2 diabetes. JAMA 2010; 303: 1410-8.
29. Hegele RA, Connelly PW, Palmason C, Jenkins DJ, Wolever TM. Differ-
ential response of plasma lipoprotein(a) and apolipoprotein B in NID- DM subjects treated with acarbose. Diabetes Care 1995; 18: 272-3.
30. Wolever TM, Radmard R, Chiasson JL, Hunt JA, Josse RG, Palmason C, Rodger NW, Ross SA, Ryan EA, Tan MH. One-year acarbose treatment raises fasting serum acetate in diabetic patients. Diabet Med 1995; 12:
164-72.
31. Jenkins DJ, Wolever TM, Jenkins A, Brighenti F, Vuksan V, Rao AV, Cun- nane SC, Ocana A, Corey P, Vezina C, et al. Specific types of colonic fer- mentation may raise low-density-lipoprotein-cholesterol concentrations.
Am J Clin Nutr 1991; 54: 141-7.
32. Zeymer U. Cardiovascular benefits of acarbose in impaired glucose tol- erance and type 2 diabetes. Int J Cardiol 2006; 107: 11-20.
33. Chiasson JL, Josse RG, Gomis R, Hanefeld M, Karasik A, Laakso M; STOP- NIDDM Trial Research Group. Acarbose treatment and the risk of car- diovascular disease and hypertension in patients with impaired glucose tolerance: the STOP-NIDDM trial. JAMA 2003; 290: 486-94.
34. Hanefeld M. Cardiovascular benefits and safety profile of acarbose ther- apy in prediabetes and established type 2 diabetes. Cardiovasc Diabetol 2007; 6: 20.
35. Chiasson JL, Josse RG, Gomis R, Hanefeld M, Karasik A, Laakso M; STOP-
NIDDM Trail Research Group. Acarbose for prevention of type 2 diabetes mellitus: the STOP-NIDDM randomised trial. Lancet 2002; 359: 2072-7.
36. Heller S, Buse J, Fisher M, Garg S, Marre M, Merker L, Renard E, Rus- sell-Jones D, Philotheou A, Francisco AM, et al. Insulin degludec, an ul- tra-longacting basal insulin, versus insulin glargine in basal-bolus treat- ment with mealtime insulin aspart in type 1 diabetes (BEGIN Basal-Bo- lus Type 1): a phase 3, randomised, open-label, treat-to-target non-infe- riority trial. Lancet 2012; 379: 1489-97.
37. Rosenstock J, Davies M, Home PD, Larsen J, Koenen C, Schernthaner G.
A randomised, 52-week, treat-to-target trial comparing insulin detemir with insulin glargine when administered as add-on to glucose-lowering drugs in insulin-naive people with type 2 diabetes. Diabetologia 2008;
51: 408-16.
38. Rosenstock J, Schwartz SL, Clark CM, Jr, Park GD, Donley DW, Edwards MB. Basal insulin therapy in type 2 diabetes: 28-week comparison of in- sulin glargine (HOE 901) and NPH insulin. Diabetes Care 2001; 24: 631-6.
39. Su JB, Wang XQ, Chen JF, Wu G, Jin Y. Glycemic variability in insulin treated type 2 diabetes with well-controlled hemoglobin A1c and its re- sponse to further treatment with acarbose. Chin Med J (Engl) 2011; 124:
144-7.