Quantitative T2 Mapping of Articular Cartilage of the Glenohumeral Joint at 3.0T in Rotator Cuff Disease Patients:
the Evaluation of Degenerative Change of Cartilage
INTRODUCTION
Rotator cuff disease mainly occurs in patients with shoulder pain, and the cases tend to becomes more pronounced in elderly patients. Over time, the partial thickness
This is an Open Access article distributed under the terms of the Creative Commons Attribution Non-Commercial License (http://creativecommons.org/licenses/
by-nc/4.0/) which permits unrestricted non-commercial use, distribution, and reproduction in any medium, provided the original work is properly cited.
Received: May 13, 2019 Revised: June 21, 2019 Accepted: June 25, 2019 Correspondence to:
Kyung Ryeol Lee, M.D.
Department of Radiology, Jeju National University Hospital 15 Aran 13-gil, Jeju-si, Jeju-do 63241, Korea.
Tel. +82-64-717-1373 Fax. +82-64-717-1377 E-mail: [email protected]
Copyright © 2019 Korean Society of Magnetic Resonance in Medicine (KSMRM)
Original Article
Purpose: The aim of this study is to evaluate the T2 value of the articular cartilage of the glenohumeral joint in rotator cuff disease displayed on 3.0T MRI and to apply it in clinical practice.Materials and Methods: This study involved sixty-two patients who underwent shoulder MRI containing T2 mapping. The mean T2 value was measured by placing a free hand ROI over the glenoid or humeral cartilage from the bone-cartilage interface to the articular surface on three consecutive, oblique coronal images. The drawn ROI was subsequently divided into superior and inferior segments. The assessed mean T2 values of the articular cartilage of the glenohumeral joint were compared and evaluated based on the degree of rotator cuff tear, the degree of fatty atrophy of the rotator cuff, and the acromiohumeral distance.
Results: ICC values between two readers indicated moderate or good reproducibility.
The mean T2 value for the articular cartilage of the glenoid and humeral head cartilage failed to show any significant difference based on the degree of rotator cuff tear. However, the mean T2 values of articular cartilage, based on fatty atrophy, tended to be higher in fatty atrophy 3 or fatty atrophy 4 groups while some sub- regions displayed significantly higher mean T2 values. There was no correlation between the acromiohumeral distance and the mean T2 values of the articular cartilage of the glenoid and humeral head.
Conclusion: T2 mapping of the glenohumeral joint failed to show any significant difference in quantitative analysis of the degenerative change of the articular cartilage based on the degree of rotator cuff tear. However, it also offers quantitative information on the degenerative change of cartilage of the glenohumeral joint in patients with rotator cuff tear and severe fatty atrophy of the rotator cuff.
Keywords: Shoulder; Glenohumeral; Cartilage; Rotator cuff; T2 mapping Kyung Ryeol Lee, Su Yeon Ko, Guk Myung Choi
Department of Radiology, Jeju National University Hospital, Jeju-si, Korea
tear of the rotator cuff develops into a full thickness tear and eventually leads to degenerative alteration of the glenohumeral joint (1). Particularly for severe glenohumeral osteoarthritis, a more invasive surgical option such as total shoulder arthroplasty (TSA) may be considered (2). It has been reported that the re-tear rate of a restored rotator cuff tendon increases in patients with rotator cuff tear associated with early osteoarthritis (3). Consequently, early detection and frequent monitoring of osteoarthritis and degeneration of articular cartilage of the glenohumeral joint in patients with rotator cuff disease is important.
However, cartilage imaging that use conventional MR imaging have been developed with the aim of improving morphological detection of cartilage was albeit with a limitation of the ability to detect or monitor the cartilage degeneration mentioned above (4, 5). Of late, compositional MR imaging of the cartilage such as T2 and T1rho mapping technique, and dGEMRIC (delayed gadolinium-enhanced MR imaging of cartilage) techniques were included in the MR protocol of clinical trials. Among these MR techniques, the T2 mapping technique showed remarkable clinical application and numerous studies have been done on patients with knee joint complications (6-9). Therefore, we hope to use the T2 mapping technique to assess the morphological and biochemical properties of the articular cartilage of the glenohumeral joint. The aim of this study is to evaluate the T2 value of the articular cartilage of the glenohumeral joint in patients with rotator cuff disease at 3.0T and to apply it in clinical practice.
MATERIALS AND METHODS
This retrospective study was approved by our institutional review board and informed consent was waived.
Patient Selection
From February 2016 to November 2016, we retrospectively reviewed patients’ medical records, MR images, and plain radiographs. 67 patients had MRI performed on their shoulders in addition to T2 mapping. The patients had reported to the hospital with shoulder pain. Of these patients, five were excluded from previous surgery and trauma. In one of the patients, both shoulders underwent MRI scans. A total of 62 patients (mean age, 59.1 years; age range, 22-77 years) were enrolled for this study, including 26 men and 36 women, and 63 shoulder MR images (right shoulder, 40; left shoulder, 23) were included in this study.
MRI Acquisition
All MR images were obtained using Magnetom Skyra (Siemens, Erlangen, Germany) and Achieva (Philips Medical Systems, Best, The Netherlands) 3.0T MRI scanners based on routine diagnostic T1 and T2-weighted imaging, and extra T2 mapping was included. The imaging sequence for T2 mapping consisted of an oblique-coronal, multi-echo spin-echo T2-weighted sequence done with the following imaging parameters: Siemens Skyra (36 shoulders, repetition time [ms], 1140; echo time [ms], 13.8, 27.6, 41.4, 55.2, 69.0;
field of view [FOV] [mm], 140 × 140; matrix size, 320 × 320; voxel size [mm], 0.44 × 0.44 × 3.00; slice thickness [mm] 3.0; inter-slice gap [mm], 0.3; examination time(s), 290); Philips Achieva (27 shoulders, repetition time [ms], 2179; echo time [ms], 13.8, 27.6, 41.4, 55.2, 69.0; FOV [mm], 140 × 140; matrix size, 320 × 317; voxel size [mm], 0.44 × 0.44 × 3.00; slice thickness [mm], 3.0; inter-slice gap [mm], 0.3; examination time(s), 599).
T2 Value Measurement and Image Analysis
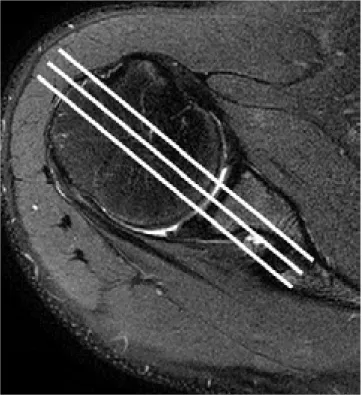
The T2 maps were quantitatively evaluated by two radiologists (K.R.L, with six years of experience in musculoskeletal imaging and S.Y.K who has eight years of experience in general imaging). The T2 value was evaluated based on color-coded T2 maps comparing the T2-weighted, and oblique coronal images to obtain an accurate ROI on targeted cartilage of the glenoid and humeral head. For precise analysis of the T2 value, the three consecutive sections containing large area of humeral and glenoid cartilage were selected among the images (Fig. 1a, b).
The mean T2 value was obtained by placing a free-hand region of interest (ROI) over the glenoid and humeral head cartilage from the bone-cartilage interface to the articular surface (Fig. 1c, d). The drawn ROI was ultimately divided into superior and an inferior segment by the Philips IntelliSpace Portal (ISP) 7.0. Hence, the three ROIs placed on the three consecutive sections were divided into six sub-regions i.e., anterosuperior (AS), anteroinferior (AI), middle-superior (MS), middle-inferior (MI), posterosuperior (PS), posteroinferior (PI) segments, and six T2 values were obtained from the glenoid or humeral head of one shoulder MR image. Thus, T2 value measurements were performed in both the glenoid cartilage and humeral head cartilage, respectively.
Routine diagnostic MR images were utilized to assess the degree of rotator cuff tear, i.e. (grade 1 - normal or tendinosis; grade 2 - partial thickness tear; grade 3 - full thickness tear) and the degree of fatty degeneration of the
Fig. 1. T2 value measurement (a, b). Three consecutive oblique coronal sections comprising large areas of humeral and glenoid cartilage were selected from the images. (c, d) On color-coded T2 maps comparing the T2-weighted image.
ROI was drawn on targeted cartilage of the glenoid and humeral head respectively. The drawn ROI was subsequently divided into superior and inferior segments.
a
b
c d
supraspinatus muscle based on the Goutallier classification i.e. (grade 0 - normal muscle; grade 1 - some fatty streaks;
grade 2 - fatty muscle atrophy less than 50%; grade 3 - 50% fatty muscle atrophy; grade 4, fatty muscle atrophy greater than 50%) through consensus by the two radiologists. Additionally, the acromiohumeral distance was measured on the shoulder AP after consensus by the two radiologists.
Statistical Analysis
For comparison of the mean T2 values of the cartilage of the glenoid and humeral head among the groups classified based on the degree of rotator cuff tear, and fatty degeneration of the supraspinatus muscle, we applied the one-way analysis of variance (abbreviated one-way ANOVA).
Regression analysis was used for correlation between the mean T2 values of the cartilage of the glenoid and humeral head, and acromiohumeral distance (AHD). To determine the interobserver reproducibility in the measurements of mean T2 values between reader 1 and reader 2, the intraclass correlation coefficient (ICC) with two-way mixed model of absolute agreement was used. In this study, we measured ICC values to determine the reproducibility of measured mean T2 values of all sub-regions (AS + AI + MS + MI + PS + PI) from reader 1 and reader 2. Values of ICC < 0.50 indicate poor reproducibility, those within the range of 0.50-0.75 indicate moderate reproducibility, those ranging from 0.75-0.90 indicate good reproducibility, and those >
0.90 indicate excellent reproducibility (10). All statistical analyses were performed using SPSS software version 18.0 (SPSS Inc., Chicago, IL, USA). For all statistical tests, a P value less than 0.05 was considered significant.
RESULTS
Evaluation of the ICC values for interobserver reproducibility for both measurements of articular cartilage of mean T2 values of all sub-regions (AS + AI + MS + MI + PS + PI) from reader 1 and reader 2 exhibited moderate reproducibility (ICC = 0.501) in the glenoid of glenohumeral joint and good reproducibility (ICC = 0.721) in the humeral head of glenohumeral joint (Table 1).
The mean T2 values of articular cartilage of all sub- regions of the glenoid and humeral head based on the degree of the rotator cuff tear and the degree of fatty atrophy of the supraspinatus muscle were described in Tables 2 and 3. There was no significance in the mean T2 values of articular cartilage of all sub-regions of the glenoid
Table 1. Intraclass Correlation Coefficient (ICC) for
Interobserver Reproducibility between Reader 1 and Reader 2 T2 mapping P value ICC of two readers (glenoid) 0.501 (0.175-0.698) < 0.05 ICC of two readers (humeral head) 0.721 (0.538-0.831) < 0.05
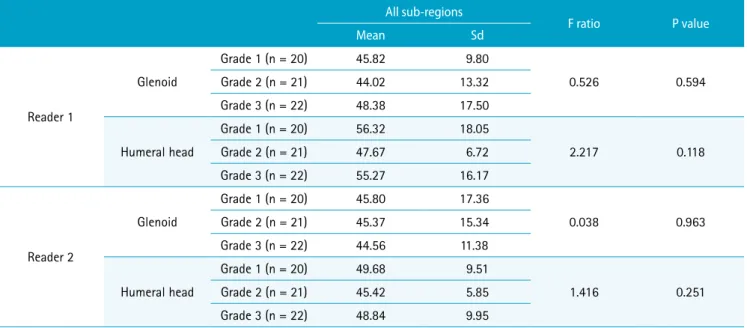
Table 2. The Mean T2 Values (ms) of Articular Cartilage of All Sub-regions of the Glenoid and Humeral Head According to the Degree of Rotator Cuff Tear for Reader 1 and Reader 2
All sub-regions
F ratio P value
Mean Sd
Reader 1
Glenoid
Grade 1 (n = 20) 45.82 9.80
0.526 0.594
Grade 2 (n = 21) 44.02 13.32
Grade 3 (n = 22) 48.38 17.50
Humeral head
Grade 1 (n = 20) 56.32 18.05
2.217 0.118
Grade 2 (n = 21) 47.67 6.72
Grade 3 (n = 22) 55.27 16.17
Reader 2
Glenoid
Grade 1 (n = 20) 45.80 17.36
0.038 0.963
Grade 2 (n = 21) 45.37 15.34
Grade 3 (n = 22) 44.56 11.38
Humeral head
Grade 1 (n = 20) 49.68 9.51
1.416 0.251
Grade 2 (n = 21) 45.42 5.85
Grade 3 (n = 22) 48.84 9.95
and humeral head based on the degree of the rotator cuff tear (Fig. 2). The mean T2 values of articular cartilage of all sub-regions of the glenoid and humeral head, based on fatty atrophy, was highest in the fatty atrophy 3 group
compared to the rest of the groups in both the glenoid and humeral head cartilage for both reader 1 and reader 2 (Fig. 3). However, there was a significant difference in the glenoid cartilage according to reader 1 while there was
Fig. 2. (a) 46-year-old man with tendinopathy of rotator cuff and Goutallier grade 2. (b) The T2 map of the glenohumeral joint indicates slightly lower T2 value compared to the reported normal range. (The mean T2 value of reader 1; glenoid [41.88 ms], humeral head [41.95 ms], the mean T2 value of reader 2; glenoid [38.60 ms], humeral head [43.30 ms].)
a b
Table 3. The Mean T2 Values (ms) of Articular Cartilage of All Sub-regions of the Glenoid and Humeral Head According to the Degree of Fatty Atrophy of Supraspinatus for Reader 1 and Reader 2
All sub-regions
F ratio P value
Mean Sd
Reader 1
Glenoid
Goutallier grade 1 (n = 8) 46.85 13.25
3.364 0.024
Goutallier grade 2 (n = 48) 44.17 11.09 Goutallier grade 3 (n = 3) 68.15 29.71 Goutallier grade 4 (n = 4) 51.43 22.25
Humeral head
Goutallier grade 1 (n = 8) 57.13 21.98
2.072 0.114
Goutallier grade 2 (n = 48) 50.75 10.99 Goutallier grade 3 (n = 3) 64.66 18.43 Goutallier grade 4 (n = 4) 64.19 28.82
Reader 2
Glenoid
Goutallier grade 1 (n = 8) 42.30 11.28
0.503 0.682
Goutallier grade 2 (n = 48) 45.40 15.64 Goutallier grade 3 (n = 3) 53.92 13.25 Goutallier grade 4 (n = 4) 42.41 5.77
Humeral head
Goutallier grade 1 (n = 8) 47.68 7.00
2.645 0.057
Goutallier grade 2 (n = 48) 47.46 8.25 Goutallier grade 3 (n = 3) 60.97 15.83 Goutallier grade 4 (n = 4) 44.98 5.51
no significant difference in the humeral head cartilage according to reader 1 and in the glenoid and humeral head cartilage according to reader 2. There was no statistical correlation between the acromiohumeral distance and the mean T2 values of the articular cartilage of all of the sub- regions of the glenoid and humeral head for both reader 1 or reader 2 (Table 4) (Fig. 3).
The mean T2 values of the sub-regions were similar to those of the mean T2 values of all sub-regions, and only exhibited slight differences. The mean T2 values of articular cartilage of the glenoid and humeral head for each sub- region based on the degree of rotator cuff tear are described as in Table 5. There were no significant differences between the mean T2 values among the groups and no tendency
to increase or decrease for both reader 1 and reader 2.
However, for reader 2, the mean T2 values of the sub-region AI of the humeral head of the normal or tendinopathy group was higher for reader 2 than in the other groups.
The mean T2 values of articular cartilage of the glenoid and humeral head in each sub-region based on the degree of fatty atrophy of the supraspinatus muscle are described as in Table 6.
Reader 1: The mean T2 values of articular cartilage of the glenoid and humeral head cartilage exhibited a tendency to have higher mean T2 values for the fatty atrophy 3 or fatty atrophy 4 groups. However, sub-region PS was the only one that showed a statistically significant difference in the glenoid cartilage. In the humeral head cartilage, sub-regions
Fig. 3. (a, b) 76-year-old woman with full thickness tear of rotator cuff and Goutallier grade 3. (c) The T2 map of the glenohumeral joint showing higher T2 value compared to the reported normal range. The mean T2 value of glenoid according to reader 2 was similar with the reported normal range. (The mean T2 value of reader 1; glenoid [99.15 ms], humeral head [59.43 ms], the mean T2 value of reader 2;
glenoid [47.57 ms], humeral head [56.40 ms]) c
a b
Fig. 4. (a, b) 72-year-old man with full thickness tear of rotator cuff and decreased acromiohumeral distance (AHD; 6.90 cm). (c) The T2 map of the glenohumeral joint indicates similar or slightly lower T2 value compared to the reported normal range. (The mean T2 value of reader 1; glenoid [45.35 ms], humeral head [48.91 ms], the mean T2 value of reader 2;
glenoid [47.70 ms], humeral head [41.90 ms]) c
a b
Table 4. The Acromiohumeral Distance and the Mean T2 Values (ms) of the Articular Cartilage of All Sub-regions of the Glenoid and Humeral Head
Unstandardized coefficients
t Significance F R²
B Std. error
All sub-regions'
Reader 1 Glenoid -1.384 1.433 -0.966 0.338 0.933 0.015
Humeral head 0.482 1.531 0.315 0.754 0.099 0.002
Reader 2 Glenoid -0.339 1.512 -0.224 0.823 0.050 0.001
Humeral head 0.991 0.861 1.151 0.254 1.325 0.022
*B: unstandardized beta
**t: t-test statistic
***F: F value
****R²: R-squared
of AI, MS and MI showed significant differences.
Reader 2: The mean T2 values of articular cartilage of the glenoid and humeral head cartilage had a tendency of higher mean T2 values in the fatty atrophy 3 or fatty atrophy 4 groups. However, the mean T2 values of the glenoid cartilage showed no statistically significant difference in any sub-region, and the mean T2 value of humeral head cartilage varied significantly in sub-regions of PS and PI.
The acromiohumeral distance and the mean T2 value of the articular cartilage for each sub-region of the humeral head and glenoid did not show statistical correlation for both reader 1 or reader 2 (Table 7).
DISCUSSION
Unlike the knee and hip joint, shoulder is not a weight- bearing joint. Nevertheless, osteoarthritis in shoulders is common particularly in those who have instability in shoulders (11). Chalmers et al. (12) reported that it takes about eight years to visualize minimal radiographic glenohumeral arthritic change in the early to middle stages of degenerative rotator cuff disease. Conventional imaging solutions, including plain radiographs, CT, and MR imaging had limitations in appropriately detecting and evaluating glenohumeral arthritic changes in patients with degenerative rotator cuff disease. Therefore, it is necessary to evaluate osteoarthritis of the glenohumeral joint using
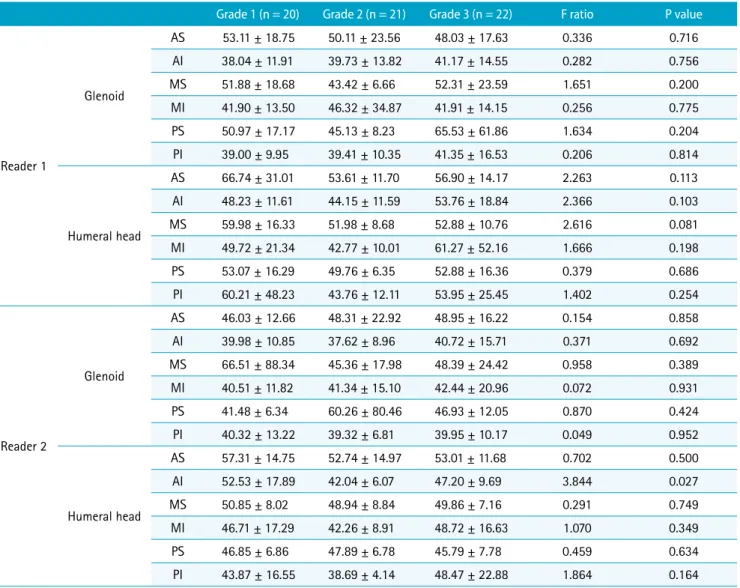
Table 5. The Mean T2 Values (ms) of Articular Cartilage of Sub-regions of the Glenoid and Humeral Head According to the Degree of Rotator Cuff Tear for Reader 1 and Reader 2
Grade 1 (n = 20) Grade 2 (n = 21) Grade 3 (n = 22) F ratio P value
Reader 1
Glenoid
AS 53.11 ± 18.75 50.11 ± 23.56 48.03 ± 17.63 0.336 0.716
AI 38.04 ± 11.91 39.73 ± 13.82 41.17 ± 14.55 0.282 0.756
MS 51.88 ± 18.68 43.42 ± 6.66 52.31 ± 23.59 1.651 0.200
MI 41.90 ± 13.50 46.32 ± 34.87 41.91 ± 14.15 0.256 0.775
PS 50.97 ± 17.17 45.13 ± 8.23 65.53 ± 61.86 1.634 0.204
PI 39.00 ± 9.95 39.41 ± 10.35 41.35 ± 16.53 0.206 0.814
Humeral head
AS 66.74 ± 31.01 53.61 ± 11.70 56.90 ± 14.17 2.263 0.113
AI 48.23 ± 11.61 44.15 ± 11.59 53.76 ± 18.84 2.366 0.103
MS 59.98 ± 16.33 51.98 ± 8.68 52.88 ± 10.76 2.616 0.081
MI 49.72 ± 21.34 42.77 ± 10.01 61.27 ± 52.16 1.666 0.198
PS 53.07 ± 16.29 49.76 ± 6.35 52.88 ± 16.36 0.379 0.686
PI 60.21 ± 48.23 43.76 ± 12.11 53.95 ± 25.45 1.402 0.254
Reader 2
Glenoid
AS 46.03 ± 12.66 48.31 ± 22.92 48.95 ± 16.22 0.154 0.858
AI 39.98 ± 10.85 37.62 ± 8.96 40.72 ± 15.71 0.371 0.692
MS 66.51 ± 88.34 45.36 ± 17.98 48.39 ± 24.42 0.958 0.389
MI 40.51 ± 11.82 41.34 ± 15.10 42.44 ± 20.96 0.072 0.931
PS 41.48 ± 6.34 60.26 ± 80.46 46.93 ± 12.05 0.870 0.424
PI 40.32 ± 13.22 39.32 ± 6.81 39.95 ± 10.17 0.049 0.952
Humeral head
AS 57.31 ± 14.75 52.74 ± 14.97 53.01 ± 11.68 0.702 0.500
AI 52.53 ± 17.89 42.04 ± 6.07 47.20 ± 9.69 3.844 0.027
MS 50.85 ± 8.02 48.94 ± 8.84 49.86 ± 7.16 0.291 0.749
MI 46.71 ± 17.29 42.26 ± 8.91 48.72 ± 16.63 1.070 0.349
PS 46.85 ± 6.86 47.89 ± 6.78 45.79 ± 7.78 0.459 0.634
PI 43.87 ± 16.55 38.69 ± 4.14 48.47 ± 22.88 1.864 0.164
AI = anteroinferior; AS = anterosuperior; MI = middle-inferior; MS = middle-superior; PI = posteroinferior; PS = posterosuperior
advanced techniques at a suitable stage in this study due to the high correlation between degenerative rotator cuff disease and degenerative changes of articular cartilage of the glenohumeral joint. Consequently, accurate diagnosis of both diseases is important in understanding the symptoms of patients with shoulder pain and predicting their prognosis (13-16).
Conventional MRI has been routinely utilized to estimate and evaluate rotator cuff disease and glenohumeral osteoarthritis, and had a key role in identifying morphologic changes of tendon and articular cartilage of the glenohumeral joint (17). However, conventional MRI has exhibited some limitations in the detection of minimal changes in the articular cartilage of degenerative disease
of the glenohumeral joint. Thus, quantitative techniques, such as T2 and T1rho mapping techniques and dGEMRIC technique, have been developed and recommended as monitoring tools of cartilage imaging during the treatment of osteoarthritis (15, 18-20).
There are numerous reports indicating T2 mapping as useful for investigating degenerative cartilage in patients with osteoarthritis of the knee joint (21, 22). However, there are just a handful of published studies about T2 mapping for articular cartilage of the glenohumeral joint. Maizlin et al. (15) submitted that T2 maps of articular cartilage of the glenohumeral joint correlate with the findings obtained on conventional MRI (23-25). In this study, the mean T2 values of articular cartilage of the humeral head and
Table 6. The Mean T2 Values (ms) of Articular Cartilage of Sub-regions of the Glenoid and Humeral Head According to the Degree of Fatty Atrophy of Supraspinatus for Reader 1 and Reader 2
Goutallier grade 1
(n = 8) Goutallier grade 2
(n = 48) Goutallier grade 3
(n = 3) Goutallier grade 4
(n = 4) F ratio P value
Reader 1
Glenoid
AS 48.26 ± 15.10 49.85 ± 21.21 62.53 ± 10.75 48.26 ± 15.10 0.404 0.751 AI 36.50 ± 7.60 39.34 ± 13.67 42.33 ± 7.50 40.04 ± 15.41 0.760 0.521 MS 56.71 ± 27.06 45.81 ± 11.48 66.70 ± 32.47 61.85 ± 37.75 2.845 0.045 MI 42.33 ± 14.42 43.97 ± 25.43 42.93 ± 9.71 38.68 ± 5.72 0.070 0.976 PS 57.24 ± 23.86 46.38 ± 10.32 145.87 ± 145.43 71.73 ± 61.47 9.246 0.000 PI 40.04 ± 15.41 39.67 ± 12.55 48.53 ± 13.06 36.80 ± 7.41 0.544 0.654
Humeral head
AS 66.11 ± 17.03 56.73 ± 21.76 83.37 ± 7.98 66.11 ± 17.03 2.084 0.112 AI 46.43 ± 16.59 46.79 ± 10.41 56.13 ± 18.67 65.69 ± 66.22 4.540 0.006 MS 64.53 ± 20.42 52.87 ± 9.77 68.70 ± 18.08 48.65 ± 4.24 4.039 0.011 MI 49.31 ± 26.70 47.98 ± 19.50 43.90 ± 4.61 102.78 ± 111.56 3.696 0.017 PS 50.71 ± 16.85 50.69 ± 10.03 59.50 ± 12.68 63.08 ± 35.67 1.366 0.262 PI 65.69 ± 66.22 49.41 ± 21.63 76.33 ± 59.27 46.00 ± 6.70 1.223 0.309
Reader 2
Glenoid
AS 46.20 ± 14.44 46.82 ± 17.85 64.90 ± 11.50 46.20 ± 14.44 1.043 0.380 AI 40.58 ± 14.98 38.64 ± 11.40 39.53 ± 7.53 35.54 ± 6.72 0.581 0.630 MS 55.39 ± 30.62 52.36 ± 58.08 75.03 ± 51.25 41.45 ± 7.57 0.237 0.870 MI 37.53 ± 8.02 42.19 ± 18.16 43.83 ± 10.98 38.73 ± 5.47 0.237 0.870
PS 38.60 ± 6.48 51.98 ± 53.60 54.83 ± 6.90 39.83 ± 3.45 0.247 0.863
PI 35.54 ± 6.72 40.43 ± 10.89 45.37 ± 8.17 37.48 ± 6.52 0.891 0.451
Humeral head
AS 56.04 ± 9.65 53.61 ± 14.65 66.80 ± 11.70 56.04 ± 9.65 1.075 0.367 AI 51.25 ± 20.03 46.15 ± 11.80 53.20 ± 5.98 38.93 ± 5.10 0.599 0.618
MS 50.54 ± 6.54 49.47 ± 8.07 59.60 ± 7.45 46.00 ± 4.90 1.971 0.128
MI 42.98 ± 10.84 45.72 ± 15.74 58.77 ± 14.75 44.68 ± 4.68 0.868 0.463
PS 46.33 ± 6.11 46.86 ± 6.57 55.80 ± 10.10 40.70 ± 9.05 2.828 0.046
PI 38.93 ± 5.10 42.94 ± 13.73 71.67 ± 53.74 42.23 ± 7.76 3.363 0.025 AI = anteroinferior; AS = anterosuperior; MI = middle-inferior; MS = middle-superior; PI = posteroinferior; PS = posterosuperior
glenoid of the glenohumeral joint were highly correlated to the reported mean T2 values of the study of asymptomatic patients and were similar or slightly correlated to the reported mean T2 values of the study involving healthy volunteers. However, in the fatty atrophy group 3, the mean T2 values were higher than the reported mean values of asymptomatic patients and healthy volunteers in both glenoid cartilage and humeral head cartilage. Therefore, this is a preliminary study that demonstrates that T2 mapping imaging is a promising technique that can quantitatively
evaluate biochemical changes associated with early OA in symptomatic patients with rotator cuff disease.
In this study, the mean T2 values of the groups categorized by the degree of rotator cuff tear did not show any statistically significant difference or tendency. Most of the dynamic restraint of the glenohumeral joint are due to the concavity-compression mechanism of the rotator cuff.
As a result, when a rotator cuff tear occurs, these stabilizing forces are lost and this allows greater displacement of the humeral head. These pathologic contacts of the
Table 7. The Acromiohumeral Distance and the Mean T2 Values (ms) of the Articular Cartilage of Sub-regions of the Glenoid and Humeral Head
Unstandardized coefficients
t Significance F R²
B Std. error
AS
Reader 1 Glenoid 0.391 2.030 0.193 0.848 0.037 0.001
Humeral head 0.558 2.169 0.257 0.798 0.066 0.001
Reader 2 Glenoid -0.171 1.821 -0.094 0.925 0.009 0.000
Humeral head 0.863 1.420 0.608 0.546 0.369 0.006
AI
Reader 1 Glenoid -0.910 1.380 -0.660 0.512 0.435 0.007
Humeral head 0.721 1.540 0.468 0.641 0.219 0.004
Reader 2 Glenoid -0.139 1.257 -0.111 0.912 0.012 0.000
Humeral head 1.820 1.106 1.646 0.105 2.711 0.043
MS
Reader 1 Glenoid -1.659 1.864 -0.890 0.377 0.792 0.013
Humeral head 1.173 1.295 0.906 0.368 0.821 0.014
Reader 2 Glenoid -3.897 5.449 -0.715 0.477 0.511 0.008
Humeral head 0.130 0.816 0.159 0.874 0.025 0.000
MI
Reader 1 Glenoid 0.252 2.366 0.106 0.916 0.011 0.000
Humeral head -1.681 3.514 -0.478 0.634 0.229 0.004
Reader 2 Glenoid 0.059 1.691 0.035 0.972 0.001 0.000
Humeral head 0.510 1.531 0.333 0.740 0.111 0.002
PS
Reader 1 Glenoid -6.480 3.910 -1.657 0.103 2.746 0.044
Humeral head -0.654 1.410 -0.464 0.644 0.215 0.004
Reader 2 Glenoid 1.788 4.875 0.367 0.715 0.135 0.002
Humeral head 0.879 0.716 1.229 0.224 1.510 0.025
PI
Reader 1 Glenoid 0.102 1.306 0.078 0.938 0.006 0.000
Humeral head 2.776 3.297 0.842 0.403 0.709 0.012
Reader 2 Glenoid 0.326 0.942 0.346 0.730 0.120 0.002
Humeral head 1.742 1.661 1.049 0.298 1.101 0.018
*B : unstandardized beta
**t : t-test statistic
***F : F value
****R²: R-squared
AI = anteroinferior; AS = anterosuperior; MI = middle-inferior; MS = middle-superior; PI = posteroinferior; PS = posterosuperior
humerus, the glenoid and coracoacromial arches generates frictional wear of the articular cartilage besides the subacromial impingement (26-28). This pathophysiologic mechanism helps us to understand that glenohumeral joints with tendinopathy, partial thickness tears, and small symptomatic full thickness tears of the rotator cuff have a slower rate of progress of degenerative articular cartilage disease. Significant degenerative cartilage changes are expected to occur after a certain period of time even after the occurrence of a massive tear (29, 30).
In this study, the Goutallier grade 3 group exhibited higher mean T2 values when there was a correlation between the fatty degeneration of the supraspinatus muscle and the mean T2 values of glenohumeral articular cartilage, in addition to some sub-regions where there was a significant difference. The fatty degeneration of the rotator cuff muscles is an key factor influencing the function of the shoulder, the reparability of the cuff tears and the outcome of the cuff tears (3, 31, 32). Mechanical detachment of the tendon in rotator cuff tears and suprascapular nerve injury is a major factor of fatty degeneration in rotator cuff muscles (33). Considering that the changes in the fatty infiltration and atrophy of the rotator cuff are irreversible, loss of the stabilizing force in the rotator cuff muscle tear patients with severe fatty atrophy is lengthy and may lead to the degeneration of articular cartilage or the possibility of early osteoarthritis. The study results are supported by reports indicating that glenohumeral arthritis is associated with rotator cuff atrophy and fatty infiltration. Naimark et al. submits that glenohumeral arthritis is related to rotator cuff atrophy and fatty infiltration (34, 35).
Reduction of the acromiohumeral distance (AHD) through conventional anteroposterior radiographs of the shoulder is known to assist in predicting tear and irreparability of rotator cuff tendons (36, 37). However, the acromiohumeral distance and the degenerative change of glenohumeral articular cartilage, identified via the mean T2 values of cartilage, did not show a significant correlation in this study.
This may be due to association of osteoarthritis with some degree of decentralization of the glenohumeral joint except superior stability. Nadja Saupe et al. (38) reported that more than 90% of patients with an acromiohumeral distance ≤ 7 mm had a full-thickness tear of the supraspinatus tendon, while 67% had a full-thickness tear of the infraspinatus tendon, and the size of a rotator cuff tear and the degree of fatty degeneration of the infraspinatus muscle had the most pronounced effect on the acromiohumeral distance.
Consequently, a massive tear coupled with impairment of
at least two tendons, the supraspinatus and infraspinatus tendons may show a decrease in AHD, while a full thickness tear of one tendon and a partial thickness tear of the rotator cuff tendon do not indicate a significant decrease in AHD (39). In fact, only one case recorded an AHD of less than 7 mm in this study.
In this study, measurement of T2 value was done using MR images obtained using two different scanners. However, the sequence and parameters of most of the imaging for T2 mapping was the same. Thus far, literature on reproducibility concerning T2 value of cartilage are rare.
Lammentausta et al. (40) reported variations in T2 values of knee cartilage obtained by scanners from different manufacturers. However, they suggested that the variation in T2 was likely due to difference in pulse sequences rather than manufacturing factors. In this study, inter-observer reproducibility of both measurements of mean T2 values of articular cartilage of glenohumeral joint from reader 1 and reader 2 indicate moderate reproducibility in the glenoid and good reproducibility in the humeral head.
Koff et al. (41) reported that different repeatability of patellar cartilage T2 values occur among examiners due to different ROIs as defined by examiners. Recent literature offer different opinions. Mosher et al. (42) reported that MR imaging measurements of T2 value presented moderate to excellent reproducibility in the analysis of MR image biomarker (T2 and patellar T1-ρ) reproducibility of knee cartilage in a multi-center multi-vendor trial. Glaser et al.
(43) also suggested that there was no noticeable difference between intra- and inter-session reproducibility in the study about regional precision errors of T2 in healthy human patellar cartilage. In addition, we should be aware of bias in cartilage T2 value and interpreting T2 mapping which results from the magnetic field strength, MR acquisition protocol, calculation techniques, technical precision and re-segmentation precision, and process of optimization of practice in MR examinations is key (44).
Here are some of the limitations of this study:
First, as this is a retrospective study design, there may be existence of selection bias. The number of patients with atrophy fatty atrophy 3 or fatty atrophy 4 was relatively small. Consequently, further studies involving more patients with fatty atrophy 3 or fatty atrophy 4 are required.
Secondly, it was difficult to measure the precise T2 value of articular cartilage while excluding surrounding tissues such as joint effusion or subchondral bone, and this may be as a result of poor contrast between cartilage and the
surrounding tissue, and the partial volume effect or the chemical shift artifact. In order to reduce the error of T2 mapping analysis and to be practical and reproducible in the normal clinical workflow in future, automated segmentation and registration routines should be effected. We believe that a further developed technique which may reduce this limitations and enable high resolution imaging will be possible in the subsequent study. Third, not all findings were confirmed by arthroscopic surgery or histology.
In conclusion, T2 mapping of the glenohumeral joint did not show a significant difference in the quantitative assessment of the degenerative change of the articular cartilage based on the degree of rotator cuff tear. However, it provides additional quantitative information regarding the degenerative change of cartilage of the glenohumeral joint in patients with rotator cuff tear and severe fatty atrophy of the rotator cuff.
Acknowledgments
Jeju National University afforded time and resources required to complete this study.
REFERENCES
1. Sambandam SN, Khanna V, Gul A, Mounasamy V. Rotator cuff tears: an evidence based approach. World J Orthop 2015;6:902-918
2. Mitchell JJ, Warner BT, Horan MP, et al. Comprehensive arthroscopic management of glenohumeral osteoarthritis:
preoperative factors predictive of treatment failure. Am J Sports Med 2017;45:794-802
3. Jeong HY, Jeon YS, Lee DK, Rhee YG. Rotator cuff tear with early osteoarthritis: how does it affect clinical outcome after large to massive rotator cuff repair? J Shoulder Elbow Surg 2019;28:237-243
4. McCauley TR, Recht MP, Disler DG. Clinical imaging of articular cartilage in the knee. Semin Musculoskelet Radiol 2001;5:293-304
5. Mosher TJ, Dardzinski BJ. Cartilage MRI T2 relaxation time mapping: overview and applications. Semin Musculoskelet Radiol 2004;8:355-368
6. Apprich S, Mamisch TC, Welsch GH, et al. Quantitative T2 mapping of the patella at 3.0T is sensitive to early cartilage degeneration, but also to loading of the knee. Eur J Radiol 2012;81:e438-443
7. Dardzinski BJ, Mosher TJ, Li S, Van Slyke MA, Smith MB.
Spatial variation of T2 in human articular cartilage.
Radiology 1997;205:546-550
8. Dunn TC, Lu Y, Jin H, Ries MD, Majumdar S. T2 relaxation time of cartilage at MR imaging: comparison with severity of knee osteoarthritis. Radiology 2004;232:592-598 9. Mamisch TC, Trattnig S, Quirbach S, Marlovits S, White LM,
Welsch GH. Quantitative T2 mapping of knee cartilage:
differentiation of healthy control cartilage and cartilage repair tissue in the knee with unloading--initial results.
Radiology 2010;254:818-826
10. Koo TK, Li MY. A guideline of selecting and reporting intraclass correlation coefficients for reliability research. J Chiropr Med 2016;15:155-163
11. Neer CS 2nd. Replacement arthroplasty for glenohumeral osteoarthritis. J Bone Joint Surg Am 1974;56:1-13
12. Chalmers PN, Salazar DH, Steger-May K, et al. Radiographic progression of arthritic changes in shoulders with degenerative rotator cuff tears. J Shoulder Elbow Surg 2016;25:1749-1755
13. Ellman H, Harris E, Kay SP. Early degenerative joint disease simulating impingement syndrome: arthroscopic findings.
Arthroscopy 1992;8:482-487
14. Yamaguchi K, Ditsios K, Middleton WD, Hildebolt CF, Galatz LM, Teefey SA. The demographic and morphological features of rotator cuff disease. A comparison of asymptomatic and symptomatic shoulders. J Bone Joint Surg Am 2006;88:1699-1704
15. Maizlin ZV, Clement JJ, Patola WB, et al. T2 mapping of articular cartilage of glenohumeral joint with routine MRI correlation--initial experience. HSS J 2009;5:61-66
16. Feeney MS, O'Dowd J, Kay EW, Colville J. Glenohumeral articular cartilage changes in rotator cuff disease. J Shoulder Elbow Surg 2003;12:20-23
17. Fitzgerald M, Lawler SM, Lowe JT, Nelson R, Mantell MT, Jawa A. Computed tomography underestimates rotator cuff pathology in patients with glenohumeral osteoarthritis. J Shoulder Elbow Surg 2018;27:1451-1455
18. Tran G, Cowling P, Smith T, et al. What imaging-detected pathologies are associated with shoulder symptoms and their persistence? A systematic literature review. Arthritis Care Res (Hoboken) 2018;70:1169-1184
19. Eagle S, Potter HG, Koff MF. Morphologic and quantitative magnetic resonance imaging of knee articular cartilage for the assessment of post-traumatic osteoarthritis. J Orthop Res 2017;35:412-423
20. Link TM, Stahl R, Woertler K. Cartilage imaging: motivation, techniques, current and future significance. Eur Radiol 2007;17:1135-1146
21. Kijowski R, Blankenbaker DG, Munoz Del Rio A, Baer GS, Graf BK. Evaluation of the articular cartilage of the knee joint: value of adding a T2 mapping sequence to a routine
MR imaging protocol. Radiology 2013;267:503-513 22. Kester BS, Carpenter PM, Yu HJ, et al. T1rho/T2 mapping
and histopathology of degenerative cartilage in advanced knee osteoarthritis. World J Orthop 2017;8:350-356 23. Lockard CA, Wilson KJ, Ho CP, Shin RC, Katthagen JC,
Millett PJ. Quantitative mapping of glenohumeral cartilage in asymptomatic subjects using 3 T magnetic resonance imaging. Skeletal Radiol 2018;47:671-682
24. Kang Y, Choi JA. T2 mapping of articular cartilage of the glenohumeral joint at 3.0 T in healthy volunteers: a feasibility study. Skeletal Radiol 2016;45:915-920
25. Lee SY, Park HJ, Kwon HJ, et al. T2 relaxation times of the glenohumeral joint at 3.0 T MRI in patients with and without primary and secondary osteoarthritis. Acta Radiol 2015;56:1388-1395
26. Zingman A, Li H, Sundem L, et al. Shoulder arthritis secondary to rotator cuff tear: a reproducible murine model and histopathologic scoring system. J Orthop Res 2017;35:506-514
27. Flurin PH, Hardy P, Valenti P, et al. Osteoarthritis after rotator cuff repair: a 10-year follow-up study. Orthop Traumatol Surg Res 2017;103:477-481
28. Werner CM, Conrad SJ, Meyer DC, Keller A, Hodler J, Gerber C. Intermethod agreement and interobserver correlation of radiologic acromiohumeral distance measurements. J Shoulder Elbow Surg 2008;17:237-240
29. Tashjian RZ. Epidemiology, natural history, and indications for treatment of rotator cuff tears. Clin Sports Med 2012;31:589-604
30. Zingg PO, Jost B, Sukthankar A, Buhler M, Pfirrmann CW, Gerber C. Clinical and structural outcomes of nonoperative management of massive rotator cuff tears. J Bone Joint Surg Am 2007;89:1928-1934
31. Collin P, Thomazeau H, Walch G, et al. Clinical and structural outcome twenty years after repair of isolated supraspinatus tendon tears. J Shoulder Elbow Surg 2019;28:196-202
32. Kim JY, Park JS, Rhee YG. Can preoperative magnetic resonance imaging predict the reparability of massive rotator cuff tears? Am J Sports Med 2017;45:1654-1663 33. Kuzel BR, Grindel S, Papandrea R, Ziegler D. Fatty
infiltration and rotator cuff atrophy. J Am Acad Orthop
Surg 2013;21:613-623
34. Berhouet J, Collin P, Benkalfate T, et al. Massive rotator cuff tears in patients younger than 65 years. Epidemiology and characteristics. Orthop Traumatol Surg Res 2009;95:S13- 18
35. Naimark M, Berliner J, Zhang AL, Davies M, Ma CB, Feeley BT. Prevalence of rotator cuff atrophy and fatty infiltration in patients undergoing total shoulder arthroplasty. J Shoulder Elbow Arthroplasty 2017;1:247154921770832-7 36. Iannotti JP, Norris TR. Influence of preoperative factors
on outcome of shoulder arthroplasty for glenohumeral osteoarthritis. J Bone Joint Surg Am 2003;85:251-258 37. Goutallier D, Le Guilloux P, Postel JM, Radier C, Bernageau J,
Zilber S. Acromio humeral distance less than six millimeter:
its meaning in full-thickness rotator cuff tear. Orthop Traumatol Surg Res 2011;97:246-251
38. Saupe N, Pfirrmann CW, Schmid MR, Jost B, Werner CM, Zanetti M. Association between rotator cuff abnormalities and reduced acromiohumeral distance. AJR Am J Roentgenol 2006;187:376-382
39. Nove-Josserand L, Levigne C, Noel E, Walch G. The acromio-humeral interval. A study of the factors influencing its height. Rev Chir Orthop Reparatrice Appar Mot 1996;82:379-385
40. Lammentausta E, Multanen J, Nieminen MT. Differences in T2 values of knee cartilage measured with different scanners. Proc Intl Soc Mag Reson Med 2009;17:3986 41. Koff MF, Parratte S, Amrami KK, Kaufman KR. Examiner
repeatability of patellar cartilage T2 values. Magn Reson Imaging 2009;27:131-136
42. Mosher TJ, Zhang Z, Reddy R, et al. Knee articular cartilage damage in osteoarthritis: analysis of MR image biomarker reproducibility in ACRIN-PA 4001 multicenter trial.
Radiology 2011;258:832-842
43. Glaser C, Mendlik T, Dinges J, et al. Global and regional reproducibility of T2 relaxation time measurements in human patellar cartilage. Magn Reson Med 2006;56:527- 534
44. Koff MF, Amrami KK, Felmlee JP, Kaufman KR. Bias of cartilage T2 values related to method of calculation. Magn Reson Imaging 2008;26:1236-1243