Corresponding author: Lee, Chi-Young https://orcid.org/0000-0001-6860-452X
School of Nursing & Health Studies, University of Washington Bothell, 18115 Campus Way NE, Bothell, WA 98011, USA.
Tel: +1-984-209-6277, Fax: +1-425-352-3237, E-mail: [email protected] Received: Jul 17, 2020 / Revised: Nov 11, 2020 / Accepted: Nov 24, 2020
This is an open access article distributed under the terms of the Creative Commons Attribution Non-Commercial License (http://creativecommons.org/licenses/
by-nc/3.0), which permits unrestricted non-commercial use, distribution, and reproduction in any medium, provided the original work is properly cited.
ORIGINAL ARTICLE Open Access
A Two-step Clustering Approach for Measuring Socioeconomic Factors Associated with Cardiovascular Health among Older Adults in South Korea
Lee, Chi-Young
Assistant Professor, School of Nursing & Health Studies, University of Washington Bothell, Washington, USA
Purpose: This study aimed to identify socioeconomic clusters of older adults and compare cardiovascular health among the identified clusters. Methods: A secondary analysis was performed using the data from 3,303 older adults (over 65 years of age; 56.5% women) who participated in the Korean National Health and Nutrition Examination Survey (2016~2017). A two-step cluster analysis was used to identify older adults’ socioeconomic clusters based on 11 factors associated with Socioeconomic Status (SES). Differences in the cardiovascular health outcomes among the identified clusters were analyzed using the x2 test and one-way ANOVA. Results: A three-cluster solution was selected (p<.001) composed of low (n=715), middle (n=1,425), and high-SES clusters (n=1,163). The three clusters differed significantly in the prevalence of diabetes (p<.010), hypertension (p<.001), and metabolic syndrome (p<.001), with greater prevalence in the lower SES clusters. Similarly, systolic blood pressure (p<.001), body mass index (p<.010), and total cholesterol (p<.010) differed significantly among the clusters in the same pattern. Conclusion: Older adults of lower SES clusters should be a crucial target group for health promotion interventions aimed at the prevention and management of cardiovascular disease risk factors. Tailored interventions can be developed by understanding intersecting SES risk factors in this group.
Key Words: Cluster analysis; Cardiovascular diseases; Socioeconomic factors; Health status disparities; Korea
INTRODUCTION
Socioeconomic Status (SES) is defined as the combined economic and social status of an individual, and health disparities disproportionately affecting people of lower SES have been a popular topic in the field of cardio- vascular research [1]. Simultaneously, the validity of in- dicators measuring SES remains a major concern [1].
Although some published traditional indices such as in- come, education, and occupation have been responsible for successfully impacting a substantial proportion of car- diovascular events, it has been argued that no single pa- rameter fully captures SES [2]. Notwithstanding, most studies in cardiovascular health employ a single SES pre- dictor as a proxy for the effects of socioeconomic dis- advantage [3,4].
Using a single SES predictor oversimplifies the multi- faceted and entwined dimensions of socioeconomic dis-
advantage and may erroneously overestimate the impact of a variable, ultimately underestimating the true impact of social hierarchy on health outcomes [5]. Even when us- ing other social variables as covariates, adjustments are likely to be incomplete and result in limited reliability [5].
In real-life scenarios, different SES indicators tend to clus- ter and intersect together [6], which underscores the theo- ry of intersectionality. The theory of intersectionality sug- gests that various socially constructed categories of dis- crimination (i.e., SES, race or ethnicity, etc.) interact to con- tribute to health disparities [7]. Thus, there is a need for novel markers of SES developed through rigorous design and methods.
Cluster analysis can allow the meaningful interpreta- tion of the complex concept of SES and facilitate the identi- fication of a vulnerable group of low SES individuals [8].
Understanding the potential clustering of SES risk mark- ers could facilitate an etiologic understanding of car-
diovascular health and identify possible interventions that could address mutually reinforcing contributors to Cardio- vascular Disease (CVD) [9]. Many western studies support the feasibility of applying clustering to assess various SES conditions and associated cardiovascular health [10,11].
For instance, Aungkulanon et al. [10] constructed a compo- site socioeconomic index using cluster analysis and ex- plored the correlation between the composite score and cardiovascular mortality in Thailand. Additionally, Mi- rowsky et al. [11] examined residential-level SES clusters in central North Carolina with their clustering technique, which enables the examination of its relationship to vari- ous cardiovascular and metabolic biomarkers.
In South Korea (hereafter “Korea”), older adults are the most vulnerable population with greater socioeconomic disadvantages. A high percentage of the aging population is suffering from CVD or is at risk. Importantly, such car- diovascular health conditions are closely related to low SES [12,13]. However, no study has explored clusters of older adults based on various intersecting SES indicators or how clustering contributes to cardiovascular health in Korea. Although previous Korean studies employed a wide range of SES factors as predictors [14,15], each of which was investigated separately for its effect on car- diovascular health, this approach could obscure impor- tant social gradients in cardiovascular health.
1. Aim of the Study
Considering these challenges, this study aimed to clas- sify older Korean adults into several socioeconomically homogeneous clusters based on various SES indicators and compare cardiovascular health among the identified clusters using cluster analysis. It is important to note that our analytic strategy was strongly informed by the theory of intersectionality. This theory helps researchers to be more explicit about why they include particular variables as important dimensions of disparity in studies [16].
In Korea, the literature on older adults includes differ- ent levels of SES indicators, including age, gender, finan- cial and social resources, working status, welfare benefits, and living location, which are critical determinants that have implications for differential cardiovascular health risk [12,13,17]. Although the original research on inter- sectionality theory does not incorporate age, age was in- cluded due to its significant relation to the degree of phys- ical and social privileges among older adults, which can- not be disaggregated when explicating the health in this group [18]. Occupation was also included because the em- ployment rate in older Koreans is more than twice the
Organization for Economic Cooperation and Development (OECD) average [19]. Thus, we hypothesized that dis- parities in cardiovascular health among Korean older adults are embedded in relationships defined by inter- sections of the aforementioned indicators.
METHODS
1. DesignThis was a secondary analysis of the cross-sectional data from the Korean National Health and Nutrition Examination Survey (KNHANES). This nationwide survey used a strati- fied, multistage, clustered probability sampling method to select a representative sample of the noninstitutionalized, civilian Korean population. KNHANES was selected be- cause it provides comprehensive and detailed information on SES, health behaviors, healthcare utilization, anthro- pometric measures, and clinical profiles for CVD, all rele- vant to this study. KNHANES is composed of three dis- tinct sections: a health interview survey, a health examina- tion survey, and a nutrition survey for dietary assessment.
This study uses the health interview and health examina- tion survey.
2. Ethical Considerations
KNHANES is publicly available deidentified data which do not include personal information. However, this study received the approval of the Institutional Review Board of the institution where the corresponding author was affiliated (protocol number: Pro00103112).
3. Analysis Sample
Given the rapid transformation of social structures in Korea, we used the most recent survey (2016, 2017) to en- sure the information is current. The data from each collec- tion year was merged to create the study dataset. The study population was limited to adults aged 65 years or older. Among older adults who responded to the survey in 2016 and 2017, a total of 3,303 people participated in all three components (i.e. health interview, health examina- tion, and nutrition survey); their data were analyzed in this study.
4. Measurements 1) Socioeconomic status.
Socioeconomic characteristics were measured using
multiple questions on age (65~74 years or≥75 years), gen- der (men or women), income level (four quartiles; low, middle-low, middle-high, or high), having private in- surance (yes or no), homeownership (yes or no), marital status (married/partnered or nonmarried/unpartnered), living arrangement (1 vs ≥2 people in the household), working status (employed or unemployed), the recipients of the National Basic Livelihood Security System (NBLSS;
yes or no), types of national insurance (self-employed in- surance, employee insurance, or Korean Medicaid [a tax- payer-funded insurance program]), and geographic loca- tions (urban, rural).
2) Cardiovascular health.
We operationalized the term cardiovascular health as a broad range of cardiovascular health outcomes, including CVD risk factors and the prevalence of metabolic syn- drome and CVD.
CVD risk factors. These include Body Mass Index (BMI [kg/m2]) equal to and over 25 kg/m2(obese; yes or no), waist circumference (cm; continuous), diabetes (yes or no), fasting glucose (mg/dL; continuous), HbA1c (%; continuous), hy- pertension (yes or no), Systolic Blood Pressure (SBP [mmHg];
continuous), dyslipidemia (yes or no), total cholesterol (mg/dL; continuous), High-Density Lipoprotein-Choles- terol (HDL-C [mg/dL]; continuous), triglyceride (mg/dL;
continuous). The cutoff point for obesity (BMI≥25 kg/m2) was defined by the International Obesity Task Force for Asian Adults in the Asian and Pacific regions [20].
Prevalence of metabolic syndrome. The presence of metabolic syndrome was assessed based on the National Cholesterol Education Program criteria (NCEP, Adult Treatment Pro- tocol, ATP-III) [21]. Participants with three of more of the following parameters were considered as having metabolic syndrome: waist circumference ≥90 cm in men and≥80 cm in women; fasting glucose ≥110 mg/dL or under treatment for diabetes; blood pressure≥130/85 mmHg or use of antihypertensive medication; HDL-C <40 mg/dL in men and <50 mg/dL in women; or triglyceride ≥150 mg/dL.
Prevalence of CVD. This is a dichotomized variable, with the answer being either yes or no; CVD includes angina pectoris, stroke, or myocardial infarction.
5. Statistical Analysis
The cluster analysis procedure was conducted using SPSS, v.20 (SPSS Inc., Chicago, Illinois) to identify groups of older adults with distinct patterns of socioeconomic
characteristics using 11 SES factors as categorical variables.
A two-step cluster analysis was chosen because it is a scal- able cluster analysis algorithm designed to handle large data sets with mixed continuous and categorical data.
Following the procedures outlined by Norušis [22], the number of clusters was based on the best combination of low Bayesian Information Criterion (BIC), a high ratio of distance measures, and a high ratio of BIC changes. SES levels were attributed to clusters of people based on the author’s interpretation of which indicators were more present in each cluster. To validate the cluster solution, x2 (or Fisher's exact test, as appropriate) test was used (the cluster as the independent variable and socioeconomic characteristics as the dependent variables).
Differences in the cardiovascular health outcomes among the identified clusters were analyzed using the x2 test for categorical variables and one-way ANOVA for continuous variables with a Tukey’s post hoc test when necessary. All analyses were performed after considering primary sampling units, stratification, and sample weights which ensure the analysis results are representative of the target population. Missing value analysis was performed on each scale considered for analysis, as the two-step meth- od does not tolerate missing values and would have ex- cluded any sample with missing values [22]. Cases with missing data points were relatively few (<15% for all vari- ables); thus, the single imputation technique was used to preserve sample size. Missingness of continuous variables was replaced with mean substitutions. Missing values among categorical variables were replaced by the most common response. A two-tailed t-test with ⍺=.050 was used to assess statistical significance.
RESULTS
1. Sociodemographic Characteristics of Participants by Cluster
Table 1 summarizes the participants’ sociodemographic characteristics by cluster. A three-cluster solution (BIC=
26,530.16, a ratio of distance measures=1.62, a ratio of BIC changes=0.60) was selected (p<.001): high (n=715; cluster 1), middle (n=1,425; cluster 2), and low-SES clusters (n=
1,163; cluster 3). Adults among the low-SES cluster were older than among the other two; this is explained by the largest proportion of adults aged over 75 years (56.7% in this cluster vs. 40.0% in the middle-SES and 18.3% in the high-SES clusters. Participants in this cluster were more likely to be women (82.7%) compared to the other two clusters.
Table 1. Sociodemographic Characteristics of Participants by Cluster (N=3,303)
Characteristics Categories
Cluster 1† (n=715)
Cluster 2‡ (n=1,425)
Cluster 3§ (n=1,163)
Total
(n=3,303) x2 p
n (%) n (%) n (%) n (%)
Age (year) 65~74
≥75
584 (81.7) 131 (18.3)
855 (60.0) 570 (40.0)
503 (43.3) 660 (56.7)
1,942 (58.8) 1,361 (41.2)
244.78 <.001
Gender Men
Women
481 (67.3) 234 (32.7)
758 (53.2) 667 (46.8)
200 (17.2) 963 (82.8)
1,439 (43.6) 1,864 (56.4)
626.62 <.001
Income High
Middle-high Middle-low Low
185 (25.9) 211 (29.5) 198 (27.7) 121 (16.9)
448 (31.4) 355 (24.9) 291 (20.4) 331 (23.3)
191 (16.4) 242 (20.8) 337 (29.0) 393 (33.8)
824 (24.9) 808 (24.5) 826 (25.0) 845 (25.6)
97.28 <.001
Having private insurance
Yes No
412 (57.6) 303 (42.4)
549 (38.5) 876 (61.5)
300 (25.8) 863 (74.2)
1,261 (38.2) 2,042 (61.8)
192.51 <.001
House ownership Yes No
630 (88.1) 85 (11.9)
1,250 (87.7) 175 (12.3)
590 (50.8) 573 (49.2)
2,470 (74.8) 833 (25.2)
365.04 <.001
Marital status Married/partnered Nonmarried/unpartnered
700 (97.9) 15 (2.1)
1,328 (93.2) 97 (6.8)
176 (15.1) 987 (84.9)
2,204 (66.7) 1,099 (33.3)
2,249.43 <.001
Living arrangement
≥2 people in the household Living alone
1,064 (91.5) 99 (8.5)
939 (65.9) 486 (34.1)
489 (68.4) 226 (31.6)
2,492 (75.4) 811 (24.6)
281.02 <.001
Working status Employment Unemployment
715 (100.0) 0 (0.0)
314 (22.0) 1,111 (78.0)
0 (0.0) 1,163 (100.0)
971 (29.4) 2,332 (70.6)
2,351.80‖ <.001
Recipients of NBLSS
No Yes
713 (99.7) 2 (0.3)
1,279 (89.7) 146 (10.3)
775 (66.6) 388 (33.4)
2,767 (83.8) 536 (16.2)
843.85‖ <.001
Type of national insurance
Self-employed insurance Employee insurance Korean Medicaid
251 (35.1) 463 (64.8) 1 (0.1)
471 (33.0) 952 (66.8) 2 (0.2)
324 (27.8) 620 (53.3) 220 (18.9)
1,046 (31.7) 2,035 (61.6) 223 (6.7)
208.98 <.001
Geographical location
Urban Rural
574 (80.3) 141 (19.7)
966 (67.8) 459 (32.2)
706 (60.7) 457 (39.3)
2,246 (68.0) 1,057 (32.0)
48.95 <.001
NBLSS=National Basic Livelihood Security System; †Cluster 1=High socioeconomic status group; ‡Cluster 2=Middle socioeconomic status group; §Cluster 3=Low socioeconomic status group; ‖Fisher's exact test.
The low-SES cluster also included the largest propor- tion of people in the two poorest income quintiles (62.8%), while the high-SES cluster reported living in every income quintile except for the poorest. The low-SES cluster re- ported the lowest rates of people with private health in- surance (25.8%) and homeownership (50.8%); in contrast, the high-SES cluster had the highest rate of people with pri- vate health insurance (57.6%) and homeownership (88.1%) among the three clusters. The low-SES cluster included the lowest proportion of married people (15.1%) and the high- est proportion of people living alone (31.6%). No partic- ipants in the low-SES cluster were currently employed, whereas a high number of employed people were repre- sented in the middle-SS (22.0%) and high-SES clusters (100.0%).
Older adults in the low-SES cluster were more likely to
be recipients of NBLSS than those in the other two clusters (33.4% in this cluster vs. 10.3% in the middle-SES and 0.3%
in the high-SES clusters). They exhibited the highest pro- portion of Korean Medicaid beneficiaries (18.9%) com- pared to the other two clusters (0.2% and 0.1%, for middle and high, respectively). They also reported the highest pro- portion of people living in rural settings (39.4%) compared to those in middle-SES (32.2%) and high-SES (19.7%) clusters.
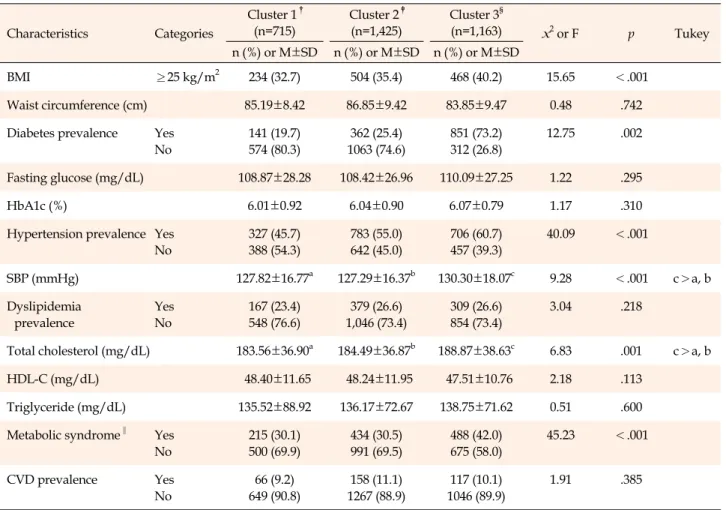
2. Cardiovascular Health Outcomes of Participants by Cluster
Significant differences in cardiovascular health out- comes were noted among the clusters (Table 2). The three clusters differed significantly in the prevalence of diabetes
Table 2. Cardiovascular Health Outcomes of Participants by Cluster (N=3,303)
Characteristics Categories
Cluster 1† (n=715)
Cluster 2‡ (n=1,425)
Cluster 3§
(n=1,163) x2 or F p Tukey
n (%) or M±SD n (%) or M±SD n (%) or M±SD
BMI ≥25 kg/m2 234 (32.7) 504 (35.4) 468 (40.2) 15.65 <.001
Waist circumference (cm) 85.19±8.42 86.85±9.42 83.85±9.47 0.48 .742
Diabetes prevalence Yes No
141 (19.7) 574 (80.3)
362 (25.4) 1063 (74.6)
851 (73.2) 312 (26.8)
12.75 .002
Fasting glucose (mg/dL) 108.87±28.28 108.42±26.96 110.09±27.25 1.22 .295
HbA1c (%) 6.01±0.92 6.04±0.90 6.07±0.79 1.17 .310
Hypertension prevalence Yes No
327 (45.7) 388 (54.3)
783 (55.0) 642 (45.0)
706 (60.7) 457 (39.3)
40.09 <.001
SBP (mmHg) 127.82±16.77a 127.29±16.37b 130.30±18.07c 9.28 <.001 c>a, b
Dyslipidemia prevalence
Yes No
167 (23.4) 548 (76.6)
379 (26.6) 1,046 (73.4)
309 (26.6) 854 (73.4)
3.04 .218
Total cholesterol (mg/dL) 183.56±36.90a 184.49±36.87b 188.87±38.63c 6.83 .001 c>a, b
HDL-C (mg/dL) 48.40±11.65 48.24±11.95 47.51±10.76 2.18 .113
Triglyceride (mg/dL) 135.52±88.92 136.17±72.67 138.75±71.62 0.51 .600
Metabolic syndrome‖ Yes No
215 (30.1) 500 (69.9)
434 (30.5) 991 (69.5)
488 (42.0) 675 (58.0)
45.23 <.001
CVD prevalence Yes
No
66 (9.2) 649 (90.8)
158 (11.1) 1267 (88.9)
117 (10.1) 1046 (89.9)
1.91 .385
BMI=body mass index; CVD=cardiovascular disease; HDL-C=high-density lipoprotein-cholesterol; M=mean; SBP=systolic blood pressure;
SD=standard deviation; †Cluster 1=High socioeconomic status group; ‡Cluster 2=Middle socioeconomic status group; §Cluster 3=Low socioeconomic status group; ‖The presence of metabolic syndrome was based on the NCEP ATP III guidelines.
(p<.010), hypertension (p<.001), and metabolic syndrome (p<.001), with greater prevalence in the lower SES clu- sters. Similarly, SBP (p<.001), BMI (p<.010), and total cholesterol (p<.010) differed significantly among the clus- ters in the same pattern. However, no significant differ- ences were observed in the prevalence of dyslipidemia, waist circumference, fasting glucose, HbA1c, HDL-C, tri- glyceride, and the prevalence of CVDs among clusters.
DISCUSSION
Using cluster analysis, older adults were categorized in- to low-, middle-, and high-SES clusters. Older adults of lower SES clusters exhibited significantly higher CVD risk factors. Importantly, our approach provided a detailed overview of important SES factors that mutually contrib- ute to CVD risk. For instance, we demonstrated that lower SES clusters comprised older adults who lived at the inter- section of less favorable material conditions (e.g. low in-
come, no home ownership, no private insurance, or un- employed) had adverse outcomes, which highlights “the material hypothesis” [23,24]. This approach differs from early Korean studies of older adults which tended to re- port health outcomes of those in income poverty vs. those above the poverty line [12,13]; these studies overlooked the significance of material resources for explicating the health of this population group, which protected house- hold budgets from expensive care and ensured access to healthcare.
Among the material factors that contributed to adverse cardiovascular health, and when combined with other SES risk factors, the findings on employment was particularly noticeable: no individuals in the low-SES cluster were em- ployed at the time of the survey, whereas those in the high-SES cluster were all employed. Although Korea’s average age of labor market exit is the highest among OECD countries at 72.90 years for men and 73.10 years for women [19], unemployment among older adults remains
a burgeoning problem despite the recognized value of this demographic in Korean society [25]. Thus, our results in- dicate the need to urgently address the impact of un- employment on CVD risk, especially among older adults in the low-SES cluster identified in our analysis.
The study included marital status and living arrange- ments (i.e. indices of social networks and support) as SES factors and demonstrated that those who were non- married/unpartnered or lived alone mostly belonged to the low-SES cluster and had higher CVD risk factors.
Studies emphasizing this “social-relational” aspect posits that health disparities cannot be entirely explained by well-known financial barriers or material factors [26,27].
Yet, such social-relational aspects as disparity factors re- lating to cardiovascular health among older individuals have not received much attention in research in Korean [13]. This discussion is important as an increasing number of older adults are living alone in Korea [28]. The actual re- marriage or cohabitation rate among oldest-old adults re- mains very low due to traditional social norms and lower economic status [29]. Our findings demonstrate that the proportion of people aged 75 and over were more con- centrated in the lower SES cluster.
This study included gender-related data for analysis and evaluated intersecting identities with other SES fac- tors, which is a study design differing from most Korean studies of disparity that adopt separate gender analysis for research in this field [12,13]. Whilst there is no optimal re- search method for gender analysis, there is a growing awareness of the importance for research to move beyond simple binary thinking to consider how gender differences vary within specific situations or contexts; intersection- ality is a way of thinking about this more complex profile of disparity [30]. Consequently, this study found that there are more women with multiple simultaneous socio- economic disadvantages (e.g., no private insurance, un- employed, etc.) than men in the lower SES cluster-i.e., the group with significantly higher CVD risk factors. This agrees with the argument that connects an increased rate of cardiovascular events with the perception of “women’s inferiority.” Within patriarchal society, elderly Korean women have existed in a subservient position to men; this culture subordinates low-SES elderly Korean women so- cially and economically, prevents their pursuit of health resources, and makes them more vulnerable to facing un- desirable health events [31]. Considering this situation in Korea with our findings emphasizes the need to improve the cardiovascular health of disadvantaged elderly wom- en and ensure their health equity.
Clinically, intersecting SES risk factors identified in this
study can suggest vulnerability markers, identifying in- dividuals who need either more medical attention or clos- er follow-up care. This approach could also identify sub- groups who would benefit from structural interventions, such as alleviating socioeconomic barriers to hospital ac- cess or specialized cardiovascular care. Further, the re- gression analyses revealed that the lower SES clusters have a significantly higher prevalence of diabetes, hyper- tension, total cholesterol, and obesity than the higher ones.
Importantly, these CVD risk factors did not decrease in re- cent years, particularly in those with low SES in Korea [32]. This underscores the need to focus on improving screening, early detection, and treatment for patients with such risk factors. The prevalence of metabolic syndrome was significantly higher in this cluster. This additional finding on “integrated CVD risk” evaluation is also im- portant, as existing clinical guidelines commonly recom- mend applying primary interventions according to the magnitude of the integrated risk [33].
In this study, we identified “upstream” SES factors that affect cardiovascular health simultaneously with in- dividual-level factors: people on public assistance or Korean Medicaid or those who reside in rural areas con- stitute a high proportion of the lower SES clusters with higher CVD risk. Such results are important for Korea, where the government’s socioeconomic support system for older adults remains unsatisfactory, which raises con- cerns regarding health-related issues [34]. The high out- of-pocket payment in public assistance and limited benefit coverage in the Korean Medicaid system work as barriers to healthcare utilization, particularly in impoverished old- er adults. Additionally, the introduction of the Designated Doctor System to lessen Medicaid expenditures results in inconvenience in hospital use, particularly among the ru- ral Medicaid beneficiaries [35]. From a policy standpoint, this provides strong support for policies that reduce over- all CVD risk disparities.
We acknowledge several limitations of this study. First, our study design could not conclude causality between SES and cardiovascular health. Second, as some infor- mation was self-reported (e.g., SES, pre-existing medical conditions, etc.), we could not entirely exclude the possi- bility of response bias. Third, the results may not be wide- ly applicable since SES conditions for older adults vary be- tween different countries depending on their historical, social, and cultural contexts. Fourth, SES variables in- cluded in the secondary dataset potentially lacked depth because they were operationally defined by a single sur- vey item or a subset of test items. For instance, unemploy- ment does not necessarily reflect real income or welfare,
for it can be argued that unemployed older adults today are materially better off than when fully employed.
Additionally, living arrangements may include a range of relationship variations that are not reflected by any sin- gular indicator. Fifth, education was not considered as the relative homogeneity of the sample concerning education variables (i.e., the majority of older adults belonged in the
“little to no education” category), limiting our ability to detect education-related disparities in the outcome. Sixth, biomarkers reported in the dataset were measured at one point in time, which may affect the statistical validity of our conclusion. Last, the single imputation used in this study may reduce data variability, resulting in the under- estimation of variances and standard errors.
Despite these limitations, this study demonstrates sev- eral strengths. First, an integrated socioeconomic indicator was developed and tested based on important SES in- dicators that adequately reflect disparities in cardiovas- cular health among older adults, which can be considered in future research. Second, the large sample size provided statistical power to determine robust relationships within clusters. Third, we used population-based data, signifi- cantly reducing the likelihood of selection bias. Last, this study provided preliminary evidence for the disparity me- chanisms in CVD risk factors, which can suggest a clear role for the prevention of CVD morbidity and mortality, particularly for those with low SES.
CONCLUSION
Our study approach improved understanding of inter- secting SES risk factors as associated with cardiovascular health among the older adult population. Importantly, we found out that CVD risk factors are significantly higher in the lower SES cluster which has a higher portion of those aged over 75 years, women, with a lower income, without private insurance and homeownership, single or living alone, unemployed, on public assistance, Korean Medi- caid beneficiaries, and living in rural areas.
Our study has several implications for future research, clinical studies, and policy. First, studies targeting older adults should adopt fundamentally different conceptual approaches for measuring SES associated with cardiovas- cular health. Second, several intersecting SES risk factors identified in this study could be vulnerability indicators, identifying individuals who require more targeted screen- ing, early detection, or focused medical attention. Last, the primary challenge for public professionals is to design tail- ored health policies that consider the socioeconomic varia- bility within the older adult population.
CONFLICTS OF INTEREST
The author declared no conflict of interest.
AUTHORSHIP
Study conception and design acquisition, data collection, analyz- ing the data, and drafting and critical revision of the manuscript - LC-Y.
ACKNOWLEDGEMENT
This study received the institutional review board approval from Duke University(protocol number: Pro00103112).
REFERENCES
1. Clark AM, DesMeules M, Luo W, Duncan AS, Wielgosz A.
Socioeconomic status and cardiovascular disease: risks and implications for care. Nature Reviews Cardiology. 2009;6(11):
712-22. https://doi.org/10.1038/nrcardio.2009.163
2. Schultz WM, Kelli HM, Lisko JC, Varghese T, Shen J, Sande- sara P, et al. Socioeconomic status and cardiovascular out- comes: challenges and interventions. Circulation. 2018;137(20):
2166-78.
https://doi.org/10.1161/CIRCULATIONAHA.117.029652 3. Schumann B, Kluttig A, Tiller D, Werdan K, Haerting J, Greiser
KH. Association of childhood and adult socioeconomic in- dicators with cardiovascular risk factors and its modification by age: the CARLA Study 2002-2006. BMC Public Health. 2011;
11:289. https://doi.org/10.1186/1471-2458-11-289
4. Myers V, Gerber Y. Socioeconomic aspects of cardiovascular Health. In: Wakabayashi I, Groschner K, editors. Interdisciplinary concepts in cardiovascular health. Vienna: Springer; 2013. p.
187-203.
5. Adler N, Bush NR, Pantell MS. Rigor, vigor, and the study of health disparities. Proceedings of the National Academy of Sciences. 2012;109(Suppl 2):17154-9.
https://doi.org/10.1073/pnas.1121399109
6. Omorou AY, Coste J, Escalon H, Vuillemin A. Patterns of phys- ical activity and sedentary behaviour in the general population in France: cluster analysis with personal and socioeconomic cor- relates. American Journal of Public Health. 2016;38(3):483-92.
https://doi.org/10.1093/pubmed/fdv080
7. Winker G, Degele N. Intersectionality as multi-level analysis:
dealing with social inequality. European Journal of Women's Studies. 2011;18(1):51-66.
https://doi.org/10.1177/1350506810386084
8. Cabieses B, Tunstall H, Pickett K. Understanding the socio- economic status of international immigrants in Chile through hierarchical cluster analysis: a population-based study. Inter- national Migration. 2015;53(2):303-20.
https://doi.org/10.1111/imig.12077
9. Everage NJ, Linkletter CD, Gjelsvik A, McGarvey ST, Loucks EB.
Social and behavioral risk marker clustering associated with bio- logical risk factors for coronary heart disease: NHANES 2001- 2004. BioMed Research International. 2014;e389853.
https://doi.org/10.1155/2014/389853
10. Aungkulanon S, Tangcharoensathien V, Shibuya K, Bundham- charoen K, Chongsuvivatwong V. Area-level socioeconomic deprivation and mortality differentials in Thailand: results from principal component analysis and cluster analysis. International Journal for Equity in Health. 2017;16:117.
https://doi.org/10.1186/s12939-017-0613-z
11. Mirowsky JE, Devlin RB, Diaz-Sanchez D, Cascio W, Grabich SC, Haynes C, et al. A novel approach for measuring residential socioeconomic factors associated with cardiovascular and met- abolic health. Journal of Exposure Science & Environmental Epidemiology. 2017;27(3):281-9.
https://doi.org/10.1038/jes.2016.53
12. Lee CY, Im EO. Socioeconomic disparities in cardiovascular health in South Korea: a systematic review. Journal of Cardio- vascular Nursing. 2021;36(1):8-22.
https://doi.org/10.1097/JCN.0000000000000624
13. Lee CY, Lee YH. Measurement of socioeconomic position in re- search on cardiovascular heath disparity in South Korea: a sys- tematic review. Journal of Preventive Medicine and Public Health. 2019;52(5):281-91.
https://doi.org/10.3961/jpmph.19.094
14. Khang YH, Kim HR. Socioeconomic Inequality in mortality us- ing 12-year follow-up data from nationally representative sur- veys in South Korea. International Journal for Equity in Health.
2016;15:15-51. https://doi.org/10.1186/s12939-016-0341-9 15. Park SJ, Kang HT, Nam CM, Park BJ, Linton JA, Lee YJ. Sex dif-
ferences in the relationship between socioeconomic status and metabolic syndrome: the Korean National Health and Nutrition Examination Survey. Diabetes Research and Clinical Practice.
2012;96(3):400-6.
https://doi.org/10.1016/j.diabres.2011.12.025
16. Warner LR. A best practices guide to intersectional approaches in psychological research. Sex Roles. 2008;59(5-6):454-63.
https://doi.org/10.1007/s11199-008-9504-5
17. Lee C, Chee W, Im EO. TCTAP A-098 Inequalities in cardio- vascular health among older adults in South Korea: the role of personal-, provider-and system-level factors. Journal of the American College of Cardiology. 2019;73(Suppl 15):S52.
18. Wang S. SES, social interaction, and health status. In: Hoshi T, Kodama S, editors. The structure of healthy life determi- nants. International Perspectives on Aging. Vol 18. Singapore:
Springer; 2018. p. 83-102.
19. Organization for Economic Cooperation and Development (OECD). Working better with age: Korea. Paris: OECD Publish- ing; 2018 [cited 2020 June 10]. Available from:
https://www.oecd-ilibrary.org/sites/9789264208261-en/index .html?itemId=/content/publication/9789264208261-en 20. World Health Organization. The Asia-Pacific perspective: re-
defining obesity and its treatment. IOTF, Health Communica- tions Australia: Brisbane; 2000.
21. Cleeman JI, Grundy SM, Becker D, Clark L. Expert panel on detection, evaluation and treatment of high blood cholesterol in adults. Executive summary of the third report of the National Cholesterol Education Program (NCEP) Adult Treatment Panel (ATP III). Journal of the American Medical Association. 2001;
285(19):2486-97.
22. Norušis MJ. IBM SPSS statistics 19 statistical procedures com- panion. Vol 496. Upper Saddle River, NJ, USA: Prentice Hall;
2012.
23. Lynch JW, Smith GD, Kaplan GA, House JS. Income inequality and mortality: importance to health of individual income, psy- chosocial environment, or material conditions. British Medical Journal. 2000;320(7243):1200-4
24. Truesdale BC, Jencks C. The health effects of income inequal- ity: averages and disparities. Annual Review of Public Health.
2016;37:413-30.
https://doi.org/10.1146/annurev-publhealth-032315-021606 25. Lee J, Kim MH. The effect of employment transitions on phys-
ical health among the elderly in South Korea: a longitudinal analysis of the Korean Retirement and Income Study. Social Science & Medicine. 2017;181:122-30.
https://doi.org/10.1016/j.socscimed.2017.04.002
26. Uphoff EP, Pickett KE, Cabieses B, Small N, Wright J. A sys- tematic review of the relationships between social capital and socioeconomic inequalities in health: a contribution to under- standing the psychosocial pathway of health inequalities.
International Journal for Equity in Health. 2013;12:54.
https://doi.org/10.1186/1475-9276-12-54
27. Arcaya MC, Arcaya AL, Subramanian SV. Inequalities in health:
definitions, concepts, and theories. Global Health Action. 2015;
8(1):27106. https://doi.org/10.3402/gha.v8.27106
28. Statistics Korea. Changes in the proportion of older adults liv- ing alone [Internet]. Seoul: Statistics Korea; 2020 [cited 2020 June 9]. Available from:
https://www.index.go.kr/unify/idx-info.do?idxCd=4233 29. Lee MA. Effects of economic and health conditions on the tran-
sition to living alone: a longitudinal study on older Koreans.
Development and Society. 2016;45(3):591-617.
30. Scott N, Siltanen J. Gender and intersectionality-A quantita- tive toolkit for analyzing complex inequalities. Employment and Social Development Canada; 2020 [cited 2020 June 10].
Available from:
http://www.janetsiltanen.ca/toolkitenglish.pdf
31. Laura CN, Cho H. Women, gender, and social change in South Korea since 1945. In: Seth MJ, editor. Routledge handbook of
modern Korean history. Routledge: Taylor & Francis Group;
2016. p. 326-39.
32. Hwang J, Lee EY, Lee CG. Measuring socioeconomic inequal- ities in obesity among Korean adults, 1998-2015. International Journal of Environmental Research and Public Health. 2019;16 (9):1617. https://doi.org/10.3390/ijerph16091617
33. Zhao D, Liu J, Xie W, Qi Y. Cardiovascular risk assessment:
a global perspective. Nature Reviews Cardiology. 2015;12(5):
301-11. https://doi.org/10.1038/nrcardio.2015.28
34. Jeon B, Noguchi H, Kwon S, Ito T, Tamiya N. Disability, pov-
erty, and role of the basic livelihood security system on health services utilization among the elderly in South Korea. Social Science & Medicine. 2017;178:175-83.
https://doi.org/10.1016/j.socscimed.2017.02.013
35. Kim MJ, Cho YH, Park NH. The effects of the designated doc- tor system on health care utilization of medical aid beneficia- ries with chronic diseases. Journal of Korean Academy of Com- munity Health Nursing. 2015;26(3):278-91.
https://doi.org/10.12799/jkachn.2015.26.3.278