ABSTRACT
Purpose: The aim of this study was to compare the characteristic expression patterns of advanced periodontitis in 2 cohort data sets analyzed using different microarray platforms, and to identify differentially expressed genes (DEGs) through a meta-analysis of both data sets.
Methods: Twenty-two patients for cohort 1 and 40 patients for cohort 2 were recruited with the same inclusion criteria. The 2 cohort groups were analyzed using different platforms:
Illumina and Agilent. A meta-analysis was performed to increase reliability by removing statistical differences between platforms. An integrative meta-analysis based on an empirical Bayesian methodology (ComBat) was conducted. DEGs for the integrated data sets were identified using the limma package to adjust for age, sex, and platform and compared with the results for cohorts 1 and 2. Clustering and pathway analyses were also performed.
Results: This study detected 557 and 246 DEGs in cohorts 1 and 2, respectively, with 146 and 42 significantly enriched gene ontology (GO) terms. Overlapping between cohorts 1 and 2 was present in 59 DEGs and 18 GO terms. However, only 6 genes from the top 30 enriched DEGs overlapped, and there were no overlapping GO terms in the top 30 enriched pathways.
The integrative meta-analysis detected 34 DEGs, of which 10 overlapped in all the integrated data sets of cohorts 1 and 2.
Conclusions: The characteristic expression pattern differed between periodontitis and the healthy periodontium, but the consistency between the data sets from different cohorts and metadata was too low to suggest specific biomarkers for identifying periodontitis.
Keywords: Meta-analysis; Microarray analysis; Periodontitis; Transcriptome
INTRODUCTION
The analysis of patients' transcriptome profiles can reveal molecular mechanisms underlying disease [1]. The pathogenesis of periodontal disease has been suggested to involve a host response against microbial alterations [2], and various attempts have been made to evaluate
Research Article
Yoon-Seon Jeon 1, Manu Shivakumar 2, Dokyoon Kim 2, Chang-Sung Kim 1, Jung-Seok Lee 1,*
1 Department of Periodontology, Research Institute for Periodontal Regeneration, Yonsei University College of Dentistry, Seoul, Korea
2 Department of Biostatistics, Epidemiology and Informatics, The Perelman School of Medicine, University of Pennsylvania, Philadelphia, PA, USA
Reliability of microarray analysis for studying periodontitis: low
consistency in 2 periodontitis cohort data sets from different platforms and an integrative meta-analysis
Received: Mar 30, 2020 Revised: Jul 14, 2020 Accepted: Sep 24, 2020
*Correspondence:
Jung-Seok Lee
Department of Periodontology, Research Institute for Periodontal Regeneration, Yonsei University College of Dentistry, 50 Yonsei-ro, Seodaemun-gu, Seoul 03722, Korea.
E-mail: [email protected] Tel : +82-2-2228-3187 Fax: +82-2-392-0398
Copyright © 2021. Korean Academy of Periodontology
This is an Open Access article distributed under the terms of the Creative Commons Attribution Non-Commercial License (https://
creativecommons.org/licenses/by-nc/4.0/).
ORCID iDs Yoon-Seon Jeon
https://orcid.org/0000-0001-8817-1450 Manu Shivakumar
https://orcid.org/0000-0003-4733-7375 Dokyoon Kim
https://orcid.org/0000-0002-4592-9564 Chang-Sung Kim
https://orcid.org/0000-0003-3902-1071 Jung-Seok Lee
https://orcid.org/0000-0003-1276-5978 Funding
This study was supported by the National Research Foundation of Korea (NRF) funded by the Ministry of Science, ICT & Future Planning (grant No. NRF-2019R1A2C4069942).
Author Contributions
Conceptualization: Jung-Seok Lee; Formal analysis: Manu Shivakumar, Dokyoon Kim;
Periodontal Science
Investigation: Manu Shivakumar, Dokyoon Kim; Methodology: Yoon-Sun Jeon; Project Administration: Yoon-Sun Jeon; Writing - original draft: Yoon-Sun Jeon, Jung-Seok Lee;
Writing - review & editing: Yoon-Sun Jeon, Jung-Seok Lee, Chang-Sung Kim.
Conflict of Interest
No potential conflict of interest relevant to this article was reported.
gene expression from gingival/periodontal tissue in periodontal lesions, focusing on the host response regarding the initiation or progression of periodontitis [3-5]. Previous studies have found different transcriptome profiles in periodontitis patients and healthy subjects [3,5-8], and many researchers and clinicians have expected that analyses of gene expression would clarify the phenotype of periodontitis and its underlying mechanism. However, previous studies have produced inconsistent and unreproducible results, and there is currently no consensus about the specific features of host responses in periodontal disease.
Gene expression can be affected by the timing of periodontal disease processes and the type of periodontitis. In an experimental gingivitis model, it was found that IL-1A, IL1B, IL8, RANTES, and CSF3 played crucial roles in the induction and resolution of gingivitis [5].
Generalized aggressive periodontitis lesions showed significant up-regulation of TNFRSF17, FCRL5, MZB1, and DSC1, and the authors suggested that these genes could serve as biomarkers of the periodontitis phenotype [7]. Other studies of generalized chronic periodontitis suggested that ZNF823, XBP1, RORA, TFAP2C, and ZNF57 are specific master regulators in periodontal disease processes [9]. However, even though specific genes have been suggested for certain types of periodontal disease classified based on only their clinical features, the clinical diagnosis of periodontitis does not correspond to the transcriptome profile pattern in reverse [10].
These variations in results might be also due to the specific methodologies used (e.g., microarray or RNA sequencing) or the use of application platforms from different
manufacturers. A study using spatial transcriptome analysis found that IGLL5, SSR4, MZB1, and XBP1 played key roles in chronic inflammatory lesions [11]. Massive parallel sequencing revealed that interferon regulatory factor 4 and chemokine (C-C motif ) ligand 18 were up-regulated in periodontitis-affected tissue [6]. In particular, the expansion of microarray techniques has led to the emergence of a large number of commercial microarray platforms, which has raised concerns about inter-platform consistency [12]. A cross-platform study of human tissue [13]
found that the gene expression profile was substantially dependent on the microarray platform used, with the greatest similarity found for data analyzed using the same platform.
Meta-analyses of microarray data sets have been increasingly employed to integrate data across platforms to make the results of microarray analyses more consistent and powerful [14]. Meta-analyses are useful when merging multiple datasets with a limited sample size, thereby improving the statistical power. This method has recently been applied to identify differentially expressed genes (DEGs) in breast cancer [15], pancreatic ductal adenocarcinoma [16], and ovarian cancer [17].
The purpose of this study was to compare the characteristic expression patterns of familial aggregated, generalized advanced periodontitis in 2 cohort data sets analyzed using different microarray platforms, and to identify consistent DEGs by performing an integrative meta- analysis of these 2 different data sets.
MATERIALS AND METHODS
Study design
Two clinical cohort data sets of healthy patients and patients with periodontitis were prospectively enrolled from the Department of Periodontology, Yonsei University Dental
Hospital by applying the same inclusion and exclusion criteria. Cohort 1 comprised 22 patients (12 with generalized advanced periodontitis and 10 with a healthy periodontium) recruited from September 2014 to September 2015, while cohort 2 comprised 40 patients (20 in the periodontitis group and 20 healthy subjects) recruited from August 2016 to February 2018. The data for the first cohort partially overlap with data published elsewhere for other experimental purposes (submitted data).
The experimental protocols and informed consent forms were designed according to the Declaration of Helsinki (Tokyo version revisited in 2004) and Good Clinical Practice guidelines.
Each investigation was approved by the Institutional Review Board for Clinical Research of Yonsei University Dental Hospital (approval No. 2-2014-0026 and 2-2016-0012). Each patient provided informed written consent. The manuscript was prepared following the guidelines of the Strengthening the Reporting of Observational studies in Epidemiology statement.
Inclusion and exclusion criteria
The same inclusion and exclusion criteria were applied when recruiting each of the 2 independent cohorts. Patients enrolled in the periodontitis group had generalized severe periodontal inflammation, as well as >50% of alveolar bone loss along with the dental root on radiography, with clinical features of a probing depth of >7 mm, clinical attachment loss of >5 mm, and easy bleeding on probing. Additionally, they had a familial aggregation of severe periodontitis. Based on the consensus report of the 2017 World Workshop on the Classification of Periodontal and Peri-Implant Diseases and Conditions, patients who could be diagnosed with generalized periodontitis in stages III and IV with grade C (rapid progression) were enrolled in the periodontitis group.
The patients in the healthy group required gingivectomy for crown-lengthening procedures in a region that had no signs of gingival/periodontal inflammation, no bleeding on probing, a probing depth of <3 mm, and no evidence of alveolar bone loss.
The following exclusion criteria were applied: current or history of smoking, currently pregnant or lactating, any systemic diseases that affect periodontal status or the periodontal healing process (e.g., diabetes and malignancy), and a history of taking drugs that affect periodontal status (e.g., calcium-channel blockers, phenytoin, and cyclosporine).
Gingival tissue collection
All patients received nonsurgical periodontal treatment, scaling, and root planing at 2–4 weeks before collecting gingival tissue. In the periodontitis group, gingival tissues were harvested during flap surgery around teeth showing a probing depth of >7 mm and bleeding on probing. Samples were obtained with a size of 3 mm and included the marginal gingiva, connective tissue, and periodontal pocket. Healthy gingival tissues were taken from sites with a probing depth of <3 mm and no bleeding on probing. All samples were immediately stored in RNAlater solution (RNAlater Stabilization Solution AM7020, Life Technologies, Carlsbad, CA, USA) at room temperature for 24 hours, and then subsequently at −80°C.
RNA isolation
Total RNA was isolated from the gingival tissues of each patient using TRIzol LS Reagent (Invitrogen, Carlsbad, CA, USA) according to the manufacturer's protocol. RNA was isolated from saliva using the Oragene RNA purification protocol with the Qiagen RNeasy Micro kit (Qiagen, Valencia, CA, USA).
Quality and quantity of RNA
Quality and quantity control tests were applied to the isolated total RNA samples before the microarray analysis was performed. The RNA concentration (in nanograms per microliter) and purity (absorbance ratios at 260 nm/280 nm and 260 nm/230 nm) were determined using a spectrophotometer (ND-1000, NanoDrop, Wilmington, DE, USA). The quality of the RNA was assessed using the Agilent 2100 bioanalyzer (Agilent Technologies, Santa Clara, CA, USA) based on the RNA integrity number (RIN). The criteria for quality control were an RIN >7, an absorbance ratio at 260 nm/280 nm >1.7, and an absorbance ratio at 260 nm/230 nm >1.0.
Microarray analysis
The 2 cohort data sets were analyzed using the different microarray platforms as follows:
Cohort 1: total RNA was amplified and purified using the TargetAmp-Nano Labeling Kit for the Illumina Expression BeadChip device (EPICENTRE, Madison, WI, USA) to yield biotinylated complementary RNA (cRNA) according to the manufacturer's instructions. Total RNA (100 ng) was reverse-transcribed to complementary DNA (cDNA) using a T7 oligo(dT) primer. Second-strand cDNA was synthesized, transcribed in vitro, and labeled with biotin- NTP. After purification, the cRNA was quantified using a spectrophotometer (ND-1000, NanoDrop). Biotinylated cRNAs were prepared from 0.55 μg of total RNA using the Illumina TotalPrep RNA Amplification Kit (Ambion, Austin, TX, USA). Labeled cRNA samples (750 ng) were hybridized to individual Human HT-12 (version 4.0) Expression BeadChip devices for 17 hours at 58°C according to the manufacturer's instructions (Illumina, San Diego, CA, USA). The array signals were detected using Amersham fluorolink streptavidin-Cy3 (GE Healthcare Bio-Sciences, Little Chalfont, UK) following the bead-array manual. Arrays were scanned using an Illumina bead-array confocal scanner.
Cohort 2: RNA labeling and hybridization were performed using the Agilent One- Color Microarray-Based Gene Expression Analysis protocol (version 6.5, 2010, Agilent Technologies). Total RNA (100 ng) from each sample was linearly amplified and labeled with Cy3-dCTP. The labeled cRNAs were purified by using an RNAeasy Mini Kit (Qiagen).
The concentration and specific activity of the labeled cRNAs (in units of picomoles of Cy3 per microgram of cRNA) were measured using the NanoDrop ND-1000 device (NanoDrop).
Each labeled cRNA (600 ng) was fragmented by adding 5 μL of 10× blocking agent and 1 μL of 25× fragmentation buffer, and then heated at 60°C for 30 minutes. Finally, 25 μL of 2× GE hybridization buffer was added to dilute the labeled cRNA. Hybridization solution (40 μL) was dispensed into the gasket slide and assembled in Agilent SurePrint G3 Human GE 8X60K microarrays (version 3, Agilent Technologies). The slides were incubated for 17 hours at 65°C in an Agilent hybridization oven, and then washed at room temperature using the Agilent One-Color Microarray-Based Gene Expression Analysis protocol (version 6.5, 2010, Agilent Technologies). The hybridized array was immediately scanned with an Agilent Microarray Scanner D (Agilent Technologies).
Raw data preparation and statistical analysis
Raw data were extracted using the software provided by each manufacturer: Illumina GenomeStudio (version 2011.1) Gene Expression Module (version 1.9.0) for cohort 1, and Agilent Feature Extraction Software (version 11.0.1.1) for cohort 2. The measured intensities of the array probes were transformed by taking the logarithms of values and normalizing them into quartiles. Statistical significance of the expression data was determined based on
the relative fold change and the independent t-test, in which the null hypothesis was that no difference existed among the 2 groups in a single cohort. The cutoff criterion for probes was a change of at least 2-fold, with a P value of <0.05.
Unsupervised hierarchical clustering analysis was performed using complete linkage and a Euclidean distance metric with the expression profile of DEGs. We used the DAVID analysis with gene ontology (GO) terms and the Kyoto Encyclopedia of Genes and Genomes databases, based on the Fisher exact test with P values corrected by the false discovery rate.
All data analysis and visualization of DEGs were conducted using R software (version 3.1.2).
Integrative meta-analysis
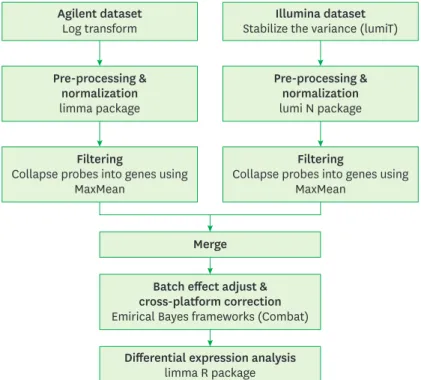
The Illumina expression data (cohort 1) were preprocessed by applying quantile normalization using the R package lumi [18]. Agilent expression data (cohort 2) were preprocessed by quantile normalization using the limma software package. The probes for each data set were collapsed into genes using the MaxMean method, which involves choosing the probe set with the maximum average signal across the samples. Data from both platforms were integrated using empirical Bayesian frameworks (ComBat) [19]. The ComBat method integrates data from multiple genes with similar expression distributions in each data set to estimate the average and variance in each gene [20]. From the integrated data sets, the genes most likely to be differentially expressed in periodontitis patients versus controls were selected by analyzing the gene expression microarray data with the limma software package.
The workflow of the meta-analysis is shown in Figure 1.
Filtering
Collapse probes into genes using MaxMean
Filtering
Collapse probes into genes using MaxMean
Pre-processing &
normalization limma package
Pre-processing &
normalization lumi N package Agilent dataset
Log transform Illumina dataset
Stabilize the variance (lumiT)
Merge Batch effect adjust &
cross-platform correction Emirical Bayes frameworks (Combat)
Differential expression analysis limma R package
Figure 1. Workflow of the integrative meta-analysis for integrating Illumina and Agilent expression data.
RESULTS
Patient characteristics
Table 1 lists the characteristics of cohorts 1 and 2. Cohort 1 consisted of 6 men and 6 women, with a mean age of 42.2 years (range, 30–50 years). Based on the consensus report of the 2017 World Workshop on the Classification of Periodontal and Peri-Implant Diseases and Conditions, 8 and 4 of the patients were diagnosed with periodontitis in stages 3 and 4, respectively. The healthy group consisted of 7 men and 3 women, with a mean age of 43.7 years (range, 20–71 years).
Cohort 2 consisted of 7 women and 13 men with a mean age of 46.7 years (range, 38–61 years), of whom 18 and 2 patients had periodontitis in stages 3 and 4, respectively. The healthy group consisted of 3 men and 17 women with a mean age of 40.7 years (range, 24–62 years).
Hierarchical clustering
Both cohort groups were divided into 2 groups based on the results of hierarchical clustering (Figure 2). In the results for both cohorts, each clustered group matched the grouping by clinical phenotype (periodontitis and healthy groups). However, the results for cohort 1, Table 1. Demographics of the study participants
Characteristics Cohort 1 (Illumina) Cohort 2 (Agilent)
No. of patients 12 20
Age (yr) 42.2 (30–50) 46.7 (38–61)
Sex
Male 6 (50) 7 (35)
Female 6 (50) 13 (65)
Periodontitis stage
I 0 0
II 0 0
III 8 (67) 18 (60)
IV 4 (33) 2 (40)
Data are number (%) or mean (range) values.
Hierarchical clustering of cohort 1 Hierarchical clustering of cohort 2
Healthy Periodontitis
A B
Figure 2. Hierarchical clustering and heatmap for (A) cohort 1 and (B) cohort 2.
a sample from the periodontitis group was exceptionally clustered with the healthy group.
In the result for cohort 2, 7 samples from the control group were clustered with the periodontitis group.
Differential gene expression profiling
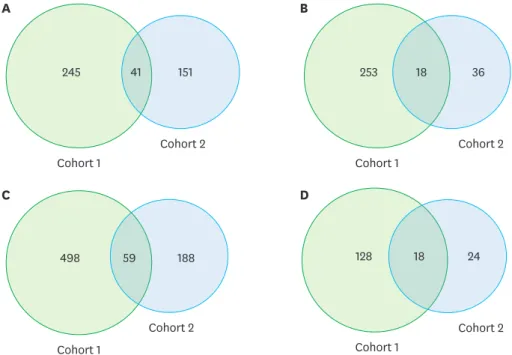
The 557 DEGs detected in cohort 1 comprised 286 that were up-regulated and 271 that were down-regulated, while the 246 DEGs detected in cohort 2 comprised 192 up-regulated and 54 down-regulated genes. Overlapping between the 2 cohorts was present in 59 DEGs, corresponding to 10.5% and 24% of the results for cohorts 1 and 2, respectively (Figure 3).
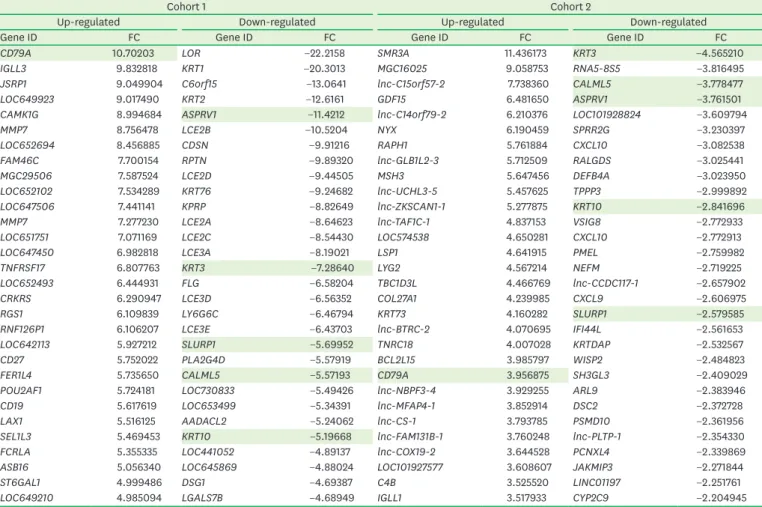
The overlapping DEGs are listed in detail in Supplementary Table 1. The top 30 up- and down-regulated genes, which represented the characteristic molecular signature of each cohort, showed 6 overlapping genes (CD79A, KRT3, KRT10, CALML5, ASPRV1, and SLURP1), which was more limited than the results for the entire list (Table 2).
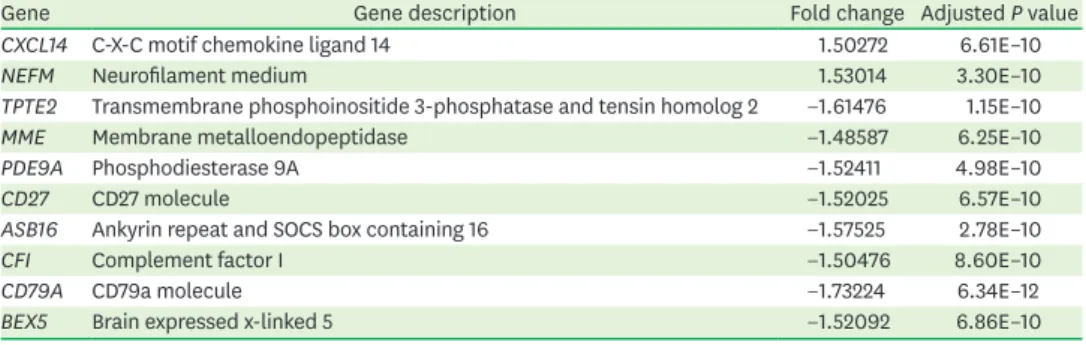
The integrative meta-analysis identified 34 genes as being differentially expressed, with a difference of at least 1.5-fold between the groups (Figure 4): 11 were up-regulated and 23 were down-regulated. The meta-analysis findings were also compared with those obtained by individual analyses in both data sets to evaluate the reproducibility and consistency across the microarray data sets. This analysis revealed that 29 genes were shared with the results for cohort 1 and 12 overlapped with the results for cohort 2. Ten of the genes were consistently identified by the 3 analysis methods (Table 3), while 3 genes (BFSP2, ACY3, and CRYBB1) were identified as DEGs in the integrative meta-analysis, but not in the individual analyses.
Pathway analysis
In cohorts 1 and 2, 146 and 42 GO terms were enriched, respectively. In cohort 1, the most- enriched pathway was related to epithelial differentiation and keratinization, followed by the immune response pathway. In cohort 2, the cellular process pathway was the most-enriched
A
Cohort 1
Cohort 2
245 41 151
B
Cohort 1
Cohort 2
253 36
C
Cohort 1
Cohort 2
498 59 188
D
Cohort 1
Cohort 2
128 18 24
18
Figure 3. Venn diagrams of (A) up-regulated genes, (B) down-regulated genes, (C) all of the differentially expressed genes, and (D) gene ontology terms detected in cohorts 1 and 2.
term, followed by other intracellular pathways. A comparison of all GO terms detected in each cohort revealed that 18 GO terms overlapped (d in Figure 4). In the top 30 enriched Table 2. Top 30 up- and down-regulated genes in cohorts 1 and 2
Cohort 1 Cohort 2
Up-regulated Down-regulated Up-regulated Down-regulated
Gene ID FC Gene ID FC Gene ID FC Gene ID FC
CD79A 10.70203 LOR −22.2158 SMR3A 11.436173 KRT3 −4.565210
IGLL3 9.832818 KRT1 −20.3013 MGC16025 9.058753 RNA5-8S5 −3.816495
JSRP1 9.049904 C6orf15 −13.0641 lnc-C15orf57-2 7.738360 CALML5 −3.778477
LOC649923 9.017490 KRT2 −12.6161 GDF15 6.481650 ASPRV1 −3.761501
CAMK1G 8.994684 ASPRV1 −11.4212 lnc-C14orf79-2 6.210376 LOC101928824 −3.609794
MMP7 8.756478 LCE2B −10.5204 NYX 6.190459 SPRR2G −3.230397
LOC652694 8.456885 CDSN −9.91216 RAPH1 5.761884 CXCL10 −3.082538
FAM46C 7.700154 RPTN −9.89320 lnc-GLB1L2-3 5.712509 RALGDS −3.025441
MGC29506 7.587524 LCE2D −9.44505 MSH3 5.647456 DEFB4A −3.023950
LOC652102 7.534289 KRT76 −9.24682 lnc-UCHL3-5 5.457625 TPPP3 −2.999892
LOC647506 7.441141 KPRP −8.82649 lnc-ZKSCAN1-1 5.277875 KRT10 −2.841696
MMP7 7.277230 LCE2A −8.64623 lnc-TAF1C-1 4.837153 VSIG8 −2.772933
LOC651751 7.071169 LCE2C −8.54430 LOC574538 4.650281 CXCL10 −2.772913
LOC647450 6.982818 LCE3A −8.19021 LSP1 4.641915 PMEL −2.759982
TNFRSF17 6.807763 KRT3 −7.28640 LYG2 4.567214 NEFM −2.719225
LOC652493 6.444931 FLG −6.58204 TBC1D3L 4.466769 lnc-CCDC117-1 −2.657902
CRKRS 6.290947 LCE3D −6.56352 COL27A1 4.239985 CXCL9 −2.606975
RGS1 6.109839 LY6G6C −6.46794 KRT73 4.160282 SLURP1 −2.579585
RNF126P1 6.106207 LCE3E −6.43703 lnc-BTRC-2 4.070695 IFI44L −2.561653
LOC642113 5.927212 SLURP1 −5.69952 TNRC18 4.007028 KRTDAP −2.532567
CD27 5.752022 PLA2G4D −5.57919 BCL2L15 3.985797 WISP2 −2.484823
FER1L4 5.735650 CALML5 −5.57193 CD79A 3.956875 SH3GL3 −2.409029
POU2AF1 5.724181 LOC730833 −5.49426 lnc-NBPF3-4 3.929255 ARL9 −2.383946
CD19 5.617619 LOC653499 −5.34391 lnc-MFAP4-1 3.852914 DSC2 −2.372728
LAX1 5.516125 AADACL2 −5.24062 lnc-CS-1 3.793785 PSMD10 −2.361956
SEL1L3 5.469453 KRT10 −5.19668 lnc-FAM131B-1 3.760248 lnc-PLTP-1 −2.354330
FCRLA 5.355335 LOC441052 −4.89137 lnc-COX19-2 3.644528 PCNXL4 −2.339869
ASB16 5.056340 LOC645869 −4.88024 LOC101927577 3.608607 JAKMIP3 −2.271844
ST6GAL1 4.999486 DSG1 −4.69387 C4B 3.525520 LINC01197 −2.251761
LOC649210 4.985094 LGALS7B −4.68949 IGLL1 3.517933 CYP2C9 −2.204945
Gray shading indicates genes that overlapped between the top 30 lists for cohorts 1 and 2.
FC: fold change.
Illumina Agilent
Integrated analysis
1,619 264
3
898
d 2c 10a 19b
Figure 4. Comparison of cohorts 1 and 2 using an integrative meta-analysis. (a) Overlapping genes in the 3 analysis methods: Illumina, Agilent, and integrative meta-analysis (Table 4). (b) The remaining DEGs in individual Illumina analyses and the integrative meta-analysis. (c) The remaining DEGs in individual Agilent analyses and the integrative meta-analysis. (d) Genes that were differentially expressed in the integrative meta-analysis, but not in individual analyses.
DEG: differentially expressed gene.
pathways (Table 4), which represent the functional change pattern in a diseased state, the results were irrelevant, with no overlapping pathways.
DISCUSSION
The aims of this study were to compare the characteristic transcriptomic patterns for periodontitis and to identify consistent DEGs in 2 cohorts using different microarray platforms. This study applied a comparative analysis and integrative meta-analysis to Table 3. Overlapping genes in the 3 analysis methods: Illumina, Agilent, and integrative meta-analysis
Gene Gene description Fold change Adjusted P value
CXCL14 C-X-C motif chemokine ligand 14 1.50272 6.61E–10
NEFM Neurofilament medium 1.53014 3.30E–10
TPTE2 Transmembrane phosphoinositide 3-phosphatase and tensin homolog 2 −1.61476 1.15E–10
MME Membrane metalloendopeptidase −1.48587 6.25E–10
PDE9A Phosphodiesterase 9A −1.52411 4.98E–10
CD27 CD27 molecule −1.52025 6.57E–10
ASB16 Ankyrin repeat and SOCS box containing 16 −1.57525 2.78E–10
CFI Complement factor I −1.50476 8.60E–10
CD79A CD79a molecule −1.73224 6.34E–12
BEX5 Brain expressed x-linked 5 −1.52092 6.86E–10
Table 4. Top 30 enriched pathways in cohorts 1 and 2
Cohort 1 Cohort 2
GO ID Term P value GO ID Term P value
GO:0007398 Ectoderm development 1.71E–19 GO:0044699 Single-organism process 1.29E–96
GO:0008544 Epidermis development 9.03E–19 GO:0009987 Cellular process 1.53E–95
GO:0009913 Epidermal cell differentiation 4.27E–15 GO:0005623 Cell 7.34E–93
GO:0030216 Keratinocyte differentiation 1.00E–14 GO:0044464 Cell part 2.87E–92
GO:0006955 Immune response 1.46E–12 GO:0044763 Single-organism cellular process 4.67E–86
GO:0031424 Keratinization 5.23E–12 GO:0005488 Binding 3.16E–74
GO:0030855 Epithelial cell differentiation 2.02E–10 GO:0005622 Intracellular 1.89E–70
GO:0005576 Extracellular region 4.23E–09 GO:0043226 Organelle 1.27E–66
GO:0030057 Desmosome 3.66E–08 GO:0044424 Intracellular part 1.95E–66
GO:0005615 Extracellular space 3.12E–07 GO:0065007 Biological regulation 3.55E–66
GO:0060429 Epithelium development 4.02E–07 GO:0050789 Regulation of biological process 7.62E–65
GO:0043296 Apical junction complex 7.37E–07 GO:0050896 Response to stimulus 4.74E–64
GO:0009611 Response to wounding 7.66E–07 GO:0043227 Membrane-bounded organelle 2.95E–61
GO:0016327 Apicolateral plasma membrane 1.07E–06 GO:0005737 Cytoplasm 2.05E–60
GO:0006952 Defense response 1.47E–06 GO:0008152 Metabolic process 7.32E–57
GO:0001533 Cornified envelope 1.66E–06 GO:0016020 Membrane 8.92E–56
GO:0044421 Extracellular region part 2.02E–06 GO:0050794 Regulation of cellular process 2.29E–55
GO:0007155 Cell adhesion 3.11E–05 GO:0005515 Protein binding 9.76E–54
GO:0022610 Biological adhesion 3.11E–05 GO:0051716 Cellular response to stimulus 4.69E–52
GO:0002684 Positive regulation of immune system process 4.03E–05 GO:0044425 Membrane part 6.58E–50
GO:0006954 Inflammatory response 4.34E–05 GO:0044444 Cytoplasmic part 1.4E–49
GO:0001775 Cell activation 5.79E–05 GO:0007154 Cell communication 8.47E–49
GO:0003823 Antigen binding 9.09E–05 GO:0043229 Intracellular organelle 7.12E–46
GO:0016477 Cell migration 9.90E–05 GO:0044700 Single organism signaling 4.15E–45
GO:0012505 Endomembrane system 2.13E–04 GO:0023052 Signaling 4.75E–45
GO:0016337 Cell–cell adhesion 2.84E–04 GO:0071704 Organic-substance metabolic process 1.34E–43
GO:0005911 Cell–cell junction 3.43E–04 GO:0031224 Intrinsic component of membrane 3.02E–43
GO:0048584 Positive regulation of response to stimulus 3.49E–04 GO:0007165 Signal transduction 8.41E–43
GO:0044432 Endoplasmic reticulum part 3.82E–04 GO:0016021 Integral component of membrane 1.2E–41
GO:0048870 Cell motility 4.07E–04 GO:0044237 Cellular metabolic process 3.78E–40
None of the top 30 enriched pathways overlapped between cohorts 1 and 2.
GO: gene ontology.
data sets obtained using different microarray platforms to analyze 2 periodontitis cohorts recruited using the same criteria. The characteristic gene expression pattern of gingival tissue differed between the periodontitis patients and healthy controls, in terms of the clustering hierarchy of the heatmap from both cohorts and the integrated data sets. There were 59 common DEGs in the 2 cohorts and 10 common DEGs in both the 2 cohorts and the integrated data sets. However, the inconsistency between the data sets at both the DEG and biological pathway levels hindered the identification of specific biomarkers for periodontitis.
Poor consistency was shown in this study, by the results for the 2 data sets and by the meta- analysis results, which made it difficult to suggest biomarker genes that were significantly and consistently associated with the pathogenesis of periodontitis, as shown by overlapping DEGs. The present data sets were compared with DEG lists from previous studies to evaluate the poor consistency in gene expression patterns. The DEG list obtained by Demmer et al.
[21] overlaps by only 12% with cohort 1 and by 10% with cohort 2, while that of Becker et al. [22] overlaps by 26% with cohort 1 and only by 1 gene with cohort 2. Of the 81 potential biomarkers presented in an experimental gingivitis study [5], only 14 and 2 genes overlap with cohorts 1 and 2, respectively. Data sets from 5 previous periodontitis studies [5,6,21-23]
were also compared, and poor consistency was also observed. No genes commonly detected in all 5 studies, only 9 genes were common to 4 of the data sets, and 46 genes were common to 3 of the data sets. Of 13 biomarkers for periodontitis identified using spatial transcriptome techniques [11], 5 genes were detected in cohort 1, 6 genes were detected in cohort 2, and 1 gene was detected in the integrated data sets. Comparing the findings of the 5 previous studies with these biomarkers reveals that fewer than 3 common genes were detected in each study. Previous studies also have shown minimal overlap of DEGs in microarray analyses, as well as in the 3 data sets of the present study. It was difficult to find a reasonable consensus related to the microarray data for periodontitis, including the data sets in the present and previous studies.
The diversity of these results could be partly due to a lack of clarity about the current
diagnostic criteria of periodontitis and the complexity of the underlying pathogenesis. A new classification of periodontitis was released in 2017 [24] following the American Academy of Periodontology classification in 1999. Both classification systems are based on only clinical features and risk factors, rather than the pathological background. In contemporary periodontology, viewpoints on the etiology of periodontitis have evolved from the keystone pathogen hypothesis to the concept that it is more important to consider the environment, host genetics, and host response [25]. Due to the complexity of periodontitis, there are conflicting findings on the pathology and clinical presentation of the disease, such as its severity [26,27]. Therefore, these current systems can include patients with various pathological backgrounds and phases in the same disease category. Since microarray analysis can detect gene expression in lesions, the lack of consistency in the gene expression data for these cohorts could be due to the heterogeneity of host responses in periodontitis lesions that are classified into the same category using the current diagnosis systems.
This study confirmed the presence of specific gene expression patterns in the gingival tissue of periodontitis patients, as has also been reported previously. However, a limitation is that the number of samples in the 2 cohorts is too small to statistically confirm the consistency (or lack thereof ) of the findings. In addition, there are limitations due to the current diagnosis system of periodontitis and differences between the microarray platform.
Microarray data should be conservatively interpreted when attempting to identify specific
biomarkers for diagnosing or identifying the etiology of periodontitis, due to the poor reliability and consistency found in the expression patterns from various datasets.
SUPPLEMENTARY MATERIAL
Supplementary Table 1
The overlapping differentially expressed genes between cohorts 1 and 2 Click here to view
REFERENCES
1. Gresham D, Dunham MJ, Botstein D. Comparing whole genomes using DNA microarrays. Nat Rev Genet 2008;9:291-302.
PUBMED | CROSSREF
2. Meyle J, Chapple I. Molecular aspects of the pathogenesis of periodontitis. Periodontol 2000 2015;69:7-17.
PUBMED | CROSSREF
3. Jönsson D, Ramberg P, Demmer RT, Kebschull M, Dahlén G, Papapanou PN. Gingival tissue transcriptomes in experimental gingivitis. J Clin Periodontol 2011;38:599-611.
PUBMED | CROSSREF
4. Taiete T, Casarin RCV, Ruiz KGS, Nociti FH Jr, Sallum EA, Casati MZ. Transcriptome of healthy gingival tissue from edentulous sites in patients with a history of generalized aggressive periodontitis. J Periodontol 2018;89:93-104.
PUBMED | CROSSREF
5. Offenbacher S, Barros SP, Paquette DW, Winston JL, Biesbrock AR, Thomason RG, et al. Gingival transcriptome patterns during induction and resolution of experimental gingivitis in humans. J Periodontol 2009;80:1963-82.
PUBMED | CROSSREF
6. Davanian H, Stranneheim H, Båge T, Lagervall M, Jansson L, Lundeberg J, et al. Gene expression profiles in paired gingival biopsies from periodontitis-affected and healthy tissues revealed by massively parallel sequencing. PLoS One 2012;7:e46440.
PUBMED | CROSSREF
7. Guzeldemir-Akcakanat E, Sunnetci-Akkoyunlu D, Orucguney B, Cine N, Kan B, Yılmaz EB, et al. Gene- expression profiles in generalized aggressive periodontitis: a gene network-based microarray analysis. J Periodontol 2016;87:58-65.
PUBMED | CROSSREF
8. Kim YG, Kim M, Kang JH, Kim HJ, Park JW, Lee JM, et al. Transcriptome sequencing of gingival biopsies from chronic periodontitis patients reveals novel gene expression and splicing patterns. Hum Genomics 2016;10:28.
PUBMED | CROSSREF
9. Sawle AD, Kebschull M, Demmer RT, Papapanou PN. Identification of master regulator genes in human periodontitis. J Dent Res 2016;95:1010-7.
PUBMED | CROSSREF
10. Kebschull M, Demmer RT, Grün B, Guarnieri P, Pavlidis P, Papapanou PN. Gingival tissue transcriptomes identify distinct periodontitis phenotypes. J Dent Res 2014;93:459-68.
PUBMED | CROSSREF
11. Lundmark A, Gerasimcik N, Båge T, Jemt A, Mollbrink A, Salmén F, et al. Gene expression profiling of periodontitis-affected gingival tissue by spatial transcriptomics. Sci Rep 2018;8:9370.
PUBMED | CROSSREF
12. Kuo WP, Jenssen TK, Butte AJ, Ohno-Machado L, Kohane IS. Analysis of matched mRNA measurements from two different microarray technologies. Bioinformatics 2002;18:405-12.
PUBMED | CROSSREF
13. Russ J, Futschik ME. Comparison and consolidation of microarray data sets of human tissue expression.
BMC Genomics 2010;11:305.
PUBMED | CROSSREF
14. Turnbull AK, Kitchen RR, Larionov AA, Renshaw L, Dixon JM, Sims AH. Direct integration of intensity- level data from Affymetrix and Illumina microarrays improves statistical power for robust reanalysis. BMC Med Genomics 2012;5:35.
PUBMED | CROSSREF
15. Pavlou MP, Dimitromanolakis A, Martinez-Morillo E, Smid M, Foekens JA, Diamandis EP. Integrating meta-analysis of microarray data and targeted proteomics for biomarker identification: application in breast cancer. J Proteome Res 2014;13:2897-909.
PUBMED | CROSSREF
16. Irigoyen A, Jimenez-Luna C, Benavides M, Caba O, Gallego J, Ortuño FM, et al. Integrative multi-platform meta-analysis of gene expression profiles in pancreatic ductal adenocarcinoma patients for identifying novel diagnostic biomarkers. PLoS One 2018;13:e0194844.
PUBMED | CROSSREF
17. Waldron L, Haibe-Kains B, Culhane AC, Riester M, Ding J, Wang XV, et al. Comparative meta-analysis of prognostic gene signatures for late-stage ovarian cancer. J Natl Cancer Inst 2014;106:dju049.
PUBMED | CROSSREF
18. Du P, Kibbe WA, Lin SM. lumi: a pipeline for processing Illumina microarray. Bioinformatics 2008;24:1547-8.
PUBMED | CROSSREF
19. Benito M, Parker J, Du Q, Wu J, Xiang D, Perou CM, et al. Adjustment of systematic microarray data biases. Bioinformatics 2004;20:105-14.
PUBMED | CROSSREF
20. Lazar C, Meganck S, Taminau J, Steenhoff D, Coletta A, Molter C, et al. Batch effect removal methods for microarray gene expression data integration: a survey. Brief Bioinform 2013;14:469-90.
PUBMED | CROSSREF
21. Demmer RT, Behle JH, Wolf DL, Handfield M, Kebschull M, Celenti R, et al. Transcriptomes in healthy and diseased gingival tissues. J Periodontol 2008;79:2112-24.
PUBMED | CROSSREF
22. Becker ST, Beck-Broichsitter BE, Graetz C, Dörfer CE, Wiltfang J, Häsler R. Peri-implantitis versus periodontitis: functional differences indicated by transcriptome profiling. Clin Implant Dent Relat Res 2014;16:401-11.
PUBMED | CROSSREF
23. Suzuki A, Horie T, Numabe Y. Investigation of molecular biomarker candidates for diagnosis and prognosis of chronic periodontitis by bioinformatics analysis of pooled microarray gene expression datasets in gene expression omnibus (GEO). BMC Oral Health 2019;19:52.
PUBMED | CROSSREF
24. Papapanou PN, Sanz M, Buduneli N, Dietrich T, Feres M, Fine DH, et al. Periodontitis: consensus report of workgroup 2 of the 2017 World Workshop on the classification of periodontal and peri-implant diseases and conditions. J Periodontol 2018;89 Suppl 1:S173-82.
PUBMED | CROSSREF
25. Bartold PM, Van Dyke TE. An appraisal of the role of specific bacteria in the initial pathogenesis of periodontitis. J Clin Periodontol 2019;46:6-11.
PUBMED | CROSSREF
26. Kebschull M, Guarnieri P, Demmer RT, Boulesteix AL, Pavlidis P, Papapanou PN. Molecular differences between chronic and aggressive periodontitis. J Dent Res 2013;92:1081-8.
PUBMED | CROSSREF
27. Fine DH, Patil AG, Loos BG. Classification and diagnosis of aggressive periodontitis. J Clin Periodontol 2018;45 Suppl 20:S95-111.
PUBMED | CROSSREF