생존분석시 주의깊게 고려하여야 할 점은 무엇인가?
곽상규
1
ㆍ최은진2
대구가톨릭대학교 의과대학
1의학통계학교실,
2소아과학교실
What Should We Consider Carefully When Performing Survival Analysis?
Sang Gyu Kwak
1and Eun Jin Choi
2Departments of
1Medical Statistics and
2Pediatrics, School of Medicine, Catholic University of Daegu, Daegu, Korea
The survival data and the survival analysis are the data and analysis methods used to study the probability of survival. The survival data consist of a period from the juncture of a start event to the juncture of the end event (occurrence event). The period is called the survival period or survival time. In this way, the method of analysing the survival time of subjects and appropriately summarizing the degree of survival is called survival analysis. To understand and analyse survival analysis methods, researchers must be aware of some concepts. Concepts to be aware of in the survival analysis include events, censored data, survival period, survival function, survival curve and so on. This review focuses on the terms and concepts used in the survival analysis. It will also cover the types of survival data that should be collected and prepared when using actual survival analysis method and how to prepare them.
pISSN 2233-5250 / eISSN 2233-4580 https://doi.org/10.15264/cpho.2019.26.1.1 Clin Pediatr Hematol Oncol 2019;26:1∼5
Received on March 9, 2019 Revised on March 26, 2019 Accepted on April 3, 2019
Corresponding Author: Eun Jin Choi Department of Pediatrics, School of Medicine, Catholic University of Daegu, 33 Duryugongwon-ro 17-gil, Nam-gu, Daegu 42472, Korea Tel: +82-53-650-4248
Fax: +82-53-621-4106 E-mail: ejchoi2@cu.ac.kr
ORCID ID: orcid.org/0000-0001-7116-8538
Key Words: Censored data, Hazard ratio, Kaplan-Meier method, Survival analysis
Introduction
When patients are diagnosed with cancer or incurable disease for the first time in a hospital, they feel the fear of death very much. They may have a lot of questions about their illness, but among them, the question of wheth- er they can live for years or even months is the most representative. In response to this question, the medical team cannot assert that the patient can live for exactly years or months, but based on the patient’s health status or test results, the probability of surviving for three or five years
can be answered as a percentage. The rationale for this an- swer is based on the results of studies and papers pub- lished so far. The survival data and the survival analysis are the data and analysis methods used to study the proba- bility of survival.
The survival data consist of a period from the juncture
of a start event to the juncture of the end event (occurrence
event). The period is called the survival period or survival
time. For example, if surgery is the start event and death
is the end event, the period from surgery to death is the
survival time. It is judged according to the survival period,
that is, whether it is short or long, and the curative effect
on the operation is judged. In this way, the method of ana- lysing the survival time of subjects and appropriately sum- marizing the degree of survival is called survival analysis.
There are several original articles used survival analysis method. For example, Park et al. [1] used the survival anal- ysis method to compare disease free survival rate and over- all survival rate according to the NK cell percentages in newly diagnosed acute myeloid leukemia. Kang et al. [2]
used the survival analysis method to compare overall sur- vival rate and relapse-free survival rate according to 4 groups (high-risk, high-intermediate, low and low-inter- mediate) for classic IPI (International Prognostic Index), NCCN-IPI (National Comprehensive Cancer Network-Inter- national Prognostic Index) and modified IPI. Jung et al. [3]
used the survival analysis method to compare progres- sion-free survival rate and overall survival rate between STAT3-positive and STAT3-negative in non-elderly adult pa- tients with newly diagnosed multiple myeloma. The three examples are the ones that calculate the overall survival rate and the event free survival rate and compare them by group. However, the survival analysis is not a method of statistical analysis that is limited to events related to living and dying. Because of the word “survival,” there has been a misconception that it will only be used for data on the death of a patient or the success or failure of treatment of a particular disease, and so the survival analysis is not widely used. If only data on a specific event and a period from a specific juncture to an event occurrence date are collected, the survival rate can be analysed for each sit- uation using a survival analysis method.
To understand and analyse survival analysis methods, re- searchers must be aware of some concepts. Concepts to be aware of in the survival analysis include events, censored data, survival period, survival function, survival curve and so on.
This review focuses on the terms and concepts used in the survival analysis. It will be also covered the types of survival data that should be collected and prepared when using actual survival analysis method and how to prepare them.
Events
Events can be defined according to the topics and cir- cumstances of each study, such as surgery, treatment, death, survival, relapse, and re-operation. However, events must be defined from binary data. The binary data are data that can be represented only in two categories or states.
In other words, if death is defined as an event, it is defined by a binary data consisted death or survival. Data with more than three categories cannot be defined as an event, but can be defined as an event by modifying the data into two categories. For example, hazard classification data with three categories of high hazard, low hazard, and normal should be reconstructed into hazard data, which is high hazard and low hazard, together with hazard data. It is then possible to define hazard as an event from the hazard data. Researchers should also make clear the definition of the event. If death is defined as an event, the cause of death should be specifically mentioned. It should be clear whether the event includes all causes of death, such as ac- cidental death, death due to illness not related to research, death due to research-related diseases, or an event involv- ing only a specific cause of death. As described above, in the case of the event having the same type, although the cause is different, in this review, it is defined as “events of the same type with different causes”.
When creating the survival data, it should be recorded as the number 1 if the event occurred and the number 0 if the event did not occur. In most studies using survival analysis methods, death is defined as an event and death is recorded as 1, survival as 0 in the survival data, and the survival rate is presented as a result. Conversely, if survival is defined as an event, the survival should be recorded as 1 and death as 0, and the results presented using the sur- vival analysis method should present the mortality rate rath- er than the survival rate.
The main events covered in the survival analysis are
death and recurrence. Death and recurrence are clearly dif-
ferent concepts in clinical field. Therefore, when perform-
ing survival analysis for death and recurrence, definition of
event should be precise. If only the definition of the event
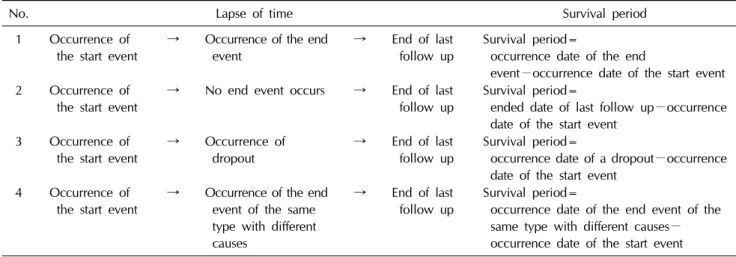
Table 1. Calculation for survival period
No. Lapse of time Survival period
1 Occurrence of the start event
→ Occurrence of the end event
→ End of last follow up
Survival period=
occurrence date of the end
event−occurrence date of the start event 2 Occurrence of
the start event
→ No end event occurs → End of last follow up
Survival period=
ended date of last follow up−occurrence date of the start event
3 Occurrence of the start event
→ Occurrence of dropout
→ End of last follow up
Survival period=
occurrence date of a dropout−occurrence date of the start event
4 Occurrence of the start event
→ Occurrence of the end event of the same type with different causes
→ End of last follow up
Survival period=
occurrence date of the end event of the same type with different causes−
occurrence date of the start event