• 검색 결과가 없습니다.

Determining the Required Vitamin D Level for Bone Health Based on Bone Turnover Markers

N/A
N/A
Protected

Academic year: 2021

Share "Determining the Required Vitamin D Level for Bone Health Based on Bone Turnover Markers"

Copied!
8
0
0

로드 중.... (전체 텍스트 보기)

전체 글

(1)

pISSN 1738-3544 eISSN 2288-1662

Determining the Required Vitamin D Level for Bone Health Based on Bone Turnover Markers

Tuan Salwani Tuan Ismail 1 , Bayani Che Muda 1 , Roznie Aida Mohd Rosdi 1 , Azalina Zainuddin 1 , Salbiah Isa 2 , Zulkarnain Mustapaha 1

1

Department of Chemical Pathology, School of Medical Sciences, Universiti Sains Malaysia, Kelantan, Malaysia

2

Advanced Medical and Dental Institute, Universiti Sains Malaysia, Kelantan, Malaysia

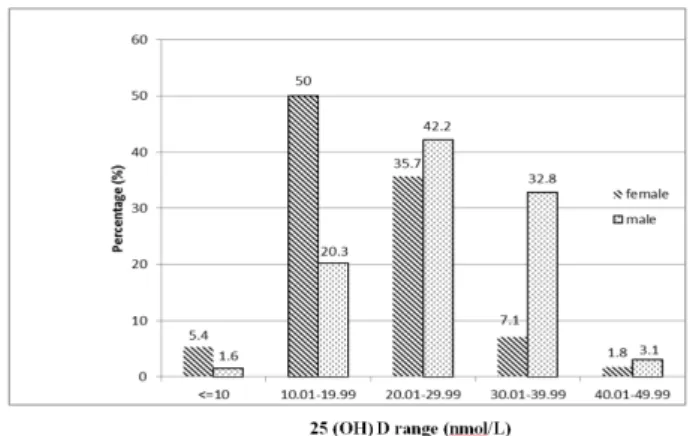
To date, no clear threshold that has been established for defining an adequate store of vitamin D for bone health. Therefore, this study aims to determine the required level of vitamin D to maintain a healthy skeleton based on bone remodelling process among healthy adult population. This was a cross sectional study, involving a healthy adult population in Kota Bharu, Malaysia, aged 18∼50 years. We measured serum 25(OH)D (vitamin D), serum parathyroid hormone (PTH), serum C-terminal telopeptide of type 1 collagen (CTX), and Procollagen 1 Intact N-Terminal (P1NP) in 120 healthy adults selected via multi stage sampling (64 males, 56 females) from 6 subdistricts in Kota Bharu. The mean level of 25(OH)D was 23.50 (±8.74) nmol/L. There was a significant difference of the vitamin D level between genders (26.81±8.3 nmol/L vs 19.72±7.68 nmol/L in males and females respectively) ( p value<0.001). More than 50% of female subjects had 25(OH)D less than 20 nmol/L, while only 20.3% of male subjects had 25(OH)D below 20 nmol/L. Based on the LOESS plot, the bone turnover markers showed a plateauing result, at the 25(OH)D level of 35 nmol/L for CTX and 20 nmol/L for P1NP. Contrastingly, PTH showed a step rise in the 25(OH)D level of 20 nmol/L. Based on the LOESS plot for CTX, P1NP and PTH versus 25(OH)D, level of vitamin D between 20 to 35 nmol/L is recommended to maintain healthy skeleton.

Key words: Vitamin D, Bone turnover markers, N-terminal propeptide of type 1 collagen, C-telopeptide, Parathyroid hormones

Corresponding author: Tuan Salwani Tuan Ismail Department of Chemical Pathology, School of Medical Sciences, Universiti Sains Malaysia, Health Campus, 16150, Kubang Kerian, Kelantan, Malaysia

Tel: 609-767-6510 E-mail: [email protected]

This is an Open Access article distributed under the terms of the Creative Commons Attribution Non-Commercial License (http://creativecommons.org/licenses/by-nc/4.0) which permits unrestricted non-commercial use, distribution, and reproduction in any medium, provided the original work is properly cited.

Copyright © 2017 The Korean Society for Clinical Laboratory Science. All rights reserved.

Received: October 10, 2017 Revised: November 30, 2017 Accepted: December 1, 2017

INTRODUCTION

Vitamin D plays a pivotal role in the development and maintenance of a healthy skeleton. It plays a critical function in the calcium and phosphorus metabolism and helps ensure adequate levels of these minerals for bone mineralization [1]. In adults, low vitamin D can results in osteomalacia which is a defective mineralization of the collagen matrix causing a reduction of structural support and being associated with an increased risk of fracture [2].

A low prevalence of vitamin D deficiency is expected in tropical countries with abundant of sun exposure. This is because the most important source of vitamin D is by

cutaneous synthesis under the action of sunlight. The sunlight convert 7-dehydrocholesterol in the skin to vitamin D3, which will be transported to the liver and hydroxylated to 25-hydroxyvitamin D [(25-OH)D]. Vitamin D3 will then be conveyed to the kidney and hydroxylated to 1,25-dihydroxyvitamin D[1,25(OH)

2

D]. The primary circulating form of vitamin D is 25(OH)D and it has longer half life (2∼3 weeks) compared to 4∼6 hours for 1,25(OH)

2

D, thus accepted as the determinant of vitamin D status [3].

Having said that, the prevalence of vitamin D deficiency in countries like Hawaii, Iran, India, and Saudi Arabia which received sunlight throughout the year are high [4-7].

Vitamin D deficiency is now recognized as a global pan-

(2)

demic. A systematic review of vitamin D status in populations worldwide done in 2013 showed that 37.3%

of the sample had vitamin D level below 50 nmol/L and 6.7

% had values below 25 nmol/L [8]. In Malaysia, a study done among adults in Kuala Lumpur revealed that appro- ximately 41% of male and 87% of females had insufficient (<50 nmol/L) level of vitamin D [9]. Another study conducted among primary school children in Kuala Lumpur revealed that 35.3% having vitamin D deficiency (<37.5 nmol/L) and 37.1 % having vitamin D insufficiency (37.5∼50.0 nmol/L) [10]. Despite mounting evidence of vitamin D status globally, there are still lack of studies in our local setting determining the level of vitamin D, especially among general population. Precisely defining vitamin D deficiency based on measurement of 25(OH)D concen- tration is still a matter of much debate. There is no optimum level or threshold that has been clearly esta- blished to define whether there is adequate store of vitamin D in the body [11]. Various vitamin D cut-off has been proposed as the indication of bone health in general population. Previous study showed a plateau in sup- pression of parathyroid hormone (PTH) when the 25(OH)D level reaches approximately 30 nmol/L which defines the optimum level [12]. Other study concluded that bone health in older persons are likely to improve when serum 25(OH)D is raised over at least 50∼60 nmol/L [13]. There are also other studies in which the researcher considers a 25(OH)D value of equal or more than 75 nmol as an adequate or optimum level [14]. Our study aims to deter- mine the optimum level of vitamin D required for main- tenance of healthy skeleton based on bone remodelling process. Remodelling of bone involves two counteracting processes, which are bone formation and bone resorption.

This balance of two processes is regulated by various substances like vitamin D, parathyroid hormone and various cytokines [15]. An imbalance of these processes leads to higher release of bone turnover markers, which are proteins originating from osteoclast and osteoblast activity or fragments released during the formation or degradation of type I collagen. In vitamin D deficiency, secondary hyperparathyroidism develops due to hypo-

calcaemia. This hyperparathyroidism causes a negative balance in the bone metabolism by stimulating bone resorption, thus releasing higher levels of bone turnover markers. These markers of bone metabolism are helpful tools to detect the dynamics of the metabolic imbalance itself [16]. Markers like osteocalcin, Procollagen 1 Intact N-Terminal (P1NP) and bone specific alkaline phosphatase are markers for bone formation while markers for bone resorption includes hydroxyproline, hydroxylysine- gly- coside and C-Terminal Telopeptide of Type 1 Collagen (CTX). Many studies have shown that low serum 25(OH)D level are associated with an increased in bone turnover markers. A study done by Kuchuk et al (2009) showed that parameters of bone turnover like osteocalcin and CTX were significantly lower in the higher vitamin D group [13]. A study in German children also showed that increase in 25(OH)D was associated with a significant decrease in the bone resorption marker, CTX [17]. Across the general population, various cut-off of 25(OH)D has been proposed for bone health. Therefore our aim is to determine the desired range of vitamin D for maintenance of healthy bone in general healthy population based on bone turn over markers. It will provide a comparison with the optimum level of vitamin D established based on (bone mineral density) BMD scanning in other studies.

SUBJECTS AND METHODS

1. Study design

This cross sectional study was conducted within 2

months duration, from July until August 2015. Within this

period of time, the seasonal variations are minimal,

whereby the rate of sunlight received are maximum. The

reference population was Malay adult in Kota Bharu, aged

18∼50 years. Sample size calculation done using single

mean formula. One hundred and twenty subjects from

Kota Bharu were randomly selected using multistage

sampling. In the first stage, 6 out of 14 subdistricts in Kota

Bharu were selected. Secondly, a village from each of the

6 subdistricts was randomly selected, and later, all

residents in the selected villages, who aged between 18∼

(3)

Table 1. Mean of vitamin D among study subjects (N=120) Confidence

interval p -value Female N=56

Male N=64

4.18-9.99 <0.001 19.72±7.68 26.81±6.81 25(OH)D, (nmol/L)

*Statistical significance was tested by t-test. Figure 1. Distribution (%) of gender based on the range of 25(OH)D.

50 years old, and fulfil the inclusion and exclusion criteria were randomly chosen and offered to participate in the study. We randomly chose the subjects by the name list provided by the village’s authorities. Subjects with chronic diseases e.g, chronic kidney disease, liver failure, diabetes mellitus, thyroid disorders and established osteoporosis were excluded. Subjects who were on any form of drug treatment with possible effect on bone metabolism (e.g., oral contraceptive, hormone replacement therapy, gluco- corticoids, and vitamin D supplements) were also excluded from the study. Apart from that, subjects who took alcohol, had a history of recent fracture within past 1 year and women who were pregnant, lactating or menopause were also excluded.

The study was approved by HREC (Human Ethics Research Committee USM) No. 15030091 and informed written consent was obtained from all subjects parti- cipated in the present study.

2. Specimen collection

Venous blood samples were collected in the morning between 8 to 10 am after an overnight fasting period.

Serum was stored at −20°C after centrifugation at 2,500

×g for 10 min. The samples were stored until analysis for the determinations of serum 25(OH)D, CTX and P1NP. All assays were carried out according to the manufacturer’s instruction.

3. Laboratory measurements

All analytes were measured using Elecsys Cobas e 411 by Roche Diagnostics. Serum 25(OH)D were measured by competitive protein binding assay with CVs for repeatability were between 1.7% to7.8% and the CVs for intermediate precision were between 2.2% to 10.7%. This method is standardized against liquid chromatography-tandem mass

spectrometry (LC-MS/MS) which in turn is traceable to National Institute of Standards and Technology (NIST).

The CTX and total P1NP both were measured by sandwich assay. The CVs for repeatability were between 2.1% to 3.5% and CVs for intermediate precision were 2.8% to 8.4%

for CTX. The total P1NP’s CVs were 1.2% to 3.0% and 1.7%

to 4.1% for repeatability and intermediate precision respectively. For the PTH, the assay used was second generation assay with sandwich principle. The CVs for repeatability were 1.5% to 2.7% and the intermediate precisions were between 3.0% to 6.5%.

4. Statistical analysis

Data were analysed using SPSS Statistical Package. All numerical data are presented by mean and SD. Baseline data for total sample and each of gender group were calculated. The differences between the gender groups were tested by independent t-test. The locally weighted scatterplot smoothing (LOESS) plot was performed to investigate the relationships between vitamin D and the bone turnover markers and subsequently used to determine the optimum level of vitamin D.

RESULTS

One hundred and twenty study subjects were recruited which consist of 95.8% Malay, 2.5% Chinese and 1.7%

Indian. The vitamin D measured among study subjects

ranged between 8.59 nmol/L to 47.56 nmol/L. The mean

(4)

Table 2. Proportion of vitamin D status at various 25-(OH)D cut-off N (%) (Total No.=120) 25(OH)D cut-off (nmol/L)

68 (56.7) <25 (vitamin D deficiency) 52 (43.3) 25∼50 (Insufficiency)

0 (0) >50 (Hypovitaminosis)

Table 3. Mean levels of bone turnover markers between male and female

Confidence interval p -

value Female N=56 Male N=64

0.05∼0.18 <0.001 0.32 (0.16) 0.43 (0.19) CTX, ng/mL

2.74∼25.37 0.015 60.25 (24.85) 74.30 (35.8) P1NP, ng/L

−1.07∼−0.38 <0.001 2.24 (0.99) 1.51 (0.88) PTH, pmol/L

*Statistical significance was tested by t-test.

A B

C

Figure 2. (A) LOESS plot for the relationship of 25(OH)D with

total P1NP. (B) LOESS plot for the relationship of 25(OH)D with CTX. (C) LOESS plot for the relationship of 25(OH)D with PTH.

level of 25(OH)D in this study was 23.50 (±8.74) nmol/L.

There was significant difference the level of 25(OH)D between male and female as is summarized in Table 1.

More than 50% of female subjects had vitamin D less than 20 nmol/L, while only 20.3% of male subjects had vitamin D below 20 nmol/L. Majority of female subjects have vitamin D level in the range of 11∼20 nmol/L, whereas male subjects had higher range of vitamin D which was between 20∼30 nmol/L. Out of 120, 4 subjects had vitamin D level below 10 nmol/L. Figure 1 showed the distribution of 25(OH)D among different gender (male and female). The proportion of vitamin D status at various cut-off classifies according to circulating 25-hydroxyvitamin

D concentrations is summarized in Table 2.

The level of bone turn over markers between male and female were measured and summarized in Table 3. The level of bone markers between male and female were significant different statistically.

The relationships between vitamin D level and bone

markers are presented in Figure 2A, 2B and 2C. LOESS plots

show the values of serum CTX, P1NP and PTH for each

value of serum vitamin D. The level of P1NP is seen to be

plateau when the vitamin D levels reach more than 20

(5)

nmol/L (Figure 2A). For serum CTX, the plot shows no significant increment in the level when the vitamin D level is more than 35 nmol/L (Figure 2B). Result for PTH shows that when the vitamin D levels reach 20 nmol/L, there is a steep decrease in the PTH level (Figure 2C).

DISCUSSION

Vitamin D is known for decades to be important in maintaining a healthy bone in human of all ages starting from prenatal, infancy, childhood, and adulthood until the elderly. In recent years, there has been renewed interest in vitamin D because of its many other extra skeletal benefits.

It has been suggested to play roles in the skin, cardio- vascular system, immune system, pathogenesis of diabetes mellitus type 1, autoimmune diseases and in cancer prevention and treatment [18-21]. Inadequate vitamin D leads to bone diseases like rickets, osteomalacia and osteoporosis. These bone diseases have a huge impact on the population as a whole and especially on affected individuals and their families. It causes pain and deformities and affects functional status and also self-esteem. As it leaves a major impact to the society, it is crucial to maintain an adequate level of vitamin D for bone health. In this study, we found that the mean vitamin D level in our population was 23.50 nmol/L. The range of vitamin D levels are between 8.59 to 47.56 nmol/L. Previous study reported that mean population level of 25(OH)D values are varied considerably across the worldwide ranging from 4ㆍ9 until 136ㆍ2 nmol/L [8]. In the South East Asia region like Indonesia, the mean vitamin D level is higher with 38.7 nmol/L and 67.6 nmol/L in Thailand [22,23]. Even though both the countries are tropical countries similar like Malaysia, the result exhibits a large difference. The reason could be due to different assays being used in measuring vitamin D. The study in Thailand used liquid chro- matography mass spectrometry, whereas in Indonesia, ELISA was used. Apart from that, exposure to sunlight, dietary intake of vitamin D and use of supplements may also become factors that contribute to the difference.

There are conflicting evidences in the vitamin D status

between male and female subjects in the study worldwide.

In our study, the mean vitamin D level for male is higher (26.81±8.30) nmol/L compared to female (19.72±7.68) nmol/L. The vitamin D values in women tended to be lower, especially in the Middle East regions. Previous study in Turkey and Lebanon showed lower vitamin D in the females [24,25]. The reasons are most likely due to less sun exposure, less outdoor activities, and decreased body area exposure than the male counterpart especially in the Muslim countries where women wear full clothing including hijab and veil. A meta-analysis on global vitamin D status in healthy subjects showed that female had higher 25OHD levels than male [26,27]. This finding could be explained by the possible usage of vitamin D supplements by the female compared to male. The definition of vitamin D deficiency remains controversial. Determination of 25(OH)D among postmenopausal Malay and Chinese women, aged 50∼65 years old by Rahman et al (2004) defined the hypovitaminosis D between range of 50∼100 nmol/L and vitamin D insufficiency between range of 25∼

50 nmol/L [28]. The liquid phase radioimmunoassay kit

(Gamma B, IDS Limited, USA) was used to extract and

quantify 25(OH) D in their study. In another study con-

ducted by Moy and Bulgiba (2011) among Malay adult,

mean age of 48.5 years in Kuala Lumpur, Malaysia were

using the cut-off of<50 nmol/L to define vitamin D

insufficiency [9]. The World Health Organization (WHO)

defined vitamin D insufficiency as serum 25OHD below 50

nmol/L (20 ng/mL) [28]. Serum 25(OH)D>50 nmol/L is

considered sufficient while serum 25OHD<30 nmol/L

used as cut-off to start treatment based on New Therapies

Subgroup (NTS) [29]. A target range of serum 25(OH)D

between 50∼90 nmol/L (20∼36 ng/mL) was found to

minimize the risk of acute coronary syndrome and all

cause mortality [30]. Nurbazlin et al (2013) defined vitamin

D deficient and insufficiency at lower cut-off as <30

nmol/L and 30∼50 nmol/L respectively in their study,

comparing vitamin D level among rural and urban po-

pulation. Electrochemiluminescence immunoassay (ECLIA)

method on Cobas E- 411 analyzer was used to analyzed

25(OH)D in that study [31].

(6)

Difference in the study population and difference in the method used to measure 25(OH)D contribute to the variation of the used cut-off to define optimum level of vitamin D. Given the absence of uniformly accepted definitions and cut-offs, previous reviews have reported substantial variations in the prevalence of vitamin D deficiency across countries throughout the world. The estimates ranging from 2 to 90% depending on the cut-off value and study population selected. For the proportion of vitamin D deficiency, 76.7% of our subjects had 25(OH)D level less than 30 nmol/L and if the cut-off of vitamin D deficiency is taken at less than 50 nmol/L, it means that 100% of our subjects were vitamin D deficient. The required serum 25(OH)D has usually been established by assessing the threshold of serum 25(OH)D by which serum PTH maximally can be suppressed [32]. However, in- creases in serum PTH associated with vitamin D deficiency are usually within the normal reference range; serum PTH has a short half-life and depends on calcium intake, so different data sets could lead to different conclusions [11].

PTH also shows fluctuations related to diet, renal function and time of the day [33,34]. A threshold for optimal 25(OH)D by using bone mineral density (BMD) has been addressed recently. Numerous studies have shown sig- nificant positive correlation between vitamin D level and BMD [35,36]. In the NHANES III study, a threshold of about 80 nmol/L represented serum 25(OH)D level above which BMD increased more slowly [37]. BMD testing needs to be done in centre with special equipment using dual energy x-ray absorptiometry (DEXA) scan, performed by spe- cialized personnel and needs the experts to interpret the result. It is not widely available as the cost is very high.

Bone turnover markers on the other hand can be an alternative for estimating the threshold of vitamin D. In vitamin D deficiency, there will be higher bone turnover process due to secondary hyperparathyroidism, thus it will lead to increase in the bone turnover markers in the body.

Usage of bone turnover markers is more practical as it is widely available, cheaper compared to DEXA scan and can monitor the bone turnover changes after treatment within short period (few weeks) compared to BMD by DEXA scan

that needs about 2 years for the changes to be seen. In this study, we observed that serum bone turnover markers, CTX showed plateau response when the vitamin D level reached 35 nmol/L. For serum total P1NP and PTH, the threshold of vitamin D at which these parameters started to plateau is at 20 nmol/L. The result that we had is lower compared to the previous study. Serum osteocalcin, a marker of bone formation in relation to serum vitamin D, should be higher than 40 nmol/L before it becomes plateau [12]. The difference for this threshold could be explained due to seasonal bone changes and preanalytical factors for bone turnover markers like influence of diets and diurnal rhythm. The level of 16 ng/mL (39.9 nmol/L) had been showed in another study conducted in Pakistan among postmenopausal women to maintain the PTH level of 53 pg/dL [38]. In our study, around 50% of study subjects fall between 20∼35 nmol/L. In conclusion, healthy adult population in Kota Bharu have low level of vitamin D, with mean level of 23.5 nmol/L. Based on our study finding, the required level of 25(OH)D measured by electrochemi- luminescence immunoassay is between 20 nmol/L to 35nmol/L for maintenance of bone health in our local adult population. There was great discrepancy of the required level of vitamin D based on bone markers and National Health and Nutrition Examination Survey (NHANES) III study which based on BMD. Therefore, a more extensive study involved bigger population and determination of optimum vitamin D level in correlation with series of bone markers and BMD scanning are required to confirm the required vitamin D level. Future study should consider several confounders related to vitamin D measurement such as age, race, duration of daily sun exposure, daily calcium intake, skin colour, body mass index and occupation of the study subjects which are not been addressed in this study.

Acknowledgements: We thank the laboratory staff of Chemical Pathology lab USM for their valuable assistance.

Funding: This study was supported by short term grant, 304/ppsp/61313142, School of Medical Sciences, USM.

Conflict of interest: None

(7)

REFERENCES

1. Wacker M, Holick MF. Vitamin D—effects on skeletal and extra- skeletal health and the need for supplementation. Nutrients.

2013;5(1):111-148.

2. Holick MF, Chen TC. Vitamin D deficiency: a worldwide prob- lem with health consequences. The Am J Clin Nutr. 2008;87(4):

1080S-1086S.

3. De La Hunty A, Wallace AM, Gibson S, Viljakainen H, Lamberg- Allardt C, Ashwell M. UK Food Standards Agency Workshop Consensus Report: the choice of method for measuring 25-hydroxyvitamin D to estimate vitamin D status for the UK National Diet and Nutrition Survey. Br J Nutr. 2010;104(04):

612-619.

4. Holick MF. Evolution, biologic functions, and recommended dietary allowances for vitamin D. New York: Springer; 1999.

p1-16.

5. Binkley N, Novotny R, Krueger D, Kawahara T, Daida YG, Lensmeyer G, et al. Low vitamin D status despite abundant sun exposure. J Clin Endocrinol Metab. 2007;92(6):2130-2135.

6. Lips P. Vitamin D status and nutrition in Europe and Asia. J Steroid Biochem Mol Biol. 2007;103(3-5):620-625.

7. Elsammak M, Al-Wossaibi A, Al-Howeish A, Alsaeed J. High prevalence of vitamin D deficiency in the sunny Eastern region of Saudi Arabia: a hospital-based study. East Mediterr Health J.

2011;17(4):317-322

8. Hilger J, Friedel A, Herr R, Rausch T, Roos F, Wahl DA, et al. A systematic review of vitamin D status in populations worldwide.

Br J Nutr. 2014;111(1):23-45.

9. Moy FM, Bulgiba A. High prevalence of vitamin D insufficiency and its association with obesity and metabolic syndrome among Malay adults in Kuala Lumpur, Malaysia. BMC Public Health. 2011;11:735. doi: 10.1186/1471-2458-11-735.

10. Khor GL, Chee WS, Shariff ZM, Poh BK, Arumugam M, Rahman JA, et al. High prevalence of vitamin D insufficiency and its as- sociation with BMI-for-age among primary school children in Kuala Lumpur, Malaysia. BMC Public Health. 2011;11:95. doi:

10.1186/1471-2458-11-95.

11. Thacher TD, Clarke BL, editors. Vitamin D insufficiency. Mayo Clin Proc. 2011;86(1):50-60.

12. Lips P. Vitamin D deficiency and secondary hyperparathy- roidism in the elderly: consequences for bone loss and fractures and therapeutic implications. Endocr Rev. 2001;22(4):477-501.

13. Kuchuk NO, Pluijm SM, van Schoor NM, Looman CW, Smit JH, Lips P. Relationships of serum 25-hydroxyvitamin D to bone mineral density and serum parathyroid hormone and markers of bone turnover in older persons. The J. Clin. Endocrinol.

Metab. 2009;94(4):1244-1250.

14. Vieth R. Why the minimum desirable serum 25-hydroxyvitamin D level should be 75 nmol/L (30 ng/mL). Best Pract Res Clin Endocrinol Metab. 2011;25(4):681-691.

15. Seibel MJ. Biochemical markers of bone turnover part I: bio- chemistry and variability. Clin Biochem Rev. 2005;26(4):97- 122.

16. Seibel MJ, Robins SP, Bilezikian JP. Dynamics of bone and carti- lage metabolism, 2nd ed. Cambridge: Academic Press; 2006.

17. Thiering E, Brüske I, Kratzsch J, Hofbauer L, Berdel D, von Berg A, et al. Associations between serum 25-hydroxyvitamin D and bone turnover markers in a population based sample of German children. Sci Rep. 2015;5:18138. doi: 10.1038/srep18138.

18. Zittermann A, Gummert JF. Sun, vitamin D, and cardiovascular disease. J Photochem Photobiol B. 2010;101(2):124-129.

19. Hyppönen E, Läärä E, Reunanen A, Järvelin M-R, Virtanen SM.

Intake of vitamin D and risk of type 1 diabetes: A birth-cohort study. Lancet. 2001;358(9292):1500-1503.

20. Lappe JM, Travers-Gustafson D, Davies KM, Recker RR, Heaney RP. Vitamin D and calcium supplementation reduces cancer risk: results of a randomized trial. Am J Clin Nutr. 2007;85(6):

1586-1591.

21. Kamen DL, Tangpricha V. Vitamin D and molecular actions on the immune system: modulation of innate and autoimmunity.

Int J Mol Med. 2010;88(5):441-450.

22. Setiati S. Vitamin D status among Indonesian elderly women living in institutionalized care units. Acta Med Indones. 2008;

40(2):78-83.

23. Chailurkit L-o, Kruavit A, Rajatanavin R. Vitamin D status and bone health in healthy Thai elderly women. Nutrition.

2011;27(2):160-164.

24. Atli T, Gullu S, Uysal A, Erdogan G. The prevalence of vitamin D deficiency and effects of ultraviolet light on vitamin D levels in elderly Turkish population. Arch Gerontol Geriat. 2005;40(1):

53-60.

25. Arabi A, Baddoura R, El-Rassi R, Fuleihan GE-H. Age but not gender modulates the relationship between PTH and vitamin D.

Bone. 2010;47(2):408-412.

26. Richart T, Thijs L, Nawrot T, Yu J, Kuznetsova T, Balkestein EJ, et al. The metabolic syndrome andcarotid intima-media thick- ness in relation to the parathyroid hormone to 25-OH-D3 ratio in a general population. J Am Soc Hypertens. 2011;24(1):

102-109.

27. Rahman SA, Chee W, Yassin Z, Chan S. Vitamin D status among postmenopausal Malaysian women. Asia Pac J Clin Nutr. 2004;

13(3):255-260.

28. WHO Scientific Group on the Prevention and Management of Osteoporosis. Report of a WHO Scientific Group. Geneva:

WHO; 2003.

29. National Osteoporosis Society. Vitamin D and bone health: a practical clinical guideline for patient management [Internet].

Camerton: National Osteoporosis Society; 2016 [cited 2016 November 30]. Available from: https://nos.org.uk/media/2073/vi- tamin-d-and-bone-health-adults.pdf.

30. Dror Y, Giveon SM, Hoshen M, Feldhamer I, Balicer RD, Fedman BS. Vitamin D levels for preventing acute coronary syndrome and mortality: evidence of nonlinear association. J Clin Endoc- rinol Metab. 2013;98(5):2160-2167.

31. Nurbazlin M, Chee WSS, Rokiah P, Tan ATB, Chew YY, Siti Nusaibah AR, et al. Effects of sun exposure on 25 (OH) vitamin D concentration in urban and rural women in Malaysia. Asia Pac J Clin Nutr. 2013;22(3):391-399.

32. Dawson-Hughes B, Heaney RP, Holick MF, Lips P, Meunier PJ, Vieth R. Estimates of optimal vitamin D status. Osteoporos Int.

2005;16(7):713-716.

33. Kitamura N, Shigeno C, Shiomi K, Lee K, Ohta S, Sone T, et al.

(8)

Episodic fluctuation in serum intact parathyroid hormone con- centration in men. J Clin Endocrinol Metab. 1990;70(1):252- 263.

34. Freaney R, McBrinn Y, McKenna MJ. Secondary hyper- parathyroidism in elderly people: combined effect of renal in- sufficiency and vitamin D deficiency. Am J Clin Nutr. 1993;

58(2):187-191.

35. Ardawi MS, Qari M, Rouzi A, Maimani A, Raddadi R. Vitamin D status in relation to obesity, bone mineral density, bone turn- over markers and vitamin D receptor genotypes in healthy Saudi pre-and postmenopausal women. Osteoporos Int. 2011;

22(2):463-475.

36. Adami S, Bertoldo F, Braga V, Fracassi E, Gatti D, Gandolini G, et al. 25-hydroxy vitamin D levels in healthy premenopausal women: Association with bone turnover markers and bone mineral density. Bone. 2009;45(3):423-426.

37. Bischoff-Ferrari HA, Dietrich T, Orav EJ, Dawson-Hughes B.

Positive association between 25-hydroxy vitamin D levels and bone mineral density: a population-based study of younger and older adults. Am J Med. 2004;116(9):634-639.

38. Masud F. Vitamin D levels for optimum bone health. Singapore

Med J. 2007;48(3):207-212.

수치

Table  1.  Mean  of  vitamin  D  among  study  subjects  (N=120)  Confidence
Table  3.  Mean  levels  of  bone  turnover  markers  between  male  and  female

참조

관련 문서

Therefore, the purpose of this study is to study on the special education teachers’ state of first aid education completion, knowledge level and abilities

Objective: This study was conducted to identify the association between vitamin D and osteosarcopenia among all adults in Korea using data from the Korea National Health

The aim of this study was to compare the effect on bone regeneration relative to maintenance period of PTFE membrane in rabbit calcarial defects.. Eight adult

Effects of pulse frequency of low-level laser thrapy (LLLT)on bone nodule formation in rat calvarial cells.. Low-level laser therapy stimulats

Consequently, the present study was designed to investigate the effect of adding 60 mg of raloxifene hydrochloride daily to women treated with GnRH-a for severe endometriosis

Biochemical markers of bone turnover can be classified according to the process that underlie in markers of bone formation, products of the osteoblast

: Bone response to unloaded titanium implants with a sandblasted and acid-etched surface : A histomorphometric study in the canine mandible.. : Early

Buser D, Schenk RK, Steinemann S, Fiorellini JP, Fox CH, Stich H : influence of surface characteristics on bone integration of titannium implants..