Copyright © 2016 The Korean Society for Bone and Mineral Research
This is an Open Access article distributed under the terms of the Creative Commons Attribution Non-Commercial Li- cense (http://creativecommons.org/licenses/by-nc/4.0/) which permits unrestricted non-commercial use, distribu- tion, and reproduction in any medium, provided the original work is properly cited.
pISSN 2287-6375 eISSN 2287-7029
Proximal Femoral Geometry as Fracture Risk Factor in Female Patients with Osteoporotic Hip Fracture
Jun Han1, Myung Hoon Hahn2
1Department of Orthopeadics, Ajou University School of Medicine, Suwon;
2 Department of Orthopaedics, Cheil General Hospital and Women's Healthcare Center, Dankook University College of Medicine, Cheonan, Korea
Background: Proximal femoral geometry may be a risk factor of osteoporotic hip frac- tures. However, there existed great differences among studies depending on race, sex and age of subjects. The purpose of the present study is to analyze proximal femoral ge- ometry and bone mineral density (BMD) in the osteoporotic hip fracture patients. Fur- thermore, we investigated proximal femoral geometric parameters affecting fractures, and whether the geometric parameters could be an independent risk factor of fractures regardless of BMD. Methods: This study was conducted on 197 women aged 65 years or more who were hospitalized with osteoporotic hip fracture (femur neck fractures ; 84, intertrochanteric fractures; 113). Control group included 551 women who visited to check osteoporosis. Femur BMD and proximal femoral geometry for all subjects were measured using dual energy X-ray absorptiometry (DXA), and compared between the control and fracture groups. Besides, proximal femoral geometric parameters associated with fractures were statistically analyzed. Results: There were statistically significant dif- ferences in the age and weight, cross-sectional area (CSA)/length/width of the femoral neck and BMD of the proximal femur between fracture group and control group. BMD of the proximal femur in the control group was higher than in the fracture group. For the femoral neck fractures group, the odds ratio (OR) for fractures decrease in the CSA and neck length (NL) of the femur increased by 1.97 times and 1.73 times respectively, re- gardless of BMD. The OR for fractures increase in the femoral neck width increased by 1.53 times. In the intertrochanteric fracture group, the OR for fractures increase in the femoral neck width increased by 1.45 times regardless of BMD. Conclusions: We found that an increase of the femoral neck width could be a proximal femoral geometric pa- rameter which plays important roles as a risk factor for fracture independently of BMD.
Key Words: Femoral neck fracture, Hip fractures, Osteoporosis, Risk factors
INTRODUCTION
Of the osteoporotic fractures, especially hip fractures are a disease of which the social burden is high considering the economic loss and quality of life of patients.
[1,2] Osteoporotic hip fractures have been increasing rapidly with age among the elderly aged 65 years or older. Accordingly, the incidence of osteoporotic hip frac- tures is expected to explosively increase for the next 30 years due to population aging in Asia.[3,4] Hip fractures are classified into two categories according to an- atomical location, which include femoral neck fractures and intertrochanteric Corresponding author
Myung Hoon Hahn
Department of Orthopaedics, Cheil General Hospital and Women's Healthcare Center, Dankook University College of Medicine, 17 Seoae-ro 1-gil, Jung-gu, Seoul 04619, Korea
Tel: +82-2-2000-7278 Fax: +82-2-2000-7896 E-mail: [email protected] Received: July 12, 2016 Revised: August 3, 2016 Accepted: August 3, 2016
No potential conflict of interest relevant to this article was reported.
Original Article
fractures. Although femur neck fracture and intertrochan- teric fracture are considered as the same category as os- teoporotic hip fractures, there are several distinctions: for example, the distribution of cortical bone and spongy bone, fracture patterns, treatment modalities and prognosis of fractures.[5] Out of clinical risk factors for hip fractures, a low bone mineral density (BMD) is known for the most sensitive predictor of fractures in several studies.[6,7] How- ever, it has been reported in the study by Faulkner et al.[8]
in 1993 that hip fractures may be predicted by simple mea- surement of the femoral geometry, and geometric risk fac- tors predicting hip fractures regardless of BMD may exist.
Since then, a great number of studies on cross-sectional area (CSA) and width of the femoral neck and hips axis length (HAL) have been reported, but different results have been shown depending on race, sex and age.[9-12] A large num- ber of studies showed that in spite of lower hip BMD, the prevalence of hip fractures in Asians is relatively low com- pared with other races, due to differences in hip geometry among races.[13-16] However, studies on hip geometry for the elderly Asian women are very rare.[17,18] In the pres- ent study, we analyzed BMD and proximal femoral geome- try between the femoral neck fracture group and intertro- chanteric fracture group divided from women aged 65 years or more with osteoporotic hip fractures, and investigated proximal femoral geometric parameters affecting fractures.
Furthermore, we attempted to identify whether these geo- metric parameters are independent risk factors for fractures regardless of BMD.
METHODS
1. SubjectsThis study was conducted on 197 women aged 65 years or older who had osteoporotic hip fractures and were ad- mitted to the orthopedics department in the Ajou Univer- sity Hospital from March 2011 to May 2015. Subjects con- sisted of 84 patients with femoral neck fractures and 113 patients with intertrochanteric fractures. The following pa- tients were excluded in this study: patients with fractures caused by high-energy injury such as a motor vehicle acci- dent; patients with diseases affecting bone metabolism;
patients with a history of drug use including steroid medi- cines, bisphosphonates and selective estrogen receptor modulators (SERMs); patients in non-ambulatory status
pre-injury. Additionally, patients in which measurements of hip BMD and hip geometry are impossible due to frac- tures occurred in both hips were excluded. A retrospective study was conducted with the control group including 551 patients who were women over 65 years of age, and visit- ed to the outpatient clinic for the treatment of osteoporo- sis during the same period.
2. Measurements 1) BMD
For all subjects, femur BMD was measured using dual energy X-ray absorptiometry (DXA; Lunar Prodigy Advance, GE Lunar, Medison, WI, USA). Measurement of BMD in the total femur and femoral neck was performed preopera- tively, with the patient in the supine position and BMD for fracture patients was measured at the site without fracture within 10 days after injury. In the present study, total fe- mur only was used for measurement of BMD.
2) Proximal femoral geometric parameters
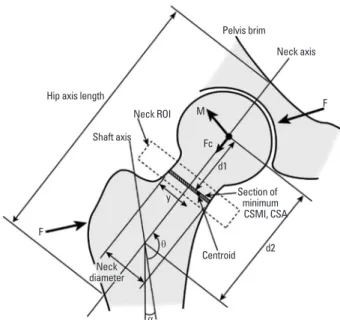
Proximal femoral geometric parameters were measured simultaneously along with measurement of BMD using DXA (the manufacturer’s advanced hip assessment soft- ware package, GE Lunar). The geometric parameters in- cluded HAL, CSA of the femoral neck, distance along the neck axis from the center of the femoral head to the sec- tion of minimum CSA (D1), distance from the center of the femoral head to the shaft axis (D2), neck width and neck shaft angle (NSA) (Fig. 1).
3. Statistical analysis
The results of this study were obtained by comparing among three groups including the control group, femoral neck fracture group and intertrochanteric fracture group.
Femoral geometric parameters associated with fractures were statistically analyzed using SPSS statistics program (SPSS version 22; SPSS Inc., Chicago, IL, USA). Statistic val- ues for each analytical variable were represented as mean and standard deviation (SD). The independent samples t- test was used for comparing the mean and SD of two inde- pendent groups: i.e. between the control group and the femoral neck fracture group; between the control group and the intertrochanteric fracture group; between the femoral neck fracture group and the intertrochanteric frac- ture group. If the P-value is less than 0.05, we decide the
Fig. 1. Parameters of proximal hip geometry: Hip axis length (HAL):
distance form greater trochanter to inner pelvic brim (mm). Cross- sectional area (CSA): CSA of mid neck portion (mm2). D1: Distance along the neck axis from the center of the femoral head to the sec- tion of minimum CSA (mm). D2: Distance from the center of the fem- oral head to the shaft axis (mm). Neck diameter: the width of neck (mm). Neck shaft angle: the angle between the femoral neck axis and the shaft axis (degree). ROI, region of interest; CSMI, cross-sectional moment of inertia.
Hip axis length
Pelvis brim
Neck axis
Neck ROI
Centroid y
M Fc
F
d1
Neck diameter F
d2
α θ Shaft axis
Section of minimum CSMI, CSA
Table 1. Demographic characteristics, densitometric and geometric parameters Control group FN fracture group P-value
(vs. control) IT fracture group P-value
(vs. control) P-value (FN vs. IT)
Number 551 84 113
Age (yr) 73.81±5.55 76.93±6.58 0.000 79.02±6.19 0.000 0.004
Height (cm) 151.26±5.77 151.46±6.36 0.960 152.31±5.21 0.225 0.602
Weight (kg) 59.46±6.64 52.40±9.95 0.000 52.80±10.01 0.000 0.972
HAL (mm) 102.06±5.54 101.07±5.78 0.334 101.82±6.06 0.922 0.658
CSA (mm2) 104.64±17.49 88.52±16.65 0.000 87.91±17.93 0.000 0.971
D1 (mm) 12.84±2.76 12.67±4.34 0.897 13.13±2.95 0.656 0.563
D2 (mm) 46.61±4.69 44.20±5.98 0.000 46.19±5.27 0.722 0.020
Neck width (mm) 31.03±1.96 31.80±2.15 0.006 31.82±2.34 0.001 0.999
NSA (degrees) 125.37±3.33 126.00±4.33 0.320 125.66±3.93 0.726 0.808
Total BMD (g/cm2) 0.76±0.12 0.65±0.12 0.000 0.61±0.10 0.000 0.117
FN, femur neck; IT, intertrochanteric; HAL, hips axis length; CSA, cross-sectional area; NSA, neck-shaft angle; BMD, bone mineral density.
results are statistically significant. Logistic regression analy- sis was used to obtain the odds ratio (OR) estimates for each variable, and the change in the OR associated with a one-unit change in the SD was represented.
RESULTS
Measurements of each variable in three groups are shown in Table 1. There were statistically significant differences in the age and weight, CSA/length/width of the femoral neck and BMD of the proximal femur between the control group and the femoral neck fracture group, as well as between the control group and the intertrochanteric fracture group.
Age and weight in the control group were younger and heavier than in the fracture group. For the CSA and width of the femoral neck, the control group was larger and thin- ner, as compared to the fracture group. The femur BMD was higher in the control group than in the fracture group.
No significant differences for HAL and NSA showed be- tween the control group and the fracture group. The mean age for the control group was 73.81±5.55 years, 76.93±
6.58 years for the femoral neck fracture group and 79.02±
6.19 years for the intertrochanteric fracture group. The mean age was significantly lower in the control group than in the fracture group (P<0.001). BMD of the total femur in the control group was 0.76±0.12 g/cm2, and one in the femoral neck fracture group and the intertrochanteric frac- ture group was 0.65±0.12 g/cm2 and 0.61±0.10 g/cm2 re- spectively. The control group had significantly higher BMD in the total femur, as compared to the fracture group. There were no statistically significant differences between the two fracture groups. Femoral neck length (NL) in the con- trol group and femoral neck fracture group was 46.61±
4.69 mm and 44.20±5.98 mm separately, as a result, the femoral NL was statistically significantly higher in the con-
trol group (P<0.001). No statistical significance for the fem- oral NL was between the control group and intertrochan- teric fracture group (P=0.722). The femoral NL between both fracture groups was statistically significantly shorter in the femoral neck fracture group (P=0.02).
The femoral neck width in the control group (31.03±1.96 mm) was statistically significantly thin, compared with the femoral neck fracture group (31.80±2.15 mm, P=0.006) and the intertrochanteric fracture group (31.82±2.34 mm, P=0.001). The OR of each variable were measured by lo- gistic regression analysis. When adjusting age, weight and height, the OR for fractures in the femoral neck fracture group increased depending on a decrease of the femoral NL and CSA as well as femur BMD, along with an increase of the femoral neck width (OR 2.45, 1.70, 1.61, 2.27). In the intertrochanteric fracture group, the OR for fractures incre- ased depending on a decrease of CSA in the femoral neck and femur BMD, along with an increase of the femoral neck width (OR 2.41, 1.45, 3.35) (Table 2). When adjusting age, weight, height and even BMD, in the femoral neck fracture group, the OR for fractures per SD decrease in CSA of the femoral neck increased by 1.97 times and 1.73 times per SD decrease in the femoral NL, regardless of BMD. The OR for fractures with a one SD increase in the femoral neck width increased by 1.53 times. In the intertrochanteric frac- ture group, the OR for fractures with a one SD increase in the femoral neck width increased by 1.45 times, indepen- dently of BMD (Table 3).
DISCUSSION
Hip fractures are classified into four major types accord- ing to anatomical location: femoral head fractures, femoral neck fractures, intertrochanteric fractures and subtrochan- teric fractures. Osteoporotic hip fractures include femoral neck fractures and intertrochanteric fractures of the femur, because these fractures are relatively common in the el- derly people. However, plenty of differences have been re- ported between femoral neck fractures and intertrochan- teric fractures. In the present study, we attempted to ana- lyze BMD and proximal femoral geometry in patients with the femoral neck fractures and intertrochanteric fractures, and investigate the proximal femoral geometric parame- ters affecting fractures. According to recent studies on dif- ferences between femoral neck fractures and intertrochan- teric fractures, Fox et al.[5], has reported that patients with intertrochanteric fractures were older, worse in the pre-in- jury health status, slower in the rate of return after treat- ment and higher in the mortality rate at 2 months and 6 months after injury. Pulkkinen et al.[19], in the cadaveric biomechanical study, have reported that femoral neck frac- tures predominate at the lowest structural mechanical strength levels, whereas trochanteric fractures are more common at high failure loads and females are more sus- ceptible to femoral neck fractures than males. Besides, changes in the femoral NSA has been reported to be im- portant geometric parameters predicting the incidence of the two fractures. The study by Duboeuf et al.[20], has re- vealed that BMD of the two fracture groups was lower in the intertrochanteric fracture group, and a significant dif- ference in HAL existed only in the femoral neck fracture Table 2. Odds ratios of each variable after adjusting for age, height,
and weight
OR 95% CI of OR
P-value Lower Upper Femur neck fracture patient
CSAa) D2a) Neck widthb) BMDa)
2.45 1.70 1.61 2.27
1.74 1.32 1.25 1.62
3.44 2.18 2.07 3.19
<0.0001
<0.0001 0.0002
<0.0001 Intertrochanteric fracture patient
CSAa) Neck widthb) BMDa)
2.41 1.45 3.35
1.76 1.21 2.39
3.30 1.95 4.69
<0.0001 0.0004
<0.0001
a)Fracture risk with 1 sd decrease of the variable. b)Fracture risk with 1 sd increase of the variable.
OR, odds ratio; CSA, cross-sectional area; BMD, bone mineral density.
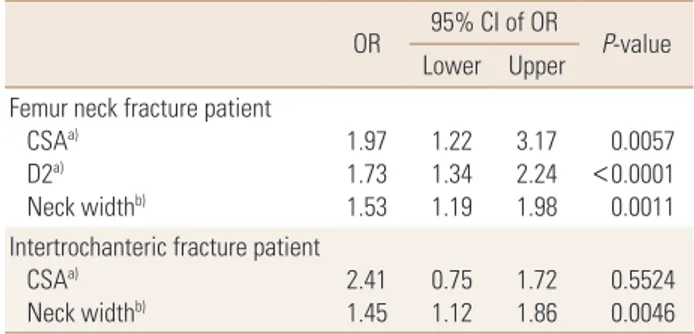
Table 3. Odds ratios of each variable after adjusting of age, height, weight, and bone mineral density
OR 95% CI of OR
P-value Lower Upper
Femur neck fracture patient CSAa)
D2a) Neck widthb)
1.97 1.73 1.53
1.22 1.34 1.19
3.17 2.24 1.98
0.0057
<0.0001 0.0011 Intertrochanteric fracture patient
CSAa)
Neck widthb) 2.41
1.45 0.75 1.12 1.72
1.86 0.5524 0.0046
a)Fracture risk with 1 sd decrease of the variable. b)Fracture risk with 1 sd increase of the variable.
OR, odds ratio; CSA, cross-sectional area; BMD, bone mineral density.
group. However, Maeda et al.[21], has reported that there were no differences in BMD and HAL between both frac- ture groups and the femoral NSA was lower in the intertro- chanteric fracture group. Panula et al.[22], has reported that no significant differences for the femoral NSA and NL were between the two fracture groups. In the present study, we found that age for the intertrochanteric fracture group was significantly higher, compared with the femoral neck fracture group (P=0.004), but no significant differences for BMD, HAL and NSA of the femur appeared between both fracture groups. The study by Compston et al.[23], sug- gested that the risk for hip fractures, clinical spine fractures and wrist fractures is inversely proportional to weight, and the risk for ankle fractures is directly proportional to weight.
In the present study, the weight in the two fracture groups was significantly lower compared with the control group.
Factors affecting bone strength include BMD, macro- structure and microstructure of bone, mineral and colla- gen composition, and microdamage. In several studies, a low BMD is known for the most sensitive predictor of frac- tures, out of clinical risk factors for hip fractures.[6,7] How- ever, it has been reported in the study by Faulkner et al.[8], in 1993 that hip fractures may be predicted by simple mea- surement of the femoral geometry, and geometric risk fac- tors predicting hip fractures may exist, regardless of BMD.
Broy et al.[24], in recent study based on several clinical re- sults, has reported that HAL is associated with the risk of hip fractures in post-menopausal women, but there was insufficient evidence to prove such association in men. It has been reported that the femoral NSA is a predictor of hip fractures in post-menopausal women and men aged 65 years or older, while the role of the femoral NSA as an independent factor regardless of BMD is unclear because of insufficient evidence.[24] In particular, there are plenty of studies on HAL and the femoral NSA as an independent predictor of hip fractures risk, and most of these studies show that longer HAL is associated with an increase in the femoral neck fractures.[25-29] Some studies showed that a larger NSA is associated with an increase in fractures.[30,31]
The study by Gnudi et al.[32], demonstrated that there ap- peared more significant differences for the proximal femo- ral geometry in the femoral neck fracture group, therefore, the femoral NSA along with BMD of the femoral neck could be an important predictor for fractures. According to the present study, statistically significant differences between
the control group and the fracture groups including the femoral neck fractures and the intertrochanteric fractures were for the age and weight, CSA/length/width of the fem- oral neck and BMD of the proximal femur, however no sig- nificant differences were for HAL and the femoral NSA.
In the present study, we found that thicker femoral neck in both fracture groups could be a proximal femoral geo- metric parameter of an important factor of fractures risk.
Of several studies on the femoral neck width, the study by El-Kaissi et al.,[33] has reported that post-menopausal women with hip fractures have thicker femoral neck and femur along with longer femoral NAL, as compared to wom- en with no fractures. This results from compensatory change in bone geometry for a decrease in volumetric BMD.[34,35]
But these results are not general. Pulkkinen et al.[19], has reported that the femoral neck width between both frac- ture groups had no significant differences, whereas Du- boeuf et al.[20], has reported that the intertrochanteric fracture group had a significantly short width in the femo- ral neck. It has been presumed that different results among studies originated from differences in sex, age and race and measurement method. Plenty of studies explained that Asian people have lower hip BMD rather than other races, but nonetheless, the incidence of hip fractures in Asian population is relatively low due to differences of hip geometry among races.[13-16] Peacock et al.[35], in a com- parative study of Black and White Americans, has reported that BMD was lower in White Americans. In comparing dif- ferences between men and women of the same race, BMD and hip geometry has been reported to be higher and smaller in women, because of differences in bone size de- pending on sex. The study by Kim et al.[12], which is on differences in femoral geometry depending on age and race, has shown that a marked decrease in trabecular volu- metric and width of cortical bone with age appeared in Asians. The prevalence of hip fractures in Asians has been reported to be lower because Asians had thicker cortical bone and lower buckling ratio, as compared with other races. Kaptoge et al.[30], has reported that an increase in the width of proximal femur along with a decrease in the width of cortical bone were seen in men and women aged more than 65 years, but progression was significantly fast- er in women than men. A study of hip geometry for elderly Asian women is uncommon. Wang et al.[36], who studied ethnic differences in young women, has reported that no
ethnic differences was observed in HAL among women, whereas HAL among men was shorter in Asian and Black than in White. Yan et al.[37], who examined ethnic differ- ences in men and women aged 55 to 77 years, has report- ed that a short HAL and NL in the Chinese men and wom- en could be an independent factor contributing to the low- er incidence of hip fractures in comparison with Caucasian men and women. The study by Im and Lim [17], which was conducted on 100 elderly men and women in Korea and by comparing between the two fracture groups, has re- ported that the femoral NSA and HAL were significantly greater in the patients with intertrochanteric fracture group than control patients. It has been reported by Li et al.[18], that there has no significance for HAL and the femoral NSA in the hip fracture group, but a reduction in BMD and CSA of the femoral neck along with width of cortical bone were significantly observed. It has been presumed that different results of these studies conducted on Asians were caused by differences in the measurement method, age and a small number of subjects.
In the present study, the OR of each variable after adjust- ment for age, weight and height were measured. In the femoral neck fracture group, a decrease of the femoral NL and BMD with CSA of the femoral neck, and an increase of the femoral neck width were associated with the increase in the OR of fractures (OR 2.45, 1.70, 1.62, 2.27). In the in- tertrochanteric fracture group, a decrease of CSA in the femoral neck and the femoral BMD, and an increase of the femoral neck width were associated with the increase in the OR for fractures. We found that femoral neck fractures are affected more by proximal femoral geometry and in- tertrochanteric fractures are affected more by BMD. When measuring the OR of each variable after adjustment for age, weight, height and BMD of the total femur, in the femoral neck fracture group, the OR for fractures per SD decrease in CSA of the femoral neck and NL increased by 1.97 times and 1.73 times respectively, regardless of BMD, and the OR for fractures per SD increase in the femoral neck width increased by 1.53 times. In the intertrochanter- ic fracture group, the OR for fractures per SD increase in the femoral neck width increased by 1.45 times, indepen- dently of BMD. We found that an increase of the femoral neck width could be proximal femoral geometric parame- ters which played roles as an independent factor of frac- tures in either fracture groups, regardless of BMD.
This study has several limitations as follows; the study design is cross-sectional and retrospective design, selec- tion bias in control patients because who actively concerns for their health, we used 2-dimensional DXA program so minor measurement error could occur.
In conclusion, we found that the femoral neck width could be proximal femoral geometric parameters which play roles as an independent risk factor of fractures, regardless of BMD. Additionally, it has been found in the present study that femoral neck fractures was affected more by proximal femoral geometry, whereas intertrochanteric fractures was affected more by BMD.
REFERENCES
1. Ström O, Borgström F, Kanis JA, et al. Osteoporosis: bur- den, health care provision and opportunities in the EU: a report prepared in collaboration with the International Osteoporosis Foundation (IOF) and the European Federa- tion of Pharmaceutical Industry Associations (EFPIA). Arch Osteoporos 2011;6:59-155.
2. Cummings SR, Melton LJ. Epidemiology and outcomes of osteoporotic fractures. Lancet 2002;359:1761-7.
3. Johnell O, Kanis JA. An estimate of the worldwide preva- lence and disability associated with osteoporotic fractures.
Osteoporos Int 2006;17:1726-33.
4. Gullberg B, Johnell O, Kanis JA. World-wide projections for hip fracture. Osteoporos Int 1997;7:407-13.
5. Fox KM, Magaziner J, Hebel JR, et al. Intertrochanteric ver- sus femoral neck hip fractures: differential characteristics, treatment, and sequelae. J Gerontol A Biol Sci Med Sci 1999;
54:M635-40.
6. Svejme O, Ahlborg HG, Nilsson JÅ, et al. Low BMD is an in- dependent predictor of fracture and early menopause of mortality in post-menopausal women--a 34-year prospec- tive study. Maturitas 2013;74:341-5.
7. Johnell O, Kanis JA, Oden A, et al. Predictive value of BMD for hip and other fractures. J Bone Miner Res 2005;20:1185- 94.
8. Faulkner KG, Cummings SR, Black D, et al. Simple measure- ment of femoral geometry predicts hip fracture: the study of osteoporotic fractures. J Bone Miner Res 1993;8:1211-7.
9. Yoshikawa T, Turner CH, Peacock M, et al. Geometric struc- ture of the femoral neck measured using dual-energy x- ray absorptiometry. J Bone Miner Res 1994;9:1053-64.
10. Beck TJ. Extending DXA beyond bone mineral density: un- derstanding hip structure analysis. Curr Osteoporos Rep 2007;5:49-55.
11. LaCroix AZ, Beck TJ, Cauley JA, et al. Hip structural geome- try and incidence of hip fracture in postmenopausal wom- en: what does it add to conventional bone mineral densi- ty? Osteoporos Int 2010;21:919-29.
12. Kim KM, Brown JK, Kim KJ, et al. Differences in femoral neck geometry associated with age and ethnicity. Osteoporos Int 2011;22:2165-74.
13. Cummings SR, Cauley JA, Palermo L, et al. Racial differenc- es in hip axis lengths might explain racial differences in rates of hip fracture. Study of Osteoporotic Fractures Re- search Group. Osteoporos Int 1994;4:226-9.
14. Cheng SY, Levy AR, Lefaivre KA, et al. Geographic trends in incidence of hip fractures: a comprehensive literature re- view. Osteoporos Int 2011;22:2575-86.
15. Cooper C, Cole ZA, Holroyd CR, et al. Secular trends in the incidence of hip and other osteoporotic fractures. Osteo- poros Int 2011;22:1277-88.
16. Nelson DA, Beck TJ, Wu G, et al. Ethnic differences in femur geometry in the women‘s health initiative observational study. Osteoporos Int 2011;22:1377-88.
17. Im GI, Lim MJ. Proximal hip geometry and hip fracture risk assessment in a Korean population. Osteoporos Int 2011;
22:803-7.
18. Li Y, Lin J, Cai S, et al. Influence of bone mineral density and hip geometry on the different types of hip fracture.
Bosn J Basic Med Sci 2016;16:35-8.
19. Pulkkinen P, Eckstein F, Lochmuller EM, et al. Association of geometric factors and failure load level with the distri- bution of cervical vs. trochanteric hip fractures. J Bone Min- er Res 2006;21:895-901.
20. Duboeuf F, Hans D, Schott AM, et al. Different morphomet- ric and densitometric parameters predict cervical and tro- chanteric hip fracture: the EPIDOS Study. J Bone Miner Res 1997;12:1895-902.
21. Maeda Y, Sugano N, Saito M, et al. Comparison of femoral morphology and bone mineral density between femoral neck fractures and trochanteric fractures. Clin Orthop Relat Res 2011;469:884-9.
22. Panula J, Sävelä M, Jaatinen PT, et al. The impact of proxi- mal femur geometry on fracture type--a comparison be- tween cervical and trochanteric fractures with two param- eters. Scand J Surg 2008;97:266-71.
23. Compston JE, Flahive J, Hosmer DW, et al. Relationship of weight, height, and body mass index with fracture risk at different sites in postmenopausal women: the Global Lon- gitudinal study of Osteoporosis in Women (GLOW). J Bone Miner Res 2014;29:487-93.
24. Broy SB, Cauley JA, Lewiecki ME, et al. Fracture risk predic- tion by non-BMD DXA measures: the 2015 ISCD official positions part 1: hip geometry. J Clin Densitom 2015;18:
287-308.
25. Frisoli A, Jr., Paula AP, Pinheiro M, et al. Hip axis length as an independent risk factor for hip fracture independently of femural bone mineral density in Caucasian elderly Bra- zilian women. Bone 2005;37:871-5.
26. Faulkner KG, Wacker WK, Barden HS, et al. Femur strength index predicts hip fracture independent of bone density and hip axis length. Osteoporos Int 2006;17:593-9.
27. Iolascon G, Moretti A, Cannaviello G, et al. Proximal femur geometry assessed by hip structural analysis in hip frac- ture in women. Aging Clin Exp Res 2015;27 Suppl 1:S17- 21.
28. Leslie WD, Lix LM, Morin SN, et al. Adjusting hip fracture probability in men and women using hip axis length: the manitoba bone density database. J Clin Densitom 2016;
19:326-31.
29. Leslie WD, Lix LM, Morin SN, et al. Hip axis length is a FRAX- and bone density-independent risk factor for hip fracture in women. J Clin Endocrinol Metab 2015;100:2063-70.
30. Kaptoge S, Dalzell N, Loveridge N, et al. Effects of gender, anthropometric variables, and aging on the evolution of hip strength in men and women aged over 65. Bone 2003;
32:561-70.
31. Gnudi S, Sitta E, Pignotti E. Prediction of incident hip frac- ture by femoral neck bone mineral density and neck-shaft angle: a 5-year longitudinal study in post-menopausal fe- males. Br J Radiol 2012;85:e467-73.
32. Gnudi S, Ripamonti C, Lisi L, et al. Proximal femur geome- try to detect and distinguish femoral neck fractures from trochanteric fractures in postmenopausal women. Osteo- poros Int 2002;13:69-73.
33. El-Kaissi S, Pasco JA, Henry MJ, et al. Femoral neck geom- etry and hip fracture risk: the Geelong osteoporosis study.
Osteoporos Int 2005;16:1299-303.
34. Gregory JS, Aspden RM. Femoral geometry as a risk factor for osteoporotic hip fracture in men and women. Med Eng Phys 2008;30:1275-86.
35. Peacock M, Buckwalter KA, Persohn S, et al. Race and sex differences in bone mineral density and geometry at the femur. Bone 2009;45:218-25.
36. Wang MC, Aguirre M, Bhudhikanok GS, et al. Bone mass and hip axis length in healthy Asian, black, Hispanic, and
white American youths. J Bone Miner Res 1997;12:1922- 35.
37. Yan L, Crabtree NJ, Reeve J, et al. Does hip strength analy- sis explain the lower incidence of hip fracture in the Peo- ple’s Republic of China? Bone 2004;34:584-8.