VERIFICATION OF CONSTRUCTION STATUS BY COMPARING LASER-SCANNED POINT CLOUD WITH DESIGN DRAWING
Hyokeun Park, Hyoung-Sig Cho, Soohee Han, Joon Heo , Hong-Gyoo Sohn
School of Civil and Environmental Engineering, Yonsei University, [email protected]; [email protected];
[email protected]; [email protected]
ABSTRACT. In the process of the safety assessment or rework determination for the structures constructed or under construction, it is significantly important to verify that the construction workflow followed (or follows) original designs.
Change in construction results in degradation of the level of the safety of the structure, and also increase construction cost due to rework. Generally traditional surveying technique using total station is applied to the consistency verification between as-built and as-designed condition, which measures few feature points of the structure and compare design with them. However, since this method uses only a few feature points for comparing as-built condition with as-designed condition, it is difficult to accurately examine consistency between them. It also has a disadvantage of increasing construction cost and time. Terrestrial laser scanning is a technology that creates accurate three-dimensional images of real-world objects and existing conditions.
In this research, an effective method for the verification of construction status by comparing laser-scanned point cloud with design drawing is proposed, which is applicable to verify that the structure was built as design drawing. This study proposed a methodology which can check the difference between design drawing and as-built condition. More specifically, the mean and standard deviation values calculated from the distances between laser-scanned point cloud and the corresponding 3D design drawing are utilized for this purpose. One should note that 3D design drawing is acquired from 2D one. The proposed methodology is tested with real data and its feasibility is proved. Conclusively, this research proposed a more standardized methodology which can verify that the structures are built as design drawings while compared to the traditional approaches.
KEY WORDS: Terrestrial LiDAR, 3D information, Design drawing, Point cloud, orthogonal transformation
1. INTRODUCTION
Structures that are constructed based on design drawings can create situations in which actual construction at the site proceed differently from the design drawings due to influence of the characteristics of the construction site and its existing structures. There is also an increased need to inspect, measure, and verify the structures that are constructed differently from design drawings, and revise and renew the design drawings. In research using terrestrial LiDAR, studies are being actively carried out on such subjects as coastal topography extraction, road geometry information extraction, 3D modeling of rock slopes, tunnel inner section measurements, tunnel’s overbreak and underbreak volume calculations, safety analysis on blind end of tunnels, landslide monitoring, and observations on dam displacements (Lee Jong-chul et al. 2007; Lee Yong-chang et al. 2007; Yun Bu-yeol et al. 2005; Park Jae-guk et al., Park Se-hun et al. 2009). Existing studies mainly deal with research on monitoring, the economy of extracting 3D information, and suitability of usage. It is judged that, as no comparative study has yet been done on interior space design drawings and data from terrestrial LiDAR, research on revising and renewing design drawings is needed. In this paper, therefore, the 2D design drawings were converted into 3D drawings using 3D Max software, and they were compared with the point cloud data from terrestrial LiDAR.
2. EXPERIMENTAL PROGRAM 2.1 Research Method
A laser scanner is a device that uses the laser pulses being reflected from a subject to accurately express the subject’s surface as precise 3D point cloud location information. When this device is applied to construction sites, it can extract a point cloud of either the outer walls of buildings or inner spatial shapes. The extracted point cloud can be used to inspect the construction site, but for that, the data must first go through a registration process with the 3D design of the building.
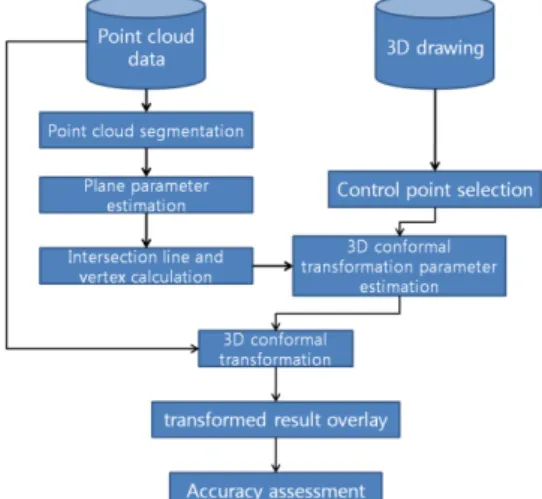
Figure 1. Point cloud registration flow chart
Figure 1 is a schematization of the work flow that registers the point cloud data to the 3D drawing of the building. The point cloud obtained from laser scanner is classified according to the surface planes that compose it.
Each of the points that have been separated is used to estimate the parameters of the surfaces to be expressed using mathematical calculations. The extracted surfaces are then used to extract control points. And then 3D conformal transformation parameters are estimated to register the point clouds to the 3D drawing.
2.2 Research Subject Location
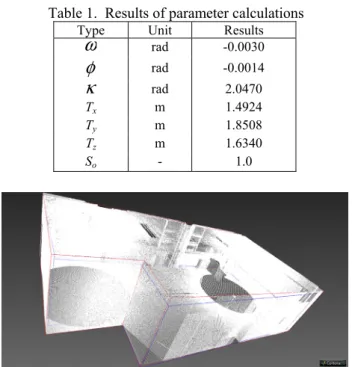
To carry out the point cloud registration experiment, the lecture room 401 in Engineering Hall I at Yonsei University located in Shinchon-dong, Seoul, was scanned, and that data was registered with the room’s 3D design drawing. The point cloud’s overall shape is shown in Figure 2. The data was acquired using Leica’s HDS 6000 and registered two sets of scan data.
Figure 2. Point cloud of subject location 3. RESULTS
3.1 Plane Intersection Calculation and Control Points Selection
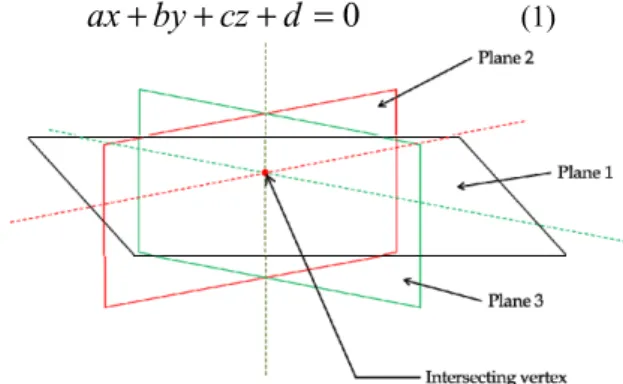
The acquired point clouds were segmented following the points that identified the surfaces, and the classified point clouds were used to extract plane parameters using the least squares estimation. The equation for regular planes in 3D space can be expressed as the following linear with four parameters (Eq. 1).
=0 + + +by cz d
ax (1)
Figure 3. Relationship between planes, intersection lines and points
Here, assuming the plane does not pass the coordinate system’s origin (0, 0, 0), the above equation can be expressed as
0 1 = + + + by cz
ax
(2)an equation with three parameters. Three planes which are not parallel to each other generally meet and compose lines and points of intersection as shown in Figure 3.
The lines and points thus produced can be used to register the point cloud to the 3D design drawing. In this paper, the intersecting points where three planes meet together were used as the control points for the registration. The location of the control points chosen to deduce the parameters needed for 3D similarity transformation are as shown in Figure 4.
Figure 4. Placement of control points
The twelve control points can be acquired by obtaining the location of the intersecting lines of three planes using the linear equation (Eq. 2) above. In addition, the 3D coordinates of the control points were also obtained from the CAD drawing.
3.2 3D Conformal Transformation
The 3D orthogonal transformation is a transformation involving three-axis rotation, translation, and scaling using 3D coordinates. This transformation has the characteristic of preserving the shape of the 3D objects after the transformation. When this transformation is expressed as a matrix, it is expressed as
⎥⎥
⎥
⎦
⎤
⎢⎢
⎢
⎣
⎡ +
⎥⎥
⎥
⎦
⎤
⎢⎢
⎢
⎣
⎡
⋅
⎥⎥
⎥
⎦
⎤
⎢⎢
⎢
⎣
⎡
=
⎥⎥
⎥
⎦
⎤
⎢⎢
⎢
⎣
⎡
z y x
T T T z y x R R R R R R R R R S Z Y X
33 23 13
32 22 12
31 21 11
0 (3)
In order to estimate the parameters needed for the transformation, the matrix is linearized through partial differentiation. When that linearized equation is used in an iteration using the Newton-Raphson method, the parameters needed for the transformation can be calculated. The results of the calculation are as shown in Table 1. Using the parameters above, a conformal transformation was applied to the control points extracted from the point cloud and the results were compared with the values in the CAD drawing. When the values are compared in the x and y plane, they overlap as shown in
Figure 6. The dotted lines signify the outer lines in the x and y plane of the 3D model. The solid lines are the outer lines produced by using the intersecting vertices extracted from the point cloud. The dotted lines represent the outer lines of the CAD drawing, and the solid lines represent the point cloud that has been orthogonally transformed.
Table 1. Results of parameter calculations Type Unit Results
ω
rad -0.0030φ
rad -0.0014κ
rad 2.0470 Tx m 1.4924 Ty m 1.8508 Tz m 1.6340So - 1.0
Figure. 5. Results of registered drawing and point cloud
Using the coordinates after the conformal transformation, a comparison with wall surface planes in the 3D drawing was carried out. The normal vectors of the planes representing the coordinates of the transformed points were calculated and compared with those of the data from the CAD drawing after the registration process was completed with respect to the x and y plane. The values are as shown in Table 2.
Table 2. Results of comparing the values of each wall (Unit: m)
Type Design Drawing
Registration on Results
Difference
Backside 3.685 4.161 +0.476 Right 1 2.150 2.778 +0.628
Right 2 2.020 1.652 -0.368 Right 3 8.880 8.593 -0.287
Front 5.705 5.771 +0.066 Left 10.950 10.920 -0.030
4. CONCLUSTIONS
In this paper, the point cloud data obtained with the terrestrial LiDAR was used to confirm the possibility of
investigating construction sites as follows. When comparisons were made using the space of an actual research subject, the results showed a maximum of
±63cm and a minimum of ±3cm difference. The 63cm difference arose from the fact that the spatial changes that occurred when elevators were installed inside the existing building were not reflected in the design drawing. Using the terrestrial LiDAR made it possible to verify the differences between design drawings and actual construction site conditions, and it is judged that, in the future, once a 3D construction drawing is provided, it will be possible to verify the information needed before and after construction.
5. Acknowledgement
This research was supported by a grant(07KLSGC04 : Development of 3D data acquisition and verification system using latest surveying technology) from Cutting- edge Urban Development - Korean Land Spatialization Research Project funded by Ministry of Construction &
Transportation of Korean government.
6. References
Yun, B. Y., Park, W. Y., Jang, S. K., Chung, C. S., 2005.
Tunnel Convergence and Crown Observation using 3D Laser Scanning. Proceedigns of KSCE Annual conference.
Lee, J. C., Kim, H. G., Lee, Y. D., Roh, T. H., 2007.
Development of Cross Section Management System in Tunnel Using Terrestrial Laser Scanner. Proceedings of KSCE Annual conference.
Kim, I. S., Lim, S. B., 2007. A Study on 3D Section Profiling Surveying in Tunnel Excavation Using a Laser Scanner. KSCE Journal of Civil Engineering, Vol 27, no4, pp.541-546.
Lee, J., Kim, Y., and Song, Y., 2007. Semi Variance Measurement on Tunnel using 3D Laser Scanning. JKGS J Korean Geophysical Soc, Vol. 10, no. 1, pp. 27-35, Park, J. K., Lee, S. Y., 2008. An Accuracy Assessment of the Terrestrial LiDAR for Landslide Monitoring. Journal of Korean Society of Geodesy, Photogrammetry, and Cartography, Vol26, no2, pp.117~127
Park, S. H., Choi, D. H, Han, D. Y., 2009. Deformation Measurements of Dam using Terrestrial Laser Scanner.
Journal of Korean Society of Geodesy, Photogrammetry, and Cartography, Vol 27, no,1, pp.645-655