° 2012. The Korean Astronomical Society. All Rights Reserved. c
THE SYNERGY OF LARGE AREA SURVEYS WITH AKARI AND HERSCHEL
Chris Pearson
1,2, Stephen Serjeant
2, Chris Sedgwick
2, Glenn J. White
1,2, Hideo Matsuhara
3, Toshinobu Takagi
3, Oi Nagisa
3, Kazumi Murata
3, Takao Nakagawa
3, and Issei Yamamura
31
RAL Space, Rutherford Appleton Laboratory, Chilton, Didcot, Oxfordshire OX11 0QX, UK
2
Department of Physical Sciences, The Open University, Milton Keynes MK7 6AA, UK
3
Institute of Space and Astronautical Science, JAXA, Sagamihara, Kanagawa, 229 8510, Japan E-mail: [email protected]
(Received July 04, 2012; Accepted August 04, 2012)
ABSTRACT
The Herschel Space Observatory is the European Space Agency’s state of the art infrared space telescope launched into space on 14 May 2009, covering the wavelength range from 70-700 microns with 3 instruments SPIRE, PACS and HIFI. Large area surveys are being carried out by Herschel in the AKARI legacy fields at the North and South Ecliptic Poles and the AKARI All-Sky Survey provides additional synergy with the largest survey with Herschel, H-ATLAS, covering more than 500 square degrees. This paper reports on some of the early results of these synergies between Herschel and AKARI including the first comparison of the AKARI All-Sky Survey number counts with the deeper Herschel surveys.
Key words: infrared: telescope; infrared: galaxies; evolution
1. INTRODUCTION
The Japanese AKARI satellite was launched in 2006 (Murakami et al., 2007) with the goal of carrying out the first All-Sky Survey in the infrared since IRAS in four far-infrared bands at 65, 90, 140, 160 µm with its Far-Infrared Surveyor instrument (FIS, Kawada et al., 2007) and two mid-infrared bands at 9 and 18 µm with its Infrared Camera (IRC, Onaka et al., 2007).
In addition to this, two legacy fields were identified at the North and South ecliptic poles which afforded high visibility to AKARI. The North Ecliptic Pole (NEP, Matsuhara et al., 2006) and South Ecliptic Pole (SEP, Matsuura et al., 2011) were subject to deep surveys with AKARI’s IRC and FIS instruments respectively.
The NEP & SEP surveys have naturally become the targets for vigorous follow-up with other ground based and space-borne facilities in order to accumulate addi- tional ancillary multi-wavelength data. Most recently the AKARI legacy fields have been targeted by the Eu- ropean Space Agency’s new far-infrared–submillimetre facility, Herschel (launched on 14 May 2009, Pilbratt et
al., 2010). Herschel includes 2 instruments for photom- etry. The Spectral and Photometric Imaging REceiver (SPIRE, Griffin et al., 2010), is Herschel’s submillime- tre camera including a three-band imaging photometer operating at 250, 350 and 500 µm respectively with a
∼4
0×8
0field of view. The Photodetector Array Cam- era and Spectrometer (PACS, Poglitsch et al., 2010) is Herschel’s far-infrared camera covering the 60-210 µm wavelength range with three bands at 60-85 85-125 and 125-210 µm, over a field of view of ∼1.75
0×3.5
0.
In this paper we compare the results from the AKARI All-Sky Survey and the deep legacy survey at the NEP with the latest results from Herschel. Un- less otherwise stated, a flat concordance cosmology of H
0= 72 km s
−1Mpc
−1, Ω
m= 0.3, and Ω
Λ= 0.7 is assumed throughout.
2. THE AKARI ALL SKY SURVEY
The AKARI All-Sky Survey Bright Point Source Cat- alogue (FIS-BSC; Yamamura et al., 2010), contains a
http://pkas.kas.org 375
Fig. 1. Selection of sources from the AKARI All-Sky Survey in Galactic coordinates (latitude b and longitude l).
Sources are selected at Galactic latitudes > ±30 degrees.
total of 427,071 sources over the entire sky between the FIS bands 65 µm, 90 µm, 140 µm, & 160 µm (hereafter referred to as N60, WIDE-S, WIDE-L & N160 respec- tively), to 5σ sensitivities of 3.2 Jy, 0.55 Jy, 3.8 Jy
& 7.5 Jy respectively. The AKARI All-Sky Survey is the only source of high resolution infrared data in ar- eas of the sky outside Spitzer fields, most importantly over the 550 square degree of the H-ATLAS Open Time Key Program (OTKP, Eales et al., 2010), the largest area Herschel project. Although H-ATLAS achieves a better sensitivity at 100, 160 µm with the PACS in- strument, the AKARI All-Sky Survey is still valuable to characterise the far-infrared spectral energy distri- butions of H-ATLAS sources and also to constrain the very bright end of the large area galaxy number counts.
Galaxy number counts are used to constrain both the evolutionary history of the Universe and to characterise the contribution of different populations of sources at different flux regimes (e.g. Pearson, 2009, 2005). The deepest Herschel surveys at 70-160 µm reach down to
∼ 1 mJy in the PACS bands (Berta et al., 2011) while the H-ATLAS counts are expected to cover the inter- mediate flux range from 100-1,000 mJy. The AKARI All-Sky Survey will extend the bright count regime to fluxes 2 orders of magnitude brighter. In order to calcu- late the extragalactic number counts from the AKARI FIS-BSC the contamination from stars must be min- imised. This is realised by a simple two stage selec- tion process. The first step is to select only galaxies at Galactic latitudes > ±30 degrees to reject the bulk of Galactic objects (c.f. IRAS, Rowan-Robinson et al., 1984, 1991). The resulting sky distribution is shown
0.01 0.1 1 10 100
0.01 0.1 1 10
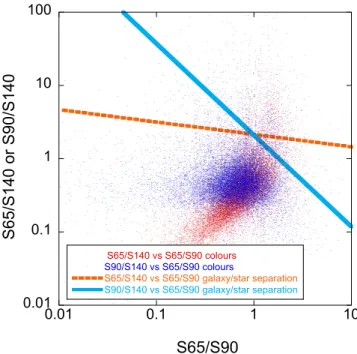
S65/S140 vs S65/S90 colours S90/S140 vs S65/S90 colours
S65/S140 vs S65/S90 galaxy/star separation S90/S140 vs S65/S90 galaxy/star separation
S6 5 /S1 4 0 o r S9 0 /S1 4 0
S65/S90
Fig. 2. Galaxy–star separation in the AKARI All-Sky Survey.
in Figure 1 and covers a total area of ∼ 35,700 deg
2., or almost 90% of the sky. The second step follows the galaxy–star separation of Pollo et al. (2010), who define a set of colour-colour criteria to segregate the AKARI galaxies from stellar populations allowing the selec- tion of >95% of galaxies and rejection of 80% of stars.
In Figure 2 we show the colour-colour segregation for the S65/S140 vs S65/S90 and S90/S140 vs S65/S90 colours assuming the following criteria for the selection of galaxies; S65/S140 > −0.17 × S65/S90 + 0.33 and S90/S140 > −1.24 × S65/S90 + 0.32. The final sample of galaxies consists of 26,840 sources in the WIDE-S band (90 µm). In Figure 3 the raw count histograms are shown. The most sensitive WIDE-S band has num- ber counts peaking around 650 mJy. The N60 band counts peak at a similar level although the reliability of the sources are based on WIDE-S detections at 90 µm.
The longer wavelength WIDE-L and N160 bands peak at brighter flux levels of around 2.2 Jy (2,200 mJy).
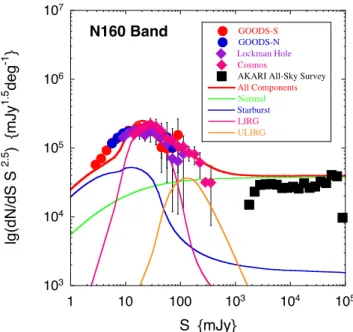
In Figures 4 and 5 we present the WIDE-S (90 µm) and N160 (160 µm) differential number counts nor- malised to a flat Euclidean universe from the AKARI All-Sky Survey. The AKARI number counts cover the flux range from ∼ 1 Jy (1,000 mJy) to brighter fluxes.
Note that the number counts are not corrected for com-
pleteness. For comparison, the deeper number counts
with the Herschel PACS instrument are also plotted for
0 1000 2000 3000 4000 5000 6000
2 2.5 3 3.5 4 4.5 5
WIDE-S (90 micron band) WIDE-L (140 micron band) N60 (65 micron band) N160 (160 micron band)
N u mb e r
lg(S) {mJy}
Fig. 3. Raw number counts with flux (S), for the AKARI All-Sky Survey in the N60, WIDE-S, WIDE-L & N160 bands.
the PACS Evolutionary Probe program (Berta et al., 2011) for the GOODS-N, GOODS-S, Lockman Hole and Cosmos fields at 100 & 160 µm for fluxes fainter than ∼ 0.1 Jy (100 mJy). At the time of this work, the source counts from the H-ATLAS program were not in the public domain but are expected to bridge the divide between the bright AKARI counts and the fainter counts from PEP. We also compared the ob- served counts in Figures 4 and 5 with updated galaxy evolution models based on the pre-Herschel models of Pearson & Khan (2009) and Pearson (2005). These models provide a backwards evolution framework for an extragalactic population divided into normal quies- cent galaxies, star-forming galaxies (L
IR< 10
11L
¯) luminous (LIRG; 10
11L
¯< L
IR< 10
12L
¯) and ultra- luminous infrared galaxies (ULIRG; L
IR> 10
12L
¯).
Comparing the observed counts with the models im- plies that the AKARI All-Sky Survey and Herschel- PEP survey are probing different galaxy populations.
The AKARI All-Sky Survey is expected to be domi- nated by cool cirrus type normal galaxies with a small contribution from star-forming galaxies at the bright- est fluxes. At the faintest fluxes, in the AKARI bands we may expect to pick up the tail of the LIRG, ULIRG population. This has been hinted at by the associa- tion of AKARI All-Sky Survey sources with H-ATLAS galaxies in Pearson et al. (2012, in preparation). The
10
410
510
610
71 10 100 10
310
410
5WIDE-S Band
GOODS-SGOODS-N Lockman Hole Cosmos
AKARI All-Sky Survey Total
Normal Galaxies Starburst Galaxies LIRG ULIRG
lg (d N /d S S
2.5) { mJy
1.5d e g
-1}
S {mJy}
Fig. 4. Differential number counts as a function of flux (S), normalised to a Euclidean universe for the AKARI FIS WIDE-S (90 micron) band. The AKARI All-Survey number counts are compared to the deeper Herschel PACS counts of Berta et al. (2011) in the GOODS-N, -S, Lockman Hole and COSMOS fields and the contemporary galaxy evolution models based on Pearson & Khan (2009).
deeper PACS PEP surveys trace the emergence of a strongly evolving luminous (i.e. LIRG rather than ULIRG) population that become dominant at the peak of the number counts. These results are consistent with Berta et al. (2011) who find that the majority of the far-infrared background resolved by the PACS instru- ments comes from galaxies with (IR) luminosities in the range 10
11L
¯< L
IR< 10
12L
¯.
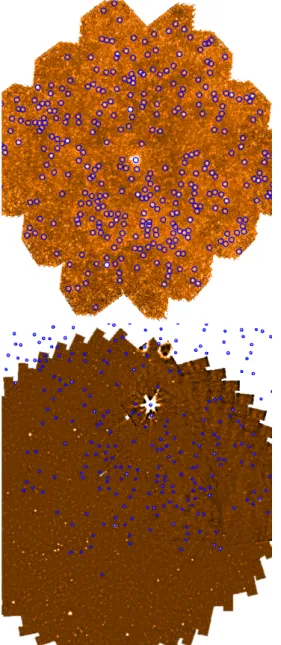
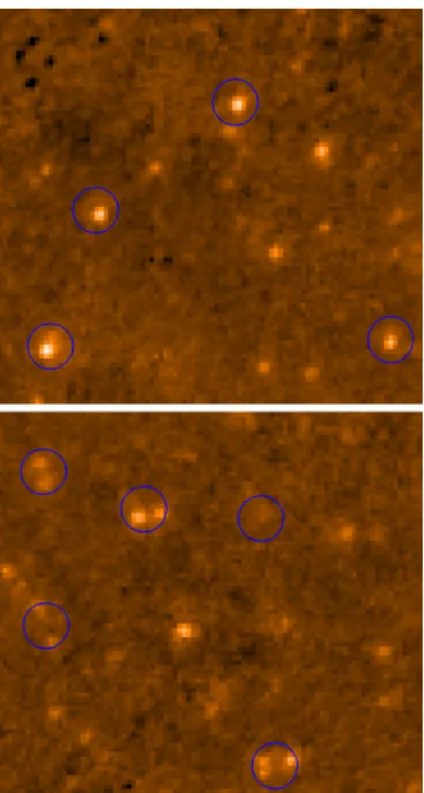
3. HERSCHEL OBSERVATIONS IN THE AKARI NEP FIELD
The AKARI NEP field was observed with the IRC in-
strument and was covered in both deep-narrow and
shallow-wide surveys. The NEP-Deep field was centred
at RA = 17 h 56 m, Dec = 66 d 37 m, slightly offset
from the NEP and was observed in all IRC bands to 5σ
point source detection limits of 9.6 µJy, 7.5 µJy, 5.4 µJy,
49 µJy, 58 µJy, 71 µJy, 117 µJy, 121 µJy and 276 µJy
in the N2, N3, N4, S7, S9W, S11, L15, L18W & L24
bands respectively (Wada et al., 2008; Takagi et al.,
2012). The total number of sources detected in the mid-
infrared bands was 7,284 over an area of 0.67 square
10
310
410
510
610
71 10 100 10
310
410
5N160 Band
GOODS-S GOODS-N Lockman Hole CosmosAKARI All-Sky Survey All Components Normal Starburst LIRG ULIRG