Effect of KHCO
3Concentration Using CuO Nanowire for Electrochemical CO
2Reduction Reaction
Rohini Subhash Kanase1 and Soon Hyung Kang2,†
1Interdisciplinary Program for Photonic Engineering, Chonnam National University, 300, Yongbong-Dong, Buk-Gu, Gwangju 61186, Korea
2Department of Chemistry Education and Optoelectronic Convergence Research Center, Chonnam National University, Yongbong-ro 77, Yongbong-dong, Gwangju 61186, Korea
(Received October 22, 2020: Corrected December 9, 2020: Accepted December 16, 2020)
Abstract: Copper has been proved to be the best catalyst for electrochemical CO2 reduction reaction, however, for opti- mal efficiency and selectivity, its performance requires improvements. Electrochemical CO2 reduction reaction (RR) using CuO nanowire electrode was performed with different concentrations of KHCO3 electrolyte (0.1 M, 0.5 M, and 1 M).
Cu(OH)2 was formed on Cu foil, followed by thermal-treatment at 200°C under the air atmosphere for 2 hrs to transform it to the crystalline phase of CuO. We evaluated the effects of different KHCO3 electrolyte concentrations on electro- chemical CO2 reduction reaction (RR) using the CuO nanowire electrode. At a constant current (5mA), low concentrated bicarbonate exhibited a more negative potential -0.77 V vs. Reversible Hydrogen Electrode (RHE) (briefly abbreviated as VRHE), while the negative potential reduced to -0.33 VRHE in the high concentration of bicarbonate solution. Production of H2 and CH4 increased with an increased concentration of electrolyte (KHCO3). CH4 production efficiency was high at low negative potential whereas HCOOH was not influenced by bicarbonate concentration. Our study provides insights into efficient, economically viable, and sustainable methods of mitigating the harmful environmental effects of CO2 emission.
Keywords: CuO nanowire, electrolyte concentration, CH4, faradaic efficiency
1. Introduction
Anthropogenic CO2 emission is a growing environmen- tal threat due to the excessive consumption of fossil fuels and traditional energy resources.1) Therefore, mitigating the harmful environmental effects of CO2 emission is one of today’s most important goals. Current mitigation approaches include recycling of CO2, capture, and storage of CO2, catalytic conversion of CO2 to value-added prod- ucts. Catalytic conversion of CO2 is a hugely attractive strategy from the perspective of environmental protection, economical value, and sustainable manufacturing. While photoelectrochemical (PEC) and electrochemical (EC) is the most widely used catalytic methods, electrochemical reduction of CO2 is more appealing due to its commercial viability. Recently, novel metals and metal oxides such as Ag, Au, Pd, Pt and, ZnO have been found to play an important role in enhancing the rate and efficiency of elec- trochemical reduction of CO2, with high selectivity for CO production and reduced production of HCOOH.2-5) How-
ever, their application is limited by uneconomical material cost and low earth abundance, creating a need for electro- catalysts that are sustainable electrocatalysts with high ele- mental earth-abundance, and low toxicity.
Based on recent studies, Cu-based electrocatalysts may be a more efficient option due to their unique and dual photo electrocatalytic properties.6-9) First principle studies have revealed that the Cu element has the distinct features of binding an intermediate product and directly convert CO2 into a variety of hydrocarbons such as CO, CH4 C2H4, C2H6, and alcohols including methanol, ethanol, and n-pro- panol, etc.10-12) However, while it is has been proved to be the best catalyst, Cu performance requires improvement to achieve high efficiency and selectivity. Previous studies have reported that the catalytic activity and selectivity of Cu based catalyst was greatly influenced by the surface properties, providing a basis for manipulation of catalysis through surface engineering catalysts.13-15) Previously, the polycrystalline Cu was adapted as an electrode catalyst for CO2 RR and produced multiple hydrocarbons and alcohols
†Corresponding author E-mail: [email protected]
© 2020, The Korean Microelectronics and Packaging Society
This is an Open-Access article distributed under the terms of the Creative Commons Attribution Non-Commercial License(http://creativecommons.org/
licenses/by-nc/3.0) which permits unrestricted non-commercial use, distribution, and reproduction in any medium, provided the original work is properly cited.
with high overpotential. On the other hand, different ther- mally treated oxide-derived copper showed improved CO2
conversion efficiency in CO2 RR. Grain boundaries and open facet on Cu-based catalysts provided more active sites leading to strong binding with intermediates such as
*CO, *COOH, and *CHO. Further, based on previous studies, oxide derived Cu catalysts have higher efficiency and selectivity for the production of CO, HCOOH, CH4,
and C2 such as C2H4, C2H6, and C2H5OH at lower overpo- tential with high current density than pure metallic Cu through the suppression of hydrogen evolution reaction (HER).16,17) Additionally, the preparative parameters such as CO2 pressure during electrolysis18-20) electrolyte concen- tration,21,22) amount of cations,23,24) and pH of the electro- lyte greatly influence the efficiency of CO2 conversion and selectivity of Cu based catalyst. Studies on the pH effects on Cu polycrystalline film25-28) reported that the local pH near the interfacial region of the electrode surface greatly influenced the yield of CH4 gas. Potassium bicarbonate is widely used as an electrolyte due to its buffer capacity.
In the present study, we evaluated the influence of differ- ent concentrations of electrolyte (KHCO3) on EC CO2 RR using thermally treated CuO nanowires. Additionally, we determined the correlation between electrolyte concentra- tion (KHCO3) and the production of CH4 gas, therefore rul- ing out earlier reports indicating that the production of CH4
gas was largely influenced. The phase of copper oxide has changed to pure metallic Cu after electrochemical CO2 RR low, moderate, and high electrolyte concentrations influ- enced the surface and phase of copper oxide.
2. Materials and methods
2.1 Synthesis of Cu electrode
The ultra-pure metallic grade Cu foil (0.2mm thick, 99.9% pure metal) was used as a substrate. The Cu foil was finely polished using polishing paper, then it was cleaned using acetone, ethanol, and distilled water, respectively, for 10 minutes, and dried using N2 gas. The Cu(OH)2 nanow- ires were produced using the hydrothermal, wet chemical approach.29) The cleaned Cu foils were immersed into a solution mixture containing 0.133 M (NH4)2S2O8 and 2.667 M NaOH for 15 min. After the reaction, the Cu foils turned blue, indirectly indicating the formation of Cu(OH)2
nanowire. Afterward, the synthesized Cu(OH)2 nanowires were thermally annealed at 200°C under the air ambient for 2 hrs.
2.2 Characterization
The structural properties of copper oxide nanowire films were analyzed by Field Emission Scanning Electron Microscopy (FE-SEM, S4800, HITACHI Inc.). High-Res- olution Transmission Electron Microscopy (HR-TEM, JEOL-3010) instrument at an operating voltage of 300 kV) was used to obtain detailed information on the structural and crystalline properties. High-Angle Annular Dark-Field (HAADF) imaging and the combined Energy Dispersive using X-Ray analysis (EDX) elemental mapping were used to examine the distribution of each element. To evaluate the crystalline properties of copper oxide films, high- resolution X-ray diffraction (HR-XRD, X’ Pert PRO) instrument operating at 40 kV and 30 mA was used. Elec- trochemical Impedance Spectroscopy (EIS) of copper oxide nanowires under the different electrolyte concentra- tions were measured to estimate the cell resistance of each component. The standard potentiostat (AUTO LAB/
PGSTAT, 128N) equipped with an impedance-spectra ana- lyzer (Nova) was used to measure current flow in the open- circuit voltage, the measured frequency ranged from0.1 Hz to 10 kHz.
2.3 Electrochemical CO2 reduction reaction
Linear sweep voltammetry was measured in the different KHCO3 concentrations with the saturated CO2 gas from 0.2 VRHE to -1.1 VRHE (scan rate of 20 mV/s). Herein, the 3- electrode configuration composed of CuO nanowire, 3 M NaCl saturated Ag/AgCl,30) and Pt nanowire electrodes as working, reference, and counter electrodes, respectively, were used for the EC CO2 RR. The potential of a 3 M NaCl saturated Ag/AgCl electrode (0.201 V vs. normal hydrogen electrode, NHE) was converted to a reversible hydrogen electrode (RHE). The potential described in this paper refers to RHE which is related to the saturated Ag/
AgCl electrode and electrolyte pH with the following equa- tion (1):
VRHE = VAg/AgCl + 0.201 + 0.059*pH (1)
The H-type cell used for electrolysis was divided into two compartments by the Nafion 117 proton exchange membrane; working and counter compartment. The EC CO2 RR was performed with different concentrations of KHCO3 electrolyte, 0.1 M, 0.5 M, and 1 M, at a constant applied current of 5 mA, and potential was measured. The cathodic compartment was purged using CO2 gas for 30 min. Electrolysis continued for 45 min. The amount of gas that was produced was measured using gas chromatogra- phy (GC-YL65000) and the amount of liquid product pro-
duced was measured using HPLC (Agilent1260 infinity II).
The resulting products were calculated using the given for- mula (2):
FE (%) = y × n × F/Q × 100 (2)
Where y is the number of electrons to complete reaction, n is the produced mole of products, F is the Faraday con- stant (96485 C/mol) and Q is the recorded charge amount.
3. Result and Discussion
Fig. 1 shows the FE-SEM and HR-TEM images of the Cu(OH)2 and CuO nanowires surface morphology. As shown in Fig. 1(a), the Cu(OH)2 nanowires formed uni- formly and randomly on Cu foil. The Cu(OH)2 nanowires are tangled together and their length is approximately 2 µm. The enlarged view Fig. 1(b) shows a single spike of the nanowire with a sharp needle-shaped tip, and a diame- ter of approximately 250 to 260 nm. After air-annealing CuO nanowires showed slight modification of surface mor- phology; increased roughness, and a shortened twisted tip with a diameter of 134-140 nm, as depicted in Figures (c) and (d).
As shown in Fig. 1(e), in the dark-field HR-TEM CuO nanowire image, the nanorods are solid, stretched with slightly rough spots. The EDS mapping of the correspond- ing nanowire showed the amount of abundant Cu and O elements, and the uniform distribution of Cu and O ele- ments through the entire CuO nanowire.
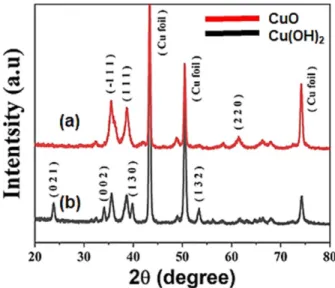
Fig. 2, shows XRD measurements, the remarkably high crystalline peaks denoting at the diffraction angle of 43.24o, 50.40o, and 74.10o were observed with Cu foil sub-
strate. High crystalline peaks of 23.83o, 34.08o, 39.79o, and 53.38o were also observed, during the formation of orthor- hombic Cu(OH)2 phase correspond to (JCPDS-01-072- 0140).31) After short-time annealing of Cu(OH)2 film, images of the resulting CuO nanowire film showed the dis- appearance of some peaks, while other peaks were formed on the additional oxides at the diffraction angle of 32.47o and 38.68o.32) These peaks confirm the formation of the monoclinic CuO phase relate to (JCPDS file 01-080-1916).
The fewer intense cubic phases of Cu2O (111) at 36.52oC were observed, which agreed to (JCPDS file 01-078-2076).
However, the peaks on the binary copper oxides were not detected in these films.
For the electrochemical analysis of CuO nanowire for EC CO2 RR, the LSV curves for three different concentra-
Fig. 1. (a) Cu(OH)2 nanowires on Cu foil,(b) the enlarged view of Cu(OH)2 nanowires,(c) CuO nanowires, (d) the enlarged view of CuO nanowires, (e) Dark-field HR-TEM image of CuO nanowire and (f) EDS mapping image of CuO nanowire including the atomic percentage of Cu and O elements.
Fig. 2. XRD patterns of (a) Cu(OH)2 and (b) CuO nanowires on Cu foil.
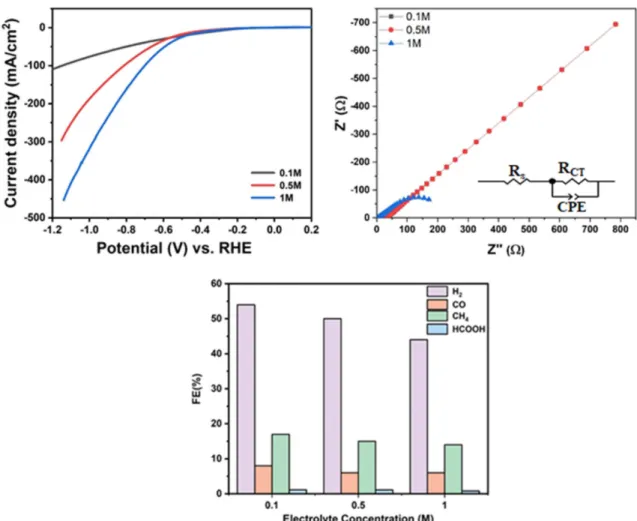
tions of KHCO3 electrolyte (from 0.1 M, 0.5 M, and 1 M) were obtained. Before taking the measurement, the electro- lyte was saturated with CO2 gas for at least 30 min. The LSV curves obtained in each concentration of KHCO3 are displayed in Fig. 3(a). With increased bicarbonate concen- tration, the onset potential was positively shifted from -0.6 VRHE to -0.2 VRHE, with increased current density due to more ionic conductivity. Additionally, the general overpo- tential for the electrolysis decreased from -0.72 VRHE to -0.32 VRHE with an increase in KHCO3 concentration. To confirm ionic conductivity in the different bicarbonate con- centrations, further analysis of EIS was done as shown in Fig. 3(b). Fig. 3(b) shows the Nyquist plots for different concentrations of KHCO3 electrolyte, the fitting data using the suggested equivalent circuit in which RS dedicates the series resistance, the substrate, and nanostructured elec- trode, the resistance associated with the ionic conductivity of the electrolyte, and the external contact resistance. RCT
is the electrode/electrolyte charge transfer resistance at the low-frequency arc and RSC is the charge-transfer process in bulk electrode at the high-frequency range. Calculated val-
ues were listed in Table 1. When bicarbonate concentration was increased, the ohmic resistance was abruptly reduced.
Similarly, RCT decreased in the high concentration of the KHCO3 electrolyte. These results suggest that high concen- tration KHCO3 favored charge transfer events and low ohmic resistance.
To get the final product after 30 min electrolysis, a con- stant current of 5 mA was continuously biased to the CuO nanowire film during EC CO2 RR in the different concen- trations of KHCO3. When the concentration of KHCO3 has increased the pH of electrolyte increased (pKb2(10−7.87), rel- ative to pKa2(10−9.91), given in Table 2. Overall EC activi- ties for CO2 RR were assessed and their results were plot in Fig. 3(c). For 0.1 M KHCO3 solution, the (FE) of 54 (%) Fig. 3. (a) Linear sweep voltammetry, (b) Electrochemical impedance spectroscopy, and (c) Faradaic efficiency in each concentration of
KHCO3 electrolyte.
Table 1. Summary of RS and RCT values depending on the electrolyte concentration.
Electrolyte Concentration (M) RS RCT
0.1 55 5614
0.5 22 884
1 10 303
H2, 18 (%) CH4, 8 (%) CO, and 1.13 (%) HCOOH with -0.72 VRHE, were achieved, while for 0.5 M KHCO3 solu- tion, the negative potential was reduced to -0.52 VRHE, and the (FE) was 50(%) H2, 15 (%) CH4, 7 (%) CO, and 1.12 (%) HCOOH. For 1 M KHCO3 solution, the (FE) of 44 (%) H2, 13(%) CH4, 5 (%) CO, and 0.80 (%) HCOOH was achieved with a very low negative potential -0.33 of VRHE. Liquid HCOOH was obtained with nominal efficiency in all the KHCO3 concentrations in HPLC analysis. Based on these results, a high concentration of bicarbonate solution enhanced EC CO2 RR to a greater extent with a low over- potential, whereas the (FE) of H2, CO, and CH4 gas is rel- atively lowered. However, the FE of HCOOH was not influenced by the concentration of electrolyte and there were no C2 products. Herein, to understand the effects of different concentrations of KCHO3 electrolyte on EC CO2
RR, the CuO nanowire electrode was developed and eval-
uated. Our results indicated that at constant applied current (5mA) increased bicarbonate concentration led to reduced overpotential. At 1 M KHCO3 concentration, the CO2
reduction reaction at -0.33 VRHE yielded H2 (44%) and CH4
(14%) at a low negative potential, this could be attributed to the high ionic conductivity of the electrolyte, already confirmed in EIS analysis.
As per Hori et al.33,34) the HER or CO2RR rate is closely related to the proton concentration, and the proton activity is directly proportional to the formation rate of H2 and CH4
(1). Gupta et al.26) report that the buffer capacity of electro- lyte and bulk pH increases with an increase in salt concen- tration. Higher buffer capacity suppresses the change of local pH near the interfacial region, critically influencing the catalytic activity of the electrode. The formation of methane depends on the electrolyte pH, therefore, increas- ing the concentration of bicarbonate which is more basic, increases the production rate of CH4. On the other hand, the formation of ethylene is not dependent on the pH of the electrolyte. According to Strasser et al.27) a high concentra- tion of KHCO3 electrolyte has a high buffer capacity, deducing to the enhanced catalytic activity of Cu electrode with more efficient products which led to the increased number of electrons/protons, subsequently producing H2
and CH4. Table 2. Listed electrolyte concentration, pH, potential (VRHE),
and FE (%) of product.
Electrolyte
Concentration(M) pH Potential (VRHE)
FE (%)
H2 CO CH4 HCOOH
0.1M 6.8 -0.72 54 8 18 1.13
0.5M 7.6 -0.52 50 6 15 1.12
1M 7.8 -0.33 44 6 14 0.80
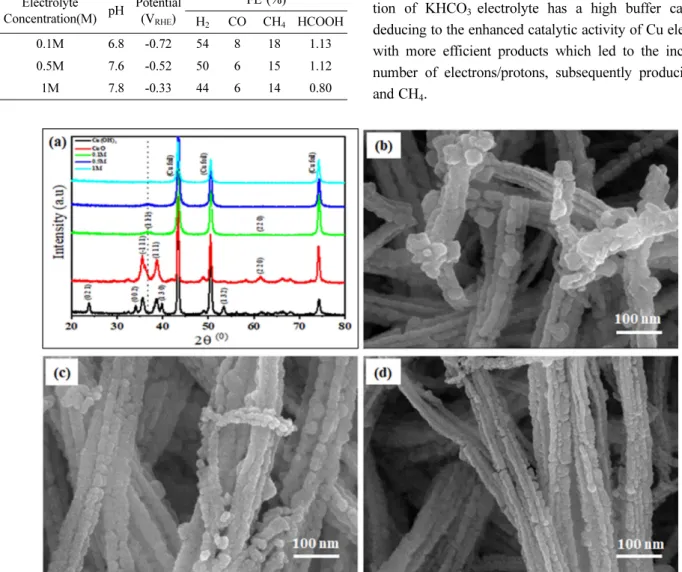
Fig. 4. XRD patterns of (a) After electroreduction test, (b) After electrochemical CO2 RR test in 0.1 M, (c) 0.5 M and (d) 1 M KHCO3 Concentration.
Herewith we characterized the crystalline and structure analysis of air annealing CuO nanowire catalysts. After 45 min of electrolysis at applied 5 mA applied current in dif- ferent bicarbonate electrolyte concentration. In Fig. 4(a), we can see that after electrochemical CO2 RR in three dif- ferent concentration XRD patterns analyzed the phase of copper oxide has changed. At low concentration 0.1 M KHCO3, small intense peak (1 1 1) plane at 36.46o indi- cates the cubic phase of Cu2O correspond to (JCPDS file- 01-078-2076). This peak slightly reduces at 0.5 M KHCO3
concentration of electrolyte. In the case of 1 M, the KHCO3 bicarbonate concentration Cu2O phase converted into pure metallic Cu phase. It is clear that due to the dif- ferent concentrations of electrolytes, the copper oxide phase changed. Using analysis of SEM image, it shows detailed changes in the structure after electrochemical CO2
RR test. Fig. 4(b) shows the morphology of nanowire after reduction in 0.1 M KHCO3 electrolyte. The surface of the nanowire has changed as shown in Fig. 1(d), which may be due to surface oxides reduction.6,35) On the surface of the nanowire exist large spherical nanoparticles broader in size. The small particle size over the surface of nanowire Fig. 4(a) slightly reduced in 0.5 M KHCO3 electrolyte solution shown in Fig. 4(c). In 1 M KCHO3 electrolyte solution those nanoparticles completely reduce and rough surface nanowire observed Fig. 4(d) may be due to more active sites and high ionic conductivity the major oxygen loss from surface reduce copper oxide to metallic Cu which correspond to XRD analysis.
4. Conclusion
In this study, we investigated the effect of different con- centrations of KCHO3 electrolyte (0.1 M, 0.5 M, and 1 M) on the EC CO2 RR using a CuO nanowire electrode. With low bicarbonate concentration, there was high overpoten- tial due to low conductivity, while with high bicarbonate concentration, the pH of electrolyte steadily increased sub- sequently increasing the buffer capacity. At a constant cur- rent of (5 mA), the CuO nanowire electrode produced H2, CO, and CH4 as well as HCOOH in varying efficiency; low concentration of bicarbonate favored the production of CO and CH4. With bicarbonate solution, FE was almost equal to low concentrate bicarbonate solution but with low nega- tive potential -0.33 VRHE. Furthermore, based on HPLC analysis, HCOOH yielded was almost negligible with a low FE value (~ 1% FE) in all the KCHO3 concentrations.
After CO2 RR with different electrolyte concentrations, the phase of copper oxide has changed to pure metallic Cu.
Our study provides insights into methods of enhancing efficiency and selectivity of Cu-based EC CO2RR catalyst and therefore efficient, economically viable, and sustain- able methods of mitigating the harmful environmental effects of CO2 emission.
Acknowledgement
This work was supported by the Priority Research Cen- ters Program through the National Research Foundation of Korea (NRF), funded by the Ministry of Education, Sci- ence and Technology (2018R1A6A1A03024334).
References
1. S. Shin, S. Kim, S. Jang, and J. Kim, “A Comparison Study on Quantum Dots Light Emitting Diodes Using SnO2 and TiO2 Nanoparticles as Solution Processed Double Electron Transport Layers”, J. Microelectron. Packag. Soc., 27(3), 69 (2020).
2. C. Kim, T. Eom, M. S. Jee, H. Jung, H. Kim, B. K. Min, and Y. J. Hwang, “Insight into Electrochemical CO2 Reduction on Surface-Molecule-Mediated Ag Nanoparticles”, ACS Catal., 7, 779 (2017).
3. D. Gao, H. Zhou, F. Cai, J. Wang, G. Wang, and X. Bao, “Pd- Containing Nanostructures for Electrochemical CO2 Reduc- tion Reaction”, ACS Catal., 8, 1510 (2018).
4. F. Quan, D. Zhong, H. Song, F. Jia, and L. Zhang, “A highly efficient zinc catalyst for selective electroreduction of carbon dioxide in aqueous NaCl solution”, J. Mater. Chem. A., 3, 16409 (2015).
5. S. Mezzavilla, S. Horch, I. E. L. Stephens, B. Seger, and I.
Chorkendorff, “Structure Sensitivity in the Electrocatalytic Reduction of CO2 with Gold Catalysts”, Angew. Chem. Int.
Ed., 58, 3774 (2019).
6. S. Y. Lee, H. Jung, N. K. Kim, H. S. Oh, B. K. Min, and Y.
J. Hwang, “Mixed Copper States in Anodized Cu Electrocat- alyst for Stable and Selective Ethylene Production from CO2 Reduction”, J. Am. Chem. Soc., 140, 8681 (2018).
7. Q. Tang, Y. Lee, D. Y. Li, W. Choi, C. W. Liu, D. Lee, and D. E. Jiang, “Lattice-Hydride Mechanism in Electrocatalytic CO2 Reduction by Structurally Precise Copper-Hydride Nano- clusters”, J. Am. Chem. Soc., 139, 9728 (2017).
8. J. Zhao, J. Zhao, F. Li, and Z. Chen, “Copper dimer supported on a C2N layer as an efficient electrocatalyst for CO2 reduc- tion reaction: A computational study”, J. Phys. Chem. C., 122, 19712 (2018).
9. S. Neatu, J. A. Maciá-Agullò, P. Concepciòn, and H. Garcia,
“Gold-copper nanoalloys supported on TiO2 as photocatalysts for CO2 reduction by water”, J. Am. Chem. Soc., 136, 15969 (2014).
10. D. Raciti and C. Wang, “Recent Advances in CO2 Reduction Electrocatalysis on Copper”, ACS Energy Lett., 3, 1545 (2018).
11. J. D. Goodpaster, A. T. Bell, and M. Head-Gordon, “Identi- fication of Possible Pathways for C-C Bond Formation during Electrochemical Reduction of CO2: New Theoretical Insights from an Improved Electrochemical Model”, J. Phys. Chem.
Lett., 7, 1471 (2016).
12. H. Xiao, T. Cheng, and W. A. Goddard, “Atomistic Mecha- nisms Underlying Selectivities in C1 and C2 Products from Electrochemical Reduction of CO on Cu(111)”, J. Am. Chem.
Soc., 139, 130 (2017).
13. I. Takahashi, O. Koga, N. Hoshi, and Y. Hori, “Electrochem- ical reduction of CO2 at copper single crystal Cu(S)- [n(111)×(111)] and Cu(S)-[n(110)×(100)] electrodes”, J. Elec- troanal. Chem., 533, 135 (2002).
14. Y. B. Shin, Y. H. Ju, and J. W. Kim, “Technical Trends of Metal Nanowire-Based Electrode”, J. Microelectron. Packag.
Soc., 26(4), 15 (2019).
15. T. Yoshioka, H. Matsushima, and M. Ueda, “In situ observa- tion of Cu electrodeposition and dissolution on Au(100) by high-speed atomic force microscopy”, Electrochem. Com- mun., 92, 29 (2018).
16. L. Cao, D. Raciti, C. Li, K. J. T. Livi, P. F. Rottmann, K. J.
Hemker, T. Mueller, and C. Wang, “Mechanistic Insights for Low-Overpotential Electroreduction of CO2 to CO on Copper Nanowires”, ACS Catal., 7, 8578 (2017).
17. D. Raciti, L. Cao, K. J. T. Livi, P. F. Rottmann, X. Tang, C.
Li, Z. Hicks, K. H. Bowen, K. J. Hemker, T. Mueller, and C.
Wang, “Low-Overpotential Electroreduction of Carbon Mon- oxide Using Copper Nanowires”, ACS Catal., 7, 4467 (2017).
18. G. Z. Kyriacou and A. K. Anagnostopoulos, “Influence of CO2 partial pressure and the supporting electrolyte cation on the product distribution in CO2 electroreduction”, J. Appl.
Electrochem., 23, 483 (1993).
19. K. Hara, A. Tsuneto, A. Kudo, and T. Sakata, “Electrochem- ical Reduction of CO2 on a Cu Electrode under High Pres- sure: Factors that Determine the Product Selectivity”, J.
Electrochem. Soc., 141, 2097 (1994).
20. C. F. C. Lim, D. A. Harrington, and A. T. Marshall, “Effects of mass transfer on the electrocatalytic CO2 reduction on Cu”, Electrochim. Acta., 238, 56 (2017).
21. S. E. Weitzner, S. A. Akhade, J. B. Varley, B. C. Wood, M.
Otani, S. E. Baker, and E. B. Duoss, “Toward Engineering of Solution Microenvironments for the CO2 Reduction Reaction:
Unraveling pH and Voltage Effects from a Combined Den- sity-Functional-Continuum Theory”, J. Phys. Chem. Lett., 11, 4113 (2020).
22. H. Zhong, K. Fujii, Y. Nakano, and F. Jin, “Effect of CO2 bub- bling into aqueous solutions used for electrochemical reduc- tion of CO2 for energy conversion and storage”, J. Phys.
Chem. C., 119, 55 (2015).
23. M. R. Singh, Y. Kwon, Y. Lum, J. W. Ager, and A. T. Bell,
“Hydrolysis of Electrolyte Cations Enhances the Electro- chemical Reduction of CO2 over Ag and Cu”, J. Am. Chem.
Soc., 138, 13006 (2016).
24. J. Resasco, L. D. Chen, E. Clark, C. Tsai, C. Hahn, T. F. Jara- millo, K. Chan, and A. T. Bell, “Promoter Effects of Alkali Metal Cations on the Electrochemical Reduction of Carbon Dioxide”, J. Am. Chem. Soc., 139, 11277 (2017).
25. R. Kas, R. Kortlever, H. Yilmaz, M. T. M. Koper, and G. Mul,
“Manipulating the Hydrocarbon Selectivity of Copper Nanoparticles in CO2 Electroreduction by Process Condi- tions”, ChemElectroChem, 2(3), 354 (2015).
26. N. Gupta, M. Gattrell, and B. MacDougall, “Calculation for the cathode surface concentrations in the electrochemical reduction of CO2 in KHCO3 solutions”, J. Appl. Electro- chem., 36, 161 (2006).
27. A. S. Varela, M. Kroschel, T. Reier, and P. Strasser, “Con- trolling the selectivity of CO2 electroreduction on copper: The effect of the electrolyte concentration and the importance of the local pH”, Catal. Today., 260, 8 (2016).
28. M. R. Singh, E. L. Clark, and A. T. Bell, “Effects of electro- lyte, catalyst, and membrane composition and operating con- ditions on the performance of solar-driven electrochemical reduction of carbon dioxide”, Phys. Chem. Chem. Phys., 17, 18924 (2015).
29. M. Ma, K. Djanashvili, and W. A. Smith, “Controllable Hydrocarbon Formation from the Electrochemical Reduction of CO2 over Cu Nanowire Arrays”, Angew. Chem. Int. Ed., 55, 6680 (2016).
30. S. Sen, S. M. Brown, M. L. Leonard, and F. R. Brushett,
“Electroreduction of carbon dioxide to formate at high current densities using tin and tin oxide gas diffusion electrodes”, J.
Appl. Electrochem., 49, 917 (2019).
31. G. H. Du and G. Van Tendeloo, “Cu(OH)2 nanowires, CuO nanowires, and CuO nanobelts”, Chem. Phys. Lett., 393, 64 (2004).
32. K. Sahu, B. Satpati, and S. Mohapatra, “Facile Synthesis and Phase-Dependent Catalytic Activity of Cabbage-Type Copper Oxide Nanostructures for Highly Efficient Reduction of 4- Nitrophenol”, Catal. Lett., 149, 2519 (2019).
33. Y. Hori, H. Wakebe, T. Tsukamoto, and O. Koga, “Electro- catalytic process of CO selectivity in electrochemical reduc- tion of CO2 at metal electrodes in aqueous media”, Electrochim. Acta., 39, 1833 (1994).
34. Y. Hori, “Electrochemical CO2 Reduction on Metal Elec- trodes”, pp.89-189 Modern aspects of electrochemistry, Springer, New York, NY (2008).
35. Z. Lyu, S. Zhu, M. Xie, Y. Zhang, Z. Chen, R. Chen, M. Tian, M. Chi, M. Shao, and Y. Xia, “Controlling the Surface Oxi- dation of Cu Nanowires Improves Their Catalytic Selectivity and Stability toward C2+ Products in CO2 Reduction”, Angew.
Chem., (2020).