DOI:10.5229/JKES.2010.13.2.110
− 110 −
Electrochemical Performance of Lithium Sulfur Batteries with Plasticized Polymer Electrolytes based on P(VdF-co-HFP)
Jeong Ho Park, Sang-Yeob Yeo, Jung-Ki Park
†, and Yong Min Lee*
Division of Applied Chemistry and Biotechnology, Hanbat National University, Deokmyeong-dong, Yuseong-gu, Daejeon 305-719, Republic of Korea
†
Department of Chemical and Biomolecular Engineering, Korea Advanced Institute of Science Engineering, 373-1 Guseong-dong, Yuseong-gu, Daejeon 305-701, Republic of Korea
(Received March 15, 2010 : Accepted March 29, 2010)
Abstract : The plasticized polymer electrolytes based on polyvinylidene fluoride-co-hexafluo- ropropylene (P(VdF-co-HFP)), tetra (ethylene glycol) dimethyl ether (TEGDME), and lithium perchlorate (LiClO
4) are prepared for the lithium sulfur batteries by solution casting with a doc- tor-blade. The polymer electrolyte with EO : Li ratio of 16 : 1 shows the maximum ionic con- ductivity, 6.5 × 10
−4S/cm at room temperature. To understand the effect of the salt concentration on the electrochemical performance, the polymer electrolytes are characterized using electro- chemical impedance spectroscopy (EIS), infrared spectroscopy (IR), viscometer, and differential scanning calorimeter (DSC). The optimum concentration and mobility of the charge carriers could lead to enhance the utilization of sulfur active materials and the cyclability of the Li/S unit cell.
Keywords : Lithium sulfur batteries, Plasticized polymer electrolytes, P (VdF-co-HFP), Tetra (eth- ylene glycol) dimethyl ether, Salt concentration, Charge-discharge
1. Introduction
Sulfur is a very attractive cathode material for rechargeable lithium batteries, because of its high theoreti- cal specific capacity of 1675 mAh/g, high theoretical energy density of 2600 Wh/kg, low cost, and good safety.
However, there are many problems to put the Li/S bat- tery to practical use. First of all, the Li/S battery with a 100% sulfur positive electrode is impossible due to its very low electronic conductivity. It means that excessive conducting materials such as conductive carbon blacks should be included in the cathode, thereby resulting in the decrease of battery capacity and energy. The second problem is that polysulfides (S
n2−), intermediate reduced product of sulfur (S
8) during discharge, can escape from the cathode and move to the Li anode.
1)Especially, the Li/S batteries with the liquid electrolyte have faced this problem more seriously. In addition, the dendritic lithium formation by the reductive decomposition of liquid elec- trolytes on the lithium electrode becomes more serious
when liquid electrolytes are used.
2-5)Therefore, the polymer electrolyte is a good alternative for the Li/S battery. The Li/S batteries with solid polymer electrolytes based on poly(ethylene oxide) (PEO) have been studied.
6,7)However, it is hard to operate the Li/S battery with PEO-based polymer electrolyte at room temperature, because PEO is highly crystalline polymer (T
m= 65
oC). Therefore plasticized polymer electrolytes with higher room-temperature ionic conductivity of
~10
-3S/cm can be a good candidate.
8,9)In this work, plasticized polymer electrolytes based on P(VdF-co-HFP) and sulfur cathodes consisting of elemental sulfur, conductive carbon black, and P(VdF- co-HFP) as a binder,
10)are prepared for Li/S batteries.
The effects of salt concentration on the ionic conduc- tivity of plasticized polymer electrolyte and the cycle performance are investigated.
2. Experimental
2.1. Preparation of polymer electrolyte
A copolymer of vinylidene fluoride and hexafluo-
*E-mail: [email protected]
ropropylene (P(VdF-co-HFP), Kynar 2801, Arkema) is dried under vacuum at 80
oC for 24 h. Tetra (ethyl- englycol) dimethyl ether (TEGDME, Aldrich) as a plasticizer and lithium perchlorate (99.99% LiClO
4, Aldrich) as a lithium salt are used as received. The P (VdF-co-HFP) is first dissolved in acetone (HPLC grade, Merck). After the polymer is completely dissolved, the liquid electrolyte with a different EO : Li ratio (8 : 1, 16 : 1, 32 : 1) is added into the polymer solution and the mixed solution is further stirred. The amount of liquid electrolyte is 300 wt% based on the matrix polymer, which is enough to keep the mechanical strength of polymer electrolyte. After complete homogenization of the mixture is achieved, the resulting viscous solution is cast on a Mylar film with a doctor-blade and allowed to dry in glove box at room temperature. The dried films are then removed from the Mylar film and used to assem- ble the cells. The thickness of the films is 140 ± 10 µm.
All the preparation proceeded in a glove box purged with argon.
2.2. Characterization of electrolytes
The liquid electrolytes with different EO : Li ratios are cast onto the silicon wafer for FT-IR measurement.
The FT-IR spectra are recorded in the absorption mode on a Bomem-MB 100 FT-IR spectrometer covering a range from 400 to 4000 cm
-1. The resolution for all spectra is 4 cm
-1.
The viscosities of liquid electrolytes with a different EO : Li ratio are measured using an advanced rheomet- ric expansion system in cone and plate geometry. The shear rate is changed over a range of 5 s
−1to 300 s
−1. All measurements are conducted at 20
oC.
Differential scanning calorimeter (DSC) studies are carried out to observe the thermal behavior of the plas- ticized polymer electrolytes and their components using a DuPont TA 2000 instrument. Each sample is loaded in hermetically sealed aluminum pans and scanned at a heating rate of 10
oC min
−1over a temperature range of
−120
oC to 150
oC under nitrogen atmosphere.
Polymer electrolyte films are sandwiched between the two stainless steel (SS) electrodes to measure ionic conductivities. The ionic conductivities of the polymer electrolytes are obtained from bulk resistance measured by a.c. complex impedance analysis using a Solartron 1255 frequency response analyzer (FRA) in combina- tion with a Solartron 1287 electrochemical interface over frequency range of 0.01 Hz~1 MHz under ampli- tude of 10 mV.
2.3. Preparation of cathode
A sulfur (99.98%, Aldrich) and Super-P (TIMCAL) as a conductive carbon black are dried at 80
oC for 24 h and at 150
oC for 24 h under vacuum, respectively. The mixture of sulfur and Super-P is ball-milled, and then P(VdF-co-HFP) solution dissolved in acetone is added to the powder mixture. After mixing the cathode slurry for 2 days, it is cast on glass plate and dried in air at room temperature. These cathodes are laminated with mesh-type aluminum current collectors at 150
oC. The prepared cathode has the composition of 50 wt% sulfur, 20 wt% Super-P, and 30 wt% P (VdF-co-HFP). The loading density of sulfur is 2.0 mg/cm
2.
2.4. Cell assembly and electrochemical measure- ment
The manufactured cathode is immersed into the liquid electrolytes before the cell assembly. The Li/S unit cell is prepared by stacking the plasticized polymer electro- lyte between sulfur cathode and metallic Li anode. The cells with 2 × 2 cm
2are finally packaged in an alumi- nized polyethylene bag. The unit cell is typically cycled between 1.5 and 3.2 V at a constant current density (0.17 mA/cm
2) at room temperature using a TOSCAT-3000U (Toyo System Co., Ltd.).
The impedance of the unit cell is measured using a Solartron 1255 frequency response analyzer (FRA) in combination with a Solartron 1287 electrochemical interface over frequency range of 0.01 Hz~1 MHz under amplitude of 10 mV to obtain the information at the interface between polymer electrolytes and electrodes.
The cyclic voltammetry experiment is carried out on a sulfur cathode as a working electrode with a lithium electrode as counter and reference electrodes in the potential range of 1.0 to 4.0 V vs. Li at a scanning rate of 1 mV/s.
3. Results and Discussion
3.1. Ionic conductivities of plasticized polymer electrolytes
Fig. 1 shows the ionic conductivities of the plasticized polymer electrolytes based on the P (VdF-co-HFP) with a different salt concentration as a function of tem- perature. From the slope in Fig. 1, the activation ener- gies of the plasticized polymer electrolytes are calculated and summarized in Table 1. Higher salt concentration in the polymer electrolyte leads to higher activation energies.
This means that the ionic motion is not significantly
influenced by the segmental motions of the polymer matrix at lower salt concentration. The maximum ionic conductivity at room temperature, 6.5 × 10
−4S/cm, occurs when EO : Li ratio is 16 : 1 (1.09 M). This behavior can be ascribed to the number of charge carriers and their mobility.
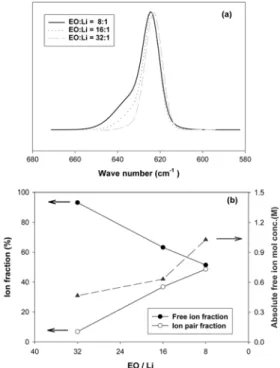
11)Fig. 2(a) shows the FT-IR spectra for liquid electrolytes with different salt concentrations. The relative fraction of free ions could be calculated by resolving FT-IR peak (600~660 cm
−1) into the ones corresponding to the free ClO
4−anions (625 cm
−1) and the LiClO
4ion pairs (632 cm
−1). The relative fraction of the free ions in the liquid electrolyte is reduced with the increase of the salt concentration as shown in Fig. 2(b). These results indicate that the amount of TEGDME is not sufficient to dissociate lithium salts at high salt concentration. On the contrary, the concentration of absolute free ions for the liquid electrolyte reaches to the highest value at EO : Li ratio of 8 : 1 (2.07 M). Although the polymer electrolyte with EO : Li ratio of 8 : 1 has the highest concentration of charge carriers, its ionic conductivity shows the lowest at room temperature as shown in Fig. 1. The major cause of this difference in the ionic conductivities seems to be strongly related to not the number of charge carriers but the mobility of charge carriers. The mobility of charge carriers in the plasticized polymer electrolytes can be
explained by the viscosity and the glass transition temperature of an ionic conduction phase.
Fig. 3 shows the viscosity change of the liquid electro- lytes with different salt concentrations as a function of shear rate, and the average viscosity values are sum- marized in Table 1. The glass transition temperatures (T
g) of the polymer electrolytes measured by differential scanning calorimeter are shown in Fig. 4(a). From both viscosity and glass transition temperature, it is found that the mobility of lithium ions in the liquid and polymer
Fig. 1. Ionic conductivities of polymer electrolytes with adifferent EO : Li ratio as a function of temperature.
Table 1. Activation energies and viscosities of liquid elec- trolytesa, and glass transition temperatures of plasticized polymer electrolytesb as a function of EO : Li ratio
EO : Li ratio Mol. conc.
(M) Ea
(KJ/mol) Viscosity (mPa s) Tg
(oC)
08 : 1 2.07 16.5 42.2
−
58.516 : 1 1.09 13.3 9.46
−
74.632 : 1 0.56 11.1 4.47
−
84.1a: TEGDME/LiClO4; b: P(VdF-co-HFP)/TEGDME/LiClO4
Fig. 2. (a) FT-IR spectra for free lithium ion fraction in liquid electrolytes with different EO : Li ratio (b) Charge carrier con- centration in liquid electrolytes as a function of EO : Li ratio.
Fig. 3. Viscosities of liquid electrolytes with a different EO : Li ratio.
electrolyte is greatly suppressed at EO : Li ratio of 8 : 1.
The higher salt concentration not only produces a great number of free ions but also reduces the mobility of free ions due to the decrease of fraction of free TEGDME in the plasticized polymer electrolyte. Therefore, the room- temperature ionic conductivities of the polymer elec- trolyte shows the maximum at EO : Li ratio of 16 : 1 as shown in Fig. 1. In addition, the ionic conductivities of the polymer electrolytes based on P (VdF-co-HFP)/
TEGDME/LiClO
4are more dependent on the number of charge carriers at high temperature and on the mobility of charge carriers at low temperature.
Fig. 4(b) shows the thermal behavior of TEGDME, TEGDME/LiClO
4, and P (VdF-co-HFP)/TEGDME/
LiClO
4. When the liquid electrolyte (TEGDME/LiClO
4) with EO : Li ratio of 16 : 1 is added into P (VdF-co-HFP) matrix, most of crystalline region of liquid electrolyte becomes amorphous, which means that the liquid electro- lyte is sufficiently compatible with the polymer matrix.
3.2. Charge-discharge performance
The Li/S unit cells based on polymer electrolytes with different EO : Li ratios will be written as 321 cell, 161 cell, and 081 cell for the sake of simplicity hereafter.
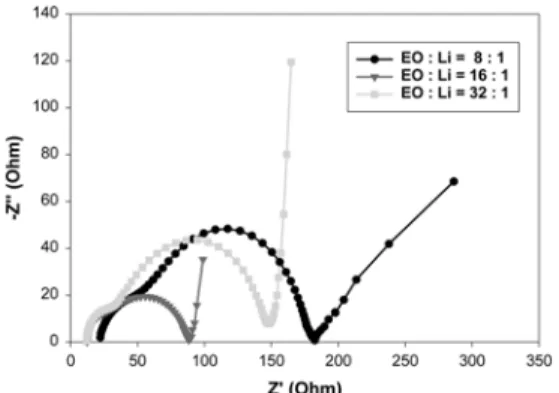
Fig. 5 shows initial a.c. impedance spectra of the Li/
polymer electrolyte/S unit cells at room temperature. As is well expected from the ionic conductivity, the 161 cell shows the lowest bulk and interfacial resistances.
Although the ion conductivity of the 321 cell is similar to the 161 cell, its interfacial resistance is twice higher than the 161 cell due probably to deficient lithium ion number. On the contrary, the highest bulk and interfacial resistances of the 081 cell are ascribed to its high viscosity. Even though there are sufficient lithium ions near electrode active materials, they cannot move to the electrode surface at a proper rate owing to the strong interaction between lithium ions and other components such as organic solvents, polymer chains, and anions.
As shown in Fig. 6, the 161 cell exhibits the highest
Fig. 4. DSC thermograms for (a) polymer electrolytes (poly- mer matrix/liquid electrolyte, 1/3(w/w)) with a different EO : Li ratio (b) TEGDME, liquid electroyte, and polymer electrolyte with 16 : 1 EO : Li ratio.
Fig. 6. Initial charge-discharge profiles for Li/polymer elect- rolyte/S unit cell at a constant current density of 0.17 mA/cm2 (C/10) and 20oC.
Fig. 5. Initial a.c. impedance spectra of Li/polymer electrolyte/
S unit cell as a function of EO : Li ratio.
discharge capacity of 563 mAh/g-cathode, which is much higher than the conventional cathode material.
The discharge capacities of the 321 and the 081 cells are 430 mAh/g-cathode and 177 mAh/g-cathode, respec- tively. Two distinct plateaus at 2.4 V and 2.0 V are clearly observed except for the 081 cell. The first plateau at about 2.4 V corresponds to the reduction from elemental sulfur to polysulfide (Li
2S
n), and the second one at 2.0 V is ascribed to the reduction from polysulfide to Li
2S.
12)In particular, polysulfide, the intermediate material, can be dissolved into the electrolyte. As the concentration of polysulfides increases, the diffusion of lithium ions to the cathode is retarded by the viscosity increase of ion conduction phase. The poor performance of the 081 cell without voltage plateau at 2.0 V during discharge may be explained by its high viscosity. Therefore, on the contrary to the conventional lithium secondary batteries, to find an optimum viscosity is more important in the Li/S battery.
The 161 and the 321 cells also show the two plateaus during charge process. It is thought that the first plateau at 2.3 V and second plateau at 2.5 V correspond to the oxidations from Li
2S to polysulfide and from polysulfide to elemental sulfur, respectively. In addition, the small dip during discharge and the small peak during charge are observed, which are related to the nucleation of crystalline lithium sulfide phases, Li
2S
2or Li
2S.
7)On the other hand, the 081 cell shows the only plateau at 2.5 V during the charge process. In addition, the 161 cell is not charged to 3.2 V due to charge time cut-off condition to suppress overcharge phenomena in Li/S cells.
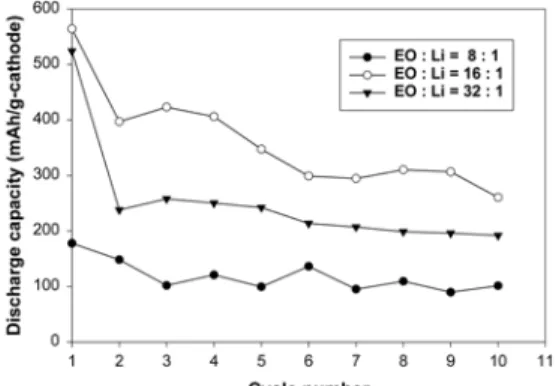
Fig. 7 presents the cycle performance of unit cells during 10 cycles. The better capacity retention of the 161 cell can be easily expected according to its lowest
total resistance. However, it is found that the discharge capacity at the second cycle is remarkably decreased comparing to the other cycles. It may be explained by the loss of sulfur out of cathode due to the formation of soluble polysulfide. Especially, when the viscosity of the electrolyte is low like the 321 cell, severe capacity decrease is observed. It also supports that the polysulfide can be dissolved into electrolyte and its content is affected by the viscosity of electrolyte.
The charge and discharge profiles of the 161 cell are shown during 50 cycles in Fig. 8. The plateaus during charge and discharge processes are gradually shortened to almost disappear at 50th cycle. In particular, the plateau at 2.4 V during the discharge is abruptly short- ened at the second cycle and gradually decreased in the subsequent cycles. To investigate the reaction mecha- nism of the Li/S cell further, the cyclic voltammetry is investigated on the 161 cell with a scan rate of 1 mV/s (Fig. 9). On sweeping the unit cell cathodically, three peaks are observed at around 2.30 V, 2.00 V, and
Fig. 7. Specific discharge capacities of the Li/polymer electrolyte/S unit cell during 10 cycles.
Fig. 8. Charge and discharge profiles for the 161 cell at a constant current density of 0.17 mA/cm2 (C/10) and 20 oC.
Fig. 9. Cyclic voltammograms of the Li/polymer electrolyte/S (the 161 cell) at 20 oC with a scan rate of 1 mV/s.