762
Copyright © 2017 The Korean Society of Fisheries and Aquatic Science pISSN:0374-8111, eISSN:2287-8815
서 론
쏘가리
(Siniperca scherzeri)
는내수면품종중기호도가매우 높은식용어류의하나로써,
자연자원증대를위하여꾸준히치 어방류사업을하여자원량을증대시키려고노력하는어종으 로소비자의선호도가매우높고가격이비싼고급어류이다.
하지만쏘가리의어획량이소비자의요구를만족시키지못하 는실정이여서,
양식기술개발로생산량을증대시키기위한연 구가수행되고있다(Kim et al., 1988).
쏘가리는배합사료에의 한순치가매우어렵고살아있는물고기만을잡아먹는식성때 문에상품크기까지사육하기가어렵다.
쏘가리는살아있는어 류를포식하는생태적인특성이다른담수어류에비해매우강 하여움직임이없는배합사료에대해서는먹이탐색반응을보 이지않아사료순치가어려워사육이까다로운어류이다.
최근 에충청북도내수면산업연구소에서쏘가리를대량으로배합사 료에순치시킬수있는기술을개발하였다(Kim, 2015).
이러한결과를바탕으로쏘가리전용사료개발을위한단백질과지질 함량에대한연구가수행되었다
(Zohreh et al., 2017).
이와더 불어쏘가리의적정사육수온(Kim and Lee, 2016)
및사료내 의어분첨가연구가수행되고있다(Kim and Lee, 2017).
향후 산업적으로쏘가리양식생산량을증대시키기위해서는사육기 술,
배합사료품질향상등에다양한연구들이계속수행되어야 할것으로판단된다.
쏘가리는다른담수어류와비교하였을때,
육식성이강하고일정한공간에영역을형성하여군집하는습 성이있어적정사육밀도의규명은필요한사육기반연구중의 하나이다.
더불어쏘가리의최대성장을위한적정사육수온이26-29℃
를임을감안한다면(Kim and Lee, 2016),
고수온에순 환여과시스템을활용하여고밀도로사육하는것이경제적이므 로,
쏘가리양식시에적정사육밀도의규명은앞으로양식생산 성과경제성확보에중요한과제이다.
어류의적정성장과사료효율을유도하고
,
양식생산에소요되 는비용을절감하기위해서는수온,
염분,
수질요인등의외적사육밀도에 따른 쏘가리( Siniperca scherzeri)의 성장 및 체조성 변화
이상민
1∙ 김이오
2*
1강릉원주대학교 해양생물공학과, 2충청북도내수면산업연구소
Effect of Stocking Density on the Growth and Body Composition of the Mandarin Fish Siniperca scherzeri
Sang-Min Lee and Yi-Oh Kim1*
Department of Marine Biotechnology, Gangneung-Wonju National University, Gangneung 25457, Korea
1Chungcheongbuk-do Inland Fisheries Research Institute, Chungju 27329, Korea
This study investigated the effects of stocking density on the growth of the mandarin fish Siniperca scherzeri , in small (1-year old, 50.2 g/fish) and large (2-years old, 173.1 g/fish) size (age) groups. Small and large fish groups were fed pelleted diets twice daily for 10 and 15 weeks, respectively. In the small group, at the end of the feeding, the weight gain of fish at a density of 4 kg/m
3was lower than that of fish at densities of 3, 2 and 1 kg/m
3. However, fish stocking density did not affect feed efficiency. The daily feed intake of fish at a density of 4 kg/m
3was lower than that fish at densities of 3, 2 and 1 kg/m
3. In the large fish group, the weight gain of fish at a density of 4.5 kg/m
3was higher than that of fish at densities of 6, 3 and 1.5 kg /m
3. Again, fish stocking density did not affect feed efficiency. The daily feed intake of fish at a density of 4.5 kg/m
3was higher than that of fish at densities of 6, 3 and 1.5 kg/m
3. Based on these results, the optimum stocking density for small (50.2 g/fish) and large (173.1 g/fish) mandarin fish is 3 and 4.5 kg/m
3, respectively.
Key words: Mandarin fish, Siniperca scherzeri , Fish size, Stocking density, Growth
This is an Open Access article distributed under the terms of the Creative Commons Attribution Non-Commercial Licens (http://creativecommons.org/licenses/by-nc/3.0/) which permits unrestricted non-commercial use, distribution, and reproduction in any medium, provided the original work is properly cited.
https://doi.org/10.5657/KFAS.2017.0762
Korean J Fish Aquat Sci 50(6) 762-769, December 2017
Received 21 November 2017; Revised 19 December 2017; Accepted 23 December 2017
*Corresponding author: Tel: +82. 43. 220. 6522 Fax: +82. 43. 220. 6529
E-mail address: [email protected]
요인과먹이조건
,
사육밀도와같은생물학적요인이고려되어 야한다(Choi et al, 2011).
이들조건중사육밀도는개체들간 의먹이경쟁과공간경쟁을유발시켜성장에영향을미치는요 소(Brett, 1979)
로비용절감과성장에영향을미치기때문에다 양한어종에서검토되어왔다.
일반적으로는사육밀도가높아 짐에따라성장이낮아지고폐사율이높아지는현상은여러어 종에서일어나는일반적인현상이다(Brown et al., 1957; Mor- rissy, 1992; McClain, 1995; Hwang et al., 2014).
하지만어 류의성장이사육밀도에영향을받지않는다는결과도보고된 바있어(Boyce et al., 1998; Irwin et al., 1999; Rowland et al., 2006; Webb et al., 2007),
사육밀도의범위나조건에대한고려 가필요하다.
따라서,
어종마다서식환경이나특성이다르기때 문에대상어종에맞는적정밀도를찾기위한연구가필요하다.
본연구는쏘가리의성장단계에따른적정사육밀도를조사 하여쏘가리양식산업화를위한기초자료를제공하고자수행 되었다.
재료 및 방법
실험어 및 사육관리
실험어는충청북도내수면산업연구소에서배합사료로순치하 여양성한
1
년생(50.2 g)
및2
년생(173.1 g)
쏘가리를각각사용 하였다.
최초실험어류는1
년생소형어를저밀도부터고밀도까 지1 kg/m
3, 2 kg/m
3, 3 kg/m
3및4 kg/m
3이되도록실험어류의 마리수를달리하여2
반복으로10
주간사육실험을실시하였으 며, 2
년생대형어는1.5 kg/m
3, 3 kg/m
3, 4.5 kg/m
3및6 kg/m
3 이되도록실험어류의마리수를조절하여2
반복으로배치하여15
주간사육하였다.
쏘가리의사육은어체크기별로각각침전조
(2,000 L) 1
개와실험조
(3,000 L) 8
개가1
세트가되도록설계한순환여과시스 템에서동일한수온(24℃)
과수질환경[pH 6.7-7.8, DO (dis- solved oxygen) 6.1-7.6]
을유지하면서실시하였다.
침전조에는깨끗한물을
18 L/min
유량으로계속보충하고여분의사육수는퇴수구를통해빠져나가도록하였다
.
또한,
침전조에수 중펌프를사용하여각각의실험수조에동일한양의물을공급 하여순환되도록하였으며,
에어스톤을설치하여충분한산소 를공급하였다.
실험사료
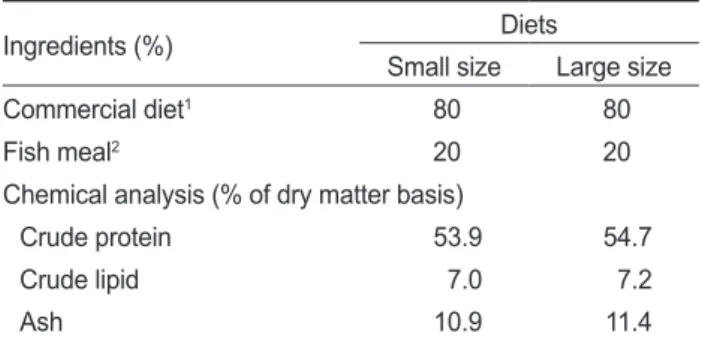
실험에사용된사료는양어가들이현장에서주로사용하는뱀
장어양성용시판분말사료
80%
에전갱이어분을20%
첨가하여실험사료를제조하였다
(Table 1).
혼합된소형어및대형어 사료각각의사료조성물에적당량의물을첨가하여다시혼합 하여사료제조기로pellet
형태로사료를성형하였다.
성형된각각의실험사료를
-25℃
냉동고에보관하면서실험어에게공급하였다
.
어체측정 및 성분분석
1
년생소형쏘가리실험은사육실험 시작시와10
주에측정하였으며
, 2
년생대형쏘가리실험은시작시와15
주에최종으 로측정하였으며,
종료시에는측정전일절식시킨후tricaine methanesulfonate (MS 222, Sigma, St. Louis, MO, USA) 100 ppm
수용액에 마취시켜 실험어의 무게를 측정하였다.
어체 의성분분석을위하여각실험수조에서5
마리씩을시료로취하여 냉동보관
(-25℃)
하였다.
실험사료 및 어체의 일반성분은
AOAC (1995)
의방법에따라조단백질(N×6.25)
은Auto Kjeldahl System (Buchi B-324/435/412, Switzerland; Me- trohm 8-719/806, Swizerland)
를사용하여분석하였고,
조지방 은ether
를사용하여추출하였으며,
수분은105℃
의dry oven
에서6
시간건조후측정하였다.
회분은600℃
회화로에서4
시 간동안태운후측정하였다.
혈액분석
실험사료공급에따른실험어의혈액성분변화를조사하기위 해각실험수조마다쏘가리
5
마리씩무작위로추출하여헤파린주사액이처리된
1 mL
주사기를사용하여실험어의미부혈관에서채혈하였다
.
채혈한혈액을7,500 rpm
에서10
분간원 심분리하여 얻은 혈장을동결보존(-70℃)
하면서 혈액분석기(DRI-CHEM NX500i, FUJIFILM, Japan)
를 사용하여total protein (TP), total cholesterol (TCHO), glutamic oxaloacetic transaminase (GOT), glutamic pyruvic transaminase (GPT), alkaline phosphatase (ALP), total bilirubin (TBIL)
및albumin (ALB)
을각각분석하였다.
통계분석
결과의통계처리는
SPSS Ver. 20 (SPSS Inc., Chicago, IL, USA) program
을사용하여One-way ANOVA-test
를실시한 후Duncan’s multiple range test (Duncan, 1955)
로평균간의 유의성을검정하였다.
Table 1. Ingredient and proximate composition of experimental diets for mandarin fish Siniperca scherzeri1
Ingredients (%) Diets
Small size Large size
Commercial diet1 80 80
Fish meal2 20 20
Chemical analysis (% of dry matter basis)
Crude protein 53.9 54.7
Crude lipid 7.0 7.2
Ash 10.9 11.4
1Commercial bind powder for eel produced from Purinafeed incor- poration (Seongnam, Korea). 2Mackeral fish meal imported from Chile containing 73% crude protein and 9% crude lipid.
결과 및 고찰
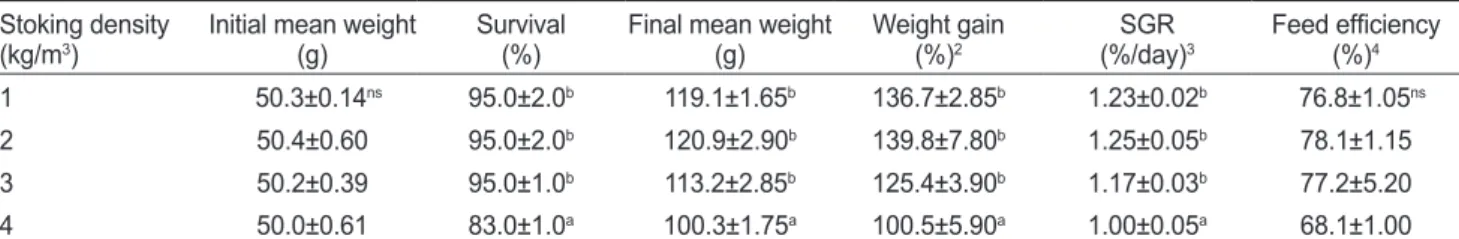
10
주간의사육실험후, 1
년생소형쏘가리의성장및사료이용성을
Table 2
와Table 3
에각각나타내었다.
사육실험기간동 안의생존율,
성장률및일간성장률은4 kg/m
3 실험구가1, 2
및
3 kg/m
3 실험구보다 유의하게낮은 결과를나타내었으나(P<0.05), 1, 2
및3 kg/m
3실험구간에는유의적인차이는나 타나지않았다(P>0.05).
사료효율은모든실험구간에유의적인 차이는나타나지않았다(P>0.05).
쏘가리의일일사료섭취율및 일일단백질섭취율에서는4 kg/m
3실험구가1, 2
및3 kg/m
3실 험구보다유의하게낮은결과를나타내었으며(P<0.05),
단백질 전환율에서는4 kg/m
3실험구가1, 2
및3 kg/m
3실험구보다높 은결과를나타내었다(P<0.05).
15
주간의사육실험후, 2
년생대형쏘가리의성장및사료이용성을
Table 4
와Table 5
에각각나타내었다.
사육실험기간동안의생존율은
94%
이상으로모든실험구간에유의적인차이는나타나지않았다
(P>0.05).
증중율및일간성장률은4.5 kg/
m
3실험구가1.5
및3 kg/m
3및6 kg/m
3실험구보다유의하게높 았다(P<0.05).
사료효율은실험구간에유의적인차이는나타나 지않았다(P>0.05).
쏘가리의일일사료섭취율및일일단백질섭 취율에서는4.5 kg/m
3실험구가1.5, 3
및6 kg/m
3실험구보다 유의하게높은결과를나타내었으며(P<0.05),
단백질전환율에 서는4.5 kg/m
3실험구가1.5
및3 kg/m
3실험구보다유의하게 낮은결과를나타내었다(P<0.05).
본실험에서쏘가리
1
년생(50.2 g)
의실험에서1-3 kg/m
3밀 도실험구에서생존율및성장에차이가없다가4 kg/m
3밀도 실험구에서생존율및성장이낮아졌다.
틸라피아(141 g)
를대상으로한
30-50
마리/m
3밀도실험구에서는생존율및성장에Table 2. Growth performance and feed efficiency of 1-year old mandarin fish Siniperca scherzeri fed experiment diet for 10 weeks1 Stoking density
(kg/m3) Initial mean weight
(g) Survival
(%) Final mean weight
(g) Weight gain
(%)2 SGR
(%/day)3 Feed efficiency (%)4
1 50.3±0.14ns 95.0±2.0b 119.1±1.65b 136.7±2.85b 1.23±0.02b 76.8±1.05ns
2 50.4±0.60 95.0±2.0b 120.9±2.90b 139.8±7.80b 1.25±0.05b 78.1±1.15
3 50.2±0.39 95.0±1.0b 113.2±2.85b 125.4±3.90b 1.17±0.03b 77.2±5.20
4 50.0±0.61 83.0±1.0a 100.3±1.75a 100.5±5.90a 1.00±0.05a 68.1±1.00
1Values (mean±SE of replicate groups) in the same column not sharing a common superscript are significantly different (P<0.05). 2Weight gain (%)=(final body weight - initial body weight)×100/initial body weight. 3SGR=(Ln final weight of fish – Ln initial weight of fish)×100/
days of feeding trial. 4Feed efficiency (%)=fish wet weight gain×100/feed intake (dry matter). ns Not significant (P>0.05).
Table 3. Daily feed intake (DFI), daily protein intake (DPI) and protein efficiency ratio (PER) of 1-year old mandarin fish Siniperca scherzeri fed experiment diet for 10 weeks1
Stoking density (kg/m3) DFI (%)2 DPI (%)3 PER(%)4
1 1.43±0.01b 0.72±0.01b 2.53±0.02a
2 1.43±0.05b 0.78±0.02b 2.55±0.07a
3 1.35±0.11b 0.74±0.06b 2.65±0.21a
4 1.04±0.05a 0.57±0.03a 3.14±0.13b
1Values (mean±SE of replicate groups) in the same column not sharing a common superscript are significantly different (P<0.05). 2Daily feed intake=feed intake×100 / [(initial fish wt.+final fish wt.+dead fish wt.)×days reared / 2]. 3Daily protein intake=protein intake×100 / [(initial fish wt.+final fish wt.+dead fish wt.)×days reared / 2]. 4Protein efficiency ratio=wet weight gain / protein intake.
Table 4. Growth performance and feed efficiency of 2-year old mandarin fish Siniperca scherzeri fed experiment diets for 15 weeks1 Stoking density
(kg/m3) Initial mean weight
(g) Survival
(%) Final mean weight
(g) Weight gain
(%)2 SGR
(%/day)3 Feed efficiency (%)4
1.5 173.1±0.39ns 94.0±2.00ns 279.8±6.20a 61.8±3.95a 0.46±0.03a 60.0±2.70ns
3 173.1±1.42 97.0±1.00 329.9±1.65b 90.6±0.50b 0.62±0.01b 62.4±1.35
4.5 173.0±0.49 97.5±1.50 368.0±3.70d 112.7±2.80c 0.72±0.01c 60.5±1.65
6 173.1±0.14 94.0±1.00 346.5±0.80c 110.1±0.35b 0.67±0.01b 60.0±2.20
1Values (mean±SE of replicate groups) in the same column not sharing a common superscript are significantly different (P<0.05). 2Weight gain (%)=(final body weight - initial body weight)×100/initial body weight. 3SGR=(Ln final weight of fish – Ln initial weight of fish)×100/
days of feeding trial. 4Feed efficiency (%)=Fish wet weight gain×100/feed intake (dry matter). ns Not significant (P>0.05).
차이가없다가
60-70
마리/m
3밀도실험구에서는생존율및성 장이낮아지는결과를보여본실험과유사한경향을나타내었 다(Yi et al., 1996).
사육밀도의증가가생존율에영향을미치 지않는다는연구결과이많이있으나(Watanabe et al., 1990;
Ahmad et al., 1999; Wallat et al., 2004),
생존율을저하시킨다 는연구결과도많이보고되어있다(Cruz and Ridha, 1991; Yi et al., 1996; Yi and Kwei Lin, 2001).
본실험결과에서도가장고밀도실험구
(4 kg/m
3)
에서생존율및성장이유의하게낮은 결과를나타내었다.
또한
,
쏘가리2
년생(173.1 g)
의실험에서1.5-4.5 kg/m
3밀도 에서는밀도가증가함에따라성장이유의하게증가하다가6 kg/m
3밀도실험구에서는4.5 kg/m
3밀도구보다유의하게성장 이낮아졌다.
하지만6 kg/m
3밀도실험구의성장은1.5 kg/m
3 및3 kg/m
3밀도실험구와는차이가없었고,
전실험구간에서생존율에차이가없었던점으로보아
, 6 kg/m
3밀도실험구가고밀도사육에의한성장과생존율저하를유발하는밀도는아닌 것으로판단된다
.
이러한결과는틸라피아(54 g/fish)
를대상으 로한실험에서도30-60
마리/m
3밀도실험구까지는성장이유 의하게증가하다가70
마리/m
3실험구에서성장이감소하였으 나생존율에서는전실험구간에서차이를보이지않아서본실 험과유사한경향을보였다(Yi et al., 1996).
사육밀도는어류의생존
,
성장및활동성에영향을미치는요 소다(Brown et al., 1992; Cruze and Ridha, 1991; Hargreaves et al, 1991; Irwin et al., 1999; Wallat et al., 2004; Watanabe et al., 1990).
고밀도사육은성장률을감소시키며,
폐사율을증가 시키는것으로잘알려져있다(Kincaid et al., 1976; Lee et al.,
1996).
그러나,
이와는반대로어종에따라서저밀도로사육하는것이오히려폐사를유발할수있고
(Refstie, 1977; Bjoerns-
son, 1994),
저밀도에서특정고밀도까지밀도를증가시켜도성장에영향을미치지않았으며
(King et al., 1998; Fairchild and Howell, 2001),
고밀도사육이성장률,
생존율및사료효율을 증가시켰다는상반된결과들도보고되고있다(Rowland et al., 2006; Watanabe et al., 1990).
따라서,
어종에따라적정사육밀 도는달라질수있으므로경제성을고려하여사육어종의크기 에따른최적사육밀도의규명은매우중요하다.
기존의타어종의적정사육밀도를보면
,
황점볼락(3 g)
은3 kg/m
3(Yoon et al., 2007),
필리핀뱀장어(3-40 g)
는1.4-3 kg/
m
3(Choi et al., 2017),
극동산뱀장어(5-15 g)
는1.1-1.8 kg/
m
3(MOF, 2000),
돌돔(28 g)
은5 kg/m
3(Kim, 2011),
조피볼 락(44-60 g)
은4.5-6 kg/m
3(Oh et al., 2013), Atlantic salmon (71 g)
은86 kg/m
3(Hosfeld et al., 2009),
무지개송어(180 g)
는80 kg/m
3(North et al., 2006), Atlantic cod (832 g)
는30 kg/
m
3(Lambert and Dutil, 2001), red tilapia (75g)
는7.5 kg/m
3(Suresh and Kwei, 1992)
으로보고되고있다.
본연구에서추정된쏘가리의적정사육밀도
3-4.5 kg/m
3는육식성이고
,
온수성어류인돌돔의5 kg/m
3(Kim, 2011),
필리 핀뱀장어의1.4-3 kg/m
3(Choi et al., 2017),
극동산뱀장어의1.1-1.8 kg/m
3(MOF, 2000),
황점볼락의3 kg/m
3(Yoon et al.,
2007)
의사육밀도와비슷한결과를나타내었으며,
냉수성어류(30-86 kg/m
3)
와는차이를나타내었다.
냉수성어류는보통유 수식으로사육하기때문에높은환수율로깨끗한수질과높은 용존산소량을유지하여키우기때문에수용밀도를높게하여Table 5. Daily feed intake (DFI), daily protein intake (DPI) and protein efficiency ratio (PER) of 2-year old mandarin fish Siniperca scherzeri fed experiment diet for 15 weeks1
Stoking density (kg/m3) DFI (%)2 DPI (%)3 PER (%)4
1.5 0.66±0.04a 0.35±0.02a 3.26±0.13c
3 0.91±0.01b 0.49±0.01b 2.52±0.01b
4.5 1.10±0.01c 0.59±0.01c 2.17±0.01a
6 0.98±0.02b 0.53±0.01b 2.37±0.06ab
1Values (mean±SE of replicate groups) in the same column not sharing a common superscript are significantly different (P<0.05). 2Daily feed intake=feed intake×100 / [(initial fish wt.+ final fish wt.+dead fish wt.)×days reared / 2]. 3Daily protein intake=protein intake×100 / [(initial fish wt.+final fish wt.+dead fish wt.)×days reared / 2]. 4Protein efficiency ratio=wet weight gain / protein intake.
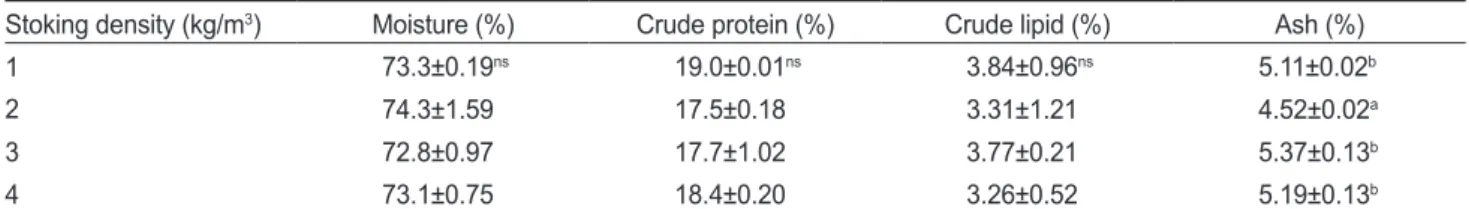
Table 6. Whole body proximate composition of 1-year old mandarin fish Siniperca scherzeri fed experiment diet for 10 weeks Stoking density (kg/m3) Moisture (%) Crude protein (%) Crude lipid (%) Ash (%)
1 73.3±0.19ns 19.0±0.01ns 3.84±0.96ns 5.11±0.02b
2 74.3±1.59 17.5±0.18 3.31±1.21 4.52±0.02a
3 72.8±0.97 17.7±1.02 3.77±0.21 5.37±0.13b
4 73.1±0.75 18.4±0.20 3.26±0.52 5.19±0.13b
1Values (mean±SE of replicate groups) in the same column not sharing a common superscript are significantly different (P<0.05). ns Not significant (P>0.05).
사육할수있기때문인것으로판단된다
.
쏘가리
1
년생(50.2 g)
의 고밀도 실험구(4 kg/m
3)
와2
년생(173.1 g)
의고밀도실험구(6 kg/m
3)
에서성장과사료섭취율이 유의하게낮아지는결과를나타내었다.
일반적으로고밀도양 식에서어류들간에계층화가생겨우점화되고성장이양호한 개체와성장이쳐지는개체가많이생긴다고보고되었는데,
이 렇게성장이쳐진개체는먹이에대한접근성이떨어져사료섭취감소와더불어성장이저하되는것으로판단된다
(Wede-
meyer, 1996; Paspatis et al., 1999; Rowland et al., 2006).
본 실험결과에서도쏘가리1
년생(50.2 g)
의고밀도실험구(4 kg/
m
3)
와2
년생(173.1 g)
의고밀도실험구에서일일사료섭취율의 감소와성장저하를나타내어이전의결과와유사한경향을보 였다.
10
주간의사육실험종료후1
년생소형쏘가리의전어체일반성분분석결과를
Table 6
에나타내었다.
밀도에따른실험에서 수분,
단백질과지질함량은모든실험구간에서유의차가없었 다(P>0.05).
회분함량은2 kg/m
3실험구가다른실험구보다유 의하게낮은결과를나타내었다(P<0.05).
15
주간의사육실험종료후2
년생대형쏘가리의전어체일반성분분석결과를
Table 7
에나타내었다.
밀도에따른실험Table 8. Plasma chemical composition of 1-year old mandarin fish Siniperca scherzeri fed experiment diet for 10 weeks1 Stoking density (kg/m3)
1 2 3 4
TP (g/dl)2 4.9±0.20ns 4.5±0.20 4.1±0.30 4.1±0.01
Cholesterol (mg/dl), TCHO3 407.0±4.0ns 365±35.0 335±30.0 317±2.0
GOT (U/L)4 33.5±3.50ns 64.0±4.00 45.5±15.5 57.5±24.5
GPT (U/L)5 6.0±1.00ns 6.5±0.50 7.0±1.00 6.0±0.01
ALP (U/L)6 358.5±37.5ns 344.5±36.5 257.0±33.0 169.5±15.5
Bilirubin (mg/dl) 0.15±0.05ns 0.15±0.05 0.50±0.10 0.50±0.10
Albumin (g/dl) 0.8±0.10ns 0.7±0.01 0.7±0.01 0.7±0.01
1Values are mean±SE of replicate groups. 2TP, Total protein. 3TCHO, Total cholesterol. 4GOT, Glutamic oxaloacetic transaminase. 5GPT, Glutamic pyruvic transaminase. 6ALP, Alkaline phosphatase. nsNot significant (P>0.05).
Table 7. Whole body proximate composition of 2-year large mandarin fish Siniperca scherzeri fed experiment diet for 15 weeks1 Stoking density (kg/m3) Moisture (%) Crude protein (%) Crude lipid (%) Ash (%)
1.5 77.2±0.10ns 15.6±0.36a 0.66±0.01ns 1.73±0.09ns
3 76.5±0.23 17.2±1.78ab 0.92±0.20 1.49±0.26
4.5 76.6±0.25 17.5±1.77ab 1.12±0.16 1.59±0.16
6 76.8±0.95 21.4±0.71b 1.02±0.07 1.56±0.04
1Values (mean±SE of replicate groups) in the same column not sharing a common superscript are significantly different (P<0.05). ns Not significant (P>0.05).
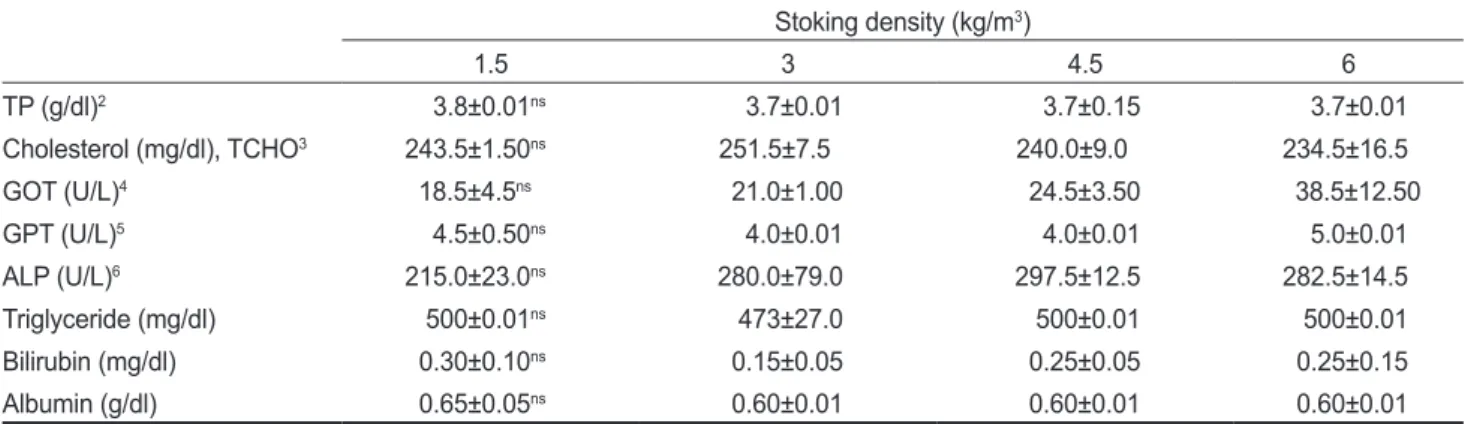
Table 9. Plasma chemical composition of 2-year old mandarin fish Siniperca scherzeri fed experiment diet for 15 weeks1 Stoking density (kg/m3)
1.5 3 4.5 6
TP (g/dl)2 3.8±0.01ns 3.7±0.01 3.7±0.15 3.7±0.01
Cholesterol (mg/dl), TCHO3 243.5±1.50ns 251.5±7.5 240.0±9.0 234.5±16.5
GOT (U/L)4 18.5±4.5ns 21.0±1.00 24.5±3.50 38.5±12.50
GPT (U/L)5 4.5±0.50ns 4.0±0.01 4.0±0.01 5.0±0.01
ALP (U/L)6 215.0±23.0ns 280.0±79.0 297.5±12.5 282.5±14.5
Triglyceride (mg/dl) 500±0.01ns 473±27.0 500±0.01 500±0.01
Bilirubin (mg/dl) 0.30±0.10ns 0.15±0.05 0.25±0.05 0.25±0.15
Albumin (g/dl) 0.65±0.05ns 0.60±0.01 0.60±0.01 0.60±0.01
1Values are mean±SE of replicate groups. 2TP, Total protein. 3TCHO, Total cholesterol. 4GOT, Glutamic oxaloacetic transaminase. 5GPT, Glutamic pyruvic transaminase. 6ALP, Alkaline phosphatase. nsNot significant (P>0.05).
에서수분
,
지질과회분함량은모든실험구간에서유의차가없 었다(P>0.05).
그러나,
전어체의단백질함량은6 kg/m
3실험구가
1.5 kg/m
3실험구보다유의하게높은결과를나타내었다(P<0.05).
이와같이고밀도실험구에서전어체의단백질함량 증가는사료섭취저하에따른체내에너지축적이감소되어,
상 대적으로단백질조성비가증가된결과로추측된다.
실험종료 후
1
년생소형쏘가리와2
년생대형쏘가리의미부 혈관에서채혈한혈장의성상변화를Table 8
와Table 9
에나타 내었다.
두실험모두에서total protein, total cholesterol, GOT, GPT, ALP, bilirubin
및albumin
함량은실험구간에유의차가 나타나지않았다(P>0.05).
GOT
와GPT
같은혈중transaminase
의측정은어류의간과 신장의조직학적인 손상을판단하는 지표로서 사용되었는데(Kristofferson et al., 1974),
본연구에서쏘가리2
년생의사육 밀도가증가함에따라성장이증가하다가감소현상이일어나는 고밀도실험구(6 kg/m
3)
의GOT
의결과가유의차는없었지만 높은값을나타내어고밀도사육에따른대사저하등의부작용 이초래될가능성을암시하고있어,
이에대한추가적인연구가 필요할것으로판단된다.
본연구의결과로부터
,
쏘가리1
년생소형어(50.2 g)
을대상 으로한적정사육밀도는3 kg/m
3였으며,
쏘가리2
년생대형어(173.1 g)
을대상으로한적정사육밀도는4.5 kg/m
3로나타났 다.
이러한결과는쏘가리양식현장에종사하는양어가들에게 유용한정보가될것으로전망된다.
사 사
이연구는해양수산부재원으로한국해양과학기술진흥원에 서지원하는수산실용화기술개발사업
(
쏘가리배합사료및순 치기술개발)
에의해수행되었으며,
이에감사드립니다.
References
Ahmad TA, El-Zahar C and Wuan TO. 1999. Nursing and pro- duction of the grouper Epinephelus coioides at different stocking densities in tanks and sea cages. Asian Fish Sci 12, 267-276.
AOAC (Association of Official Analytical Chemists). 1995. Of- ficial Methods of Analysis, 16th edition. Association of Of- ficial Analytical Chemists, Arlington, Virginia, U.S.A.
Brett JR. 1979. Environmental factor and growth. In: Fish physi- ology, Vol. VIII, Hoar, WS Randall DJ and Brett JR, eds.
Academic Press, New York, U.S.A., 599-625.
Brown GE, Brown JA and Srivastava RK. 1992. The effect of stocking density on the behavior of Arctic charr (Salvelinus
alpinus L.). J Fish Biol 42, 955-963.
Brown ME. 1957. Experimental studies on growth. In: M.E.
Brown (Ed.). The Physiology of Fishes. Academic Press, New York, U.S.A., 361-400.
Bjornsson B. 1994. Effects of stocking density on growth rate of halibut (Hippoglossus hippoglossus L.) reared in large circu- lar tanks for three years. Aquaculture 123, 259-270. https://
doi.org/10.1016/0044-8486(94)90064-7.
Boyce DL, Purchase CF, Puvanendran V and Brown JA. 1998.
Designing rearing environments for on-growing of juvenile yellowtail flounder (Pleuronectes ferrugineus). Bull Aqua- cult Ass Can 2, 23-24.
Choi HS, Kim HG, Lee JH, Kim BR and Lee YS. 2017. Ef- fects of water temperature, stocking density and size varia- tion on growth of Philippines eel (Anguilla bicolor pacifica) at intensive pond culture system. J Fish Mar Sci Educ 29, 1013-1020.
Choi YU, Park HS and OH SY. 2011. Effects of stocking den- sity and feeding frequency on the growth of the pacific cod,
Gadus macrocephalus. Korean J Fish Aquat Sci 44, 58-63.
Cruz EM and Ridha M. 1991. Production of the tilapia Oreo-
chromis spirulus Gunther stocked at different densi-
ties in sea cages. Aquaculture 99, 95-103. https://doi.org/10.1016/0044-8486(91)90290-n.
Duncan DB. 1955. Multiple-range and multiple F tests. Biomet- rics 11, 1-42. https://doi.org/10.2307/3001478.
Fairchild EA and Howell WH. 2001. Optimal stocking den- sity for juvenile winter flounder Pseudopleuronectes
americanus. J World Aquacult Soc 32, 300-308. https://doi.
org/10.1111/j.1749-7345.2001.tb00453.x
Hargreaves JA, Rakocy JE and Bailey DS. 1991. Effects of dif- fused air and stocking density on growth, feed conversion and production of Florida red tilapia in cages. J World Aquacult Soc 22, 24-29. https://doi.org/10.1111/j.1749-7345.1991.
tb00712.x.
Hosfeld CD, Hammer J, Handeland S, Fivelstad S and Stefans- son S. 2009. Effects of fish density on growth and smoliti- fication in intensive production of Atlantic salmon (Salmo
salar). Aquaculture 294, 236-241. https://doi.org/10.1016/j.
aquaculture. 2009.06.003.
Hwang HK, Son MH, Myeong JI, Kim CW and Min BH. 2014.
Effects of stocking density on the cage culture of Korean rockfish (Sebastes schlegeli). Aquaculture 434, 303-306.
https://doi.org/10.1016/j.aquaculture.2014.08.016.
Irwin S, Halloran JO and Fitzgerald RD. 1999. Stocking density, growth and growth variation in juvenile turbot,
Scophthalmus maximus. Aquaculture 178, 1-2. https://doi.
org/10.1016/s0044-8486(99)00122-2.
Kim PK. 2011. Effects of stocking density and dissolved oxy- gen concentration on the growth and hematology of the par- rotfish, Oplegnathus fasciatus in a recirculating aquaculture system. Korean J Fish Aquat Sci 44, 747-752. https://doi.
org/10.5657/kfas.2011.0747.
Kim YO. 2015. The study aquaculture of Siniperca scherzeri.
The research report of Chungcheongbuk-do Inland Fisher- ies Research Institute, Munwa Press, Chungju, Korea, 7-15.
Kim YO and Lee SM. 2016. Growth of water temperature on growth and body composition of juvenile mandarin fish,
Siniperca scherzeri. Korean J Fish Aquat Sci 49, 607-611.
https://doi.org/10.5657/kfas.2016.0607.
Kim YO and Lee SM. 2017. Effect of 1-year and 2-year old mandarin fish, Siniperca scherzeri fed the diets containing different fish meal levels. J Fish Mar Sci Educ 29, 1054- 1062.
Kim JD, Jung JY and Lee CH. 1988. Study on the egg taking and hatching of Siniperca scherzeri Steindachner. Bull Nat’l Fish Res Dev Agency Korea 42, 81-85.
Kincaid HI, Bridges WR, Thames AE and Donahoo MJ. 1976.
Rearing capacity of circular containers of different sizes for fry and fingering rainbow trout. Progressive Fish-Culturist 38, 11-17. https://doi.org/10.1577/1548-8659(1976)38[11:rc occo]2.0.co;2.
King N, Howell WH and Fairchild E. 1998. The effect of stock- ing density on the growth of juvenile summer flounder
Paralichthys dentatus. In: Proceedings of the twenty-sixth
U.S. Japan Aquaculture Symposium. Howell WH, Keller BJ, Park PK, McVey JP, Takayanagi K and Uekita Y, eds.Durham Press, New Hampshire, U.S.A., 173-180.
Kristofferson R, Broberg S, Oskari A and Pekkarinen M. 1974.
Effect of a sublethal concentration of phenol on some blood plasma enzyme activities in the pike (Esoxlucius L.) in brackish water. Ann Zool Fennici 11, 220-223. https://doi.
org/10.1007/bf00677929.
Lambert Y and Dutil J. 2001. Food intake and growth of adult Atlantic cod (Gadus morhua) reared under different condi- tion of stocking density, feeding frequency and size-grading.
Aquaculture 192, 233-247. https://doi.org/10.1016/s0044- 8486(00)00448-8.
Lee JK, Kim SC and Lee SM. 1996. Influence of stocking density on growth, feed efficiency and body composition of juvenile fat cod (Hexagrammos otakii Jordan et Starks) in indoor culture system. J Aquac 9, 233-237. https://doi.
org/10.1111/j.1365-2095.2008.00564.x.
McClain WR. 1995. Growth of crawfish Procambarus clarkii as a fuction of density and food resources. J World Aquacul Soc 26, 24-28. https://doi.org/10.1111/j.1749-7345.1995.
tb00205.x.
MOF (Ministry of Oceans and Fisheries). 2000. A study on the aquaculture of European and American eel, Ministry of Oceans and Fisheries Report, Seoul, Korea, 113.
Morrissy NM. 1992. Density-dependent pond growout of single year-class cohorts of a freshwater crayfish Cherax tenuima-
nus to two years of age. J World Aquacult Soc 23, 154-168.
https://doi.org/10.1111/j.1749-7345.1992.tb00764.x.
North BP, Turnbull JF, Ellis T, Porter MJ, Migaud H, Bron J and Bromage NR. 2006. The impact of stocking density on the welfare of rainbow trout (Oncorhynchus mykiss).
Aquaculture 255, 466-479. https://doi.org/10.1016/j.aqua-
culture.2006.01.004.
Oh DH, Song JW, Kim MG, Lee BJ, Kim KW, Han HS and Lee KJ. 2013. Effect of food particle size, stocking density and feeding frequency on the growth performance of juvenile Korean rockfish Sebastes schlegeli. Korean J Fish Aquat Sci 45, 407-412.
Paspatis M, Batarias C, Tiangos P and Kentouri M. 1999. Feed- ing and growth in response of sea bass (Dicentrarchus
labrax) reared by four feeding methods. Aquaculture 175,
293-305. https://doi.org/10.1016/s0044-8486(99)00104-0.Refstie T. 1977. Effects of density on growth and survival of rainbow trout. Aquaculture 11, 329-334. https://doi.
org/10.1016/0044-8486(77)90082-5.
Rowland SJ, Mifsud C, Nixon M and Boyd P. 2006. Effects of stocking density on the performance of the Australian freshwater silver perch (Bidyanus bidyanus) in cages. Aqua- culture 253, 301-308. https://doi.org/10.1016/j.aquacul- ture.2005.04.049.
Suresh AV and Kwei LC. 1992. Effects of stocking density on water quality and production of red tilapia in a recir- culated water system. Aquac Eng 11, 1-22. https://doi.
org/10.1016/0144-8609(92)90017-r.
Wallat GK, Tiy LG, Rapp JD and Moore R. 2004. Effect of stocking density on growth, yield and costs of producing rainbow trout, Oncorhynchus mykiss, in cages. J Appl Aqua- cult 15, 73-82. https://doi.org/10.1300/j028v15n03_06.
Watanabe WO, Clark JH, Dunham JB, Wicklund RI and Olla BJ. 1990. Production of fingerling Florida red tilapia (Tilapia
hornorum x T. mossambica) in floating marine cages. Prog-
ress. Ish Cult 52, 158-161. https://doi.org/10.1577/1548- 8640(1990)052%3C0158:POFFRT%3E2.3.CO;2.Webb KA, Hitzfelder GM, Faulk CK and Holt GJ. 2007.
Growth of juvenile cobia, Rachycentron canadum, at three different densities in a recirculating aquaculture system.
Aquaculture 264, 223-227. https://doi.org/10.1016/j.aqua- culture.2006.12.029.
Wedemeyer GA. 1996. Physiology of Fish in Intensive Cul- ture Systems. Chapman and Hall, New York, U.S.A., 232.
https://doi.org/10.1007/978-1-4615-6011-1_1.
Yi Y and Kwei Lin C. 2001. Effects of biomass of caged Nile ti- lapia (Oreochromis niloticus) and aerotion on the growth and yields in an integrated cage-cum-pond system. Aquaculture 195, 253-267. https://doi.org/10.1016/S0044-8486(00)00558- Yi Y, Kwei Lin C and Diana JS. 1996. Influence of Nile tilapia 5.
(Oreochromis niloticus) stocking density in cages on their growth and yield in cages and in ponds containg the cages.
Aquaculture 146, 205-215. https://doi.org/10.1016/S0044- 8486(96)01377-4.
Yoon SJ, Kim DH, Hwang HG, Song GC and Kim YC. 2007.
Effects of water temperature, Stocking density and feeding frequency on survival and growth in the oblong rockfish Se-
bastes oblongus larvae. Korean J Ichthyol 19, 154-159.
Zohreh S, Sanaz K, Kim YO and Lee SM. 2017. Effect of di- etary protein and lipid level on growth, feed utilization and muscle composition in golden mandarin fish, Siniperca
scherzeri. Fish Aqu Sci, 20:7. https://doi.org/10.1186/
s41240-017-0053-0.