발전설비 보일러 튜브 용접부의 잔여수명평가 신뢰성 향상을 위한 기계적 물성 변화 연구
오 병 진
*,
†․장 중 순**
*
한전KPS주식회사 솔루션센터, 아주대학교 산업공학과 대학원
**
아주대학교 대학원 산업공학과
A Study on Mechanical Properties Changes to Improve the Confidence of Remaining Life Evaluation for the Weldment of Power Plant Boiler Tube
Byungjin Oh*
,
† and Joong Soon Jang***KEPCO-KPS Technology solution center, Ajou University, Industrial Engineering, Sungnam 463-726, Korea
**Ajou University, Industrial Engineering, Suwon 443-749, Korea
†Corresponding author : [email protected]
(Received June 12, 2013 ; Revised July 12, 2013 ; Accepted September 27, 2013)
Abstract
Boiler equipment in power plant is always being operated in harsh conditions and severely exposed to the extreme environment of high temperature. Therefore periodically the state of devices should be checked, diagnosed, and analyzed to ensure the reliability of the equipment. Traditionally, such a diagnosis is based one or two physical properties of the sample taken from the equipment like hardness, microstructure, etc..
However, to enhance the confidence of the diagnosis, it is necessary to synthesize those properties together. This paper is to propose such a synthetic procedure for T23 which was developed to be used in 569℃/596℃ condition. Creep test and accelerated degradation test were performed simultaneously, and the physical properties such as microstructure, tensile strength, yield strength, hardness, and indentation properties were measured. This paper proposes a method of determining the remaining life by quantitative comparison. It will provide the basis of evaluating life assessment more objective and reliable.
Key Words : Life assessment, SA213-T23, Degradation
1. 서 론
발전설비 중 보일러설비는 보통 고온의 열원과 직접 접촉하기 때문에 항상 열악한 조건과 환경에 노출된 상 태로 운전되고 있다. 따라서 주기적으로 기기상태를 점 검, 진단, 분석, 평가하여 설비의 신뢰성을 확보할 필요 가 있다.
발전설비를 요소별로 정밀 진단·평가를 통하여 설비 의 취약개소를 미리 탐지하고 적정시기에 예측 정비를 함으로서 수명을 연장시키고 효율적으로 설비를 운용할 수 있게 된다.
최근 발전소의 주증기 및 고온재열 증기 계통은 통상 569°C/596°C의 높은 온도 범위에서 운영 되고 있다.
따라서 보일러 튜브의 재질 특성을 개선시키기 위한 노 력으로 기존의 SA213-T22를 개량하여 고온강도와 크 리프 파단강도를 향상시킨 T23을 개발하였다.
본 논문에서는 데이터베이스가 비교적 부족한 T23 보일러 튜브 재질을 용접, 가속열화시험을 실시하고 열 화등급별 기계적 특성을 파악하여 잔여수명을 정량적으 로 비교 판단하여 좀 더 객관적이고 신뢰성 높은 수명 평가를 할 수 있는 근거를 마련하였다.
수명평가분야 해외 기술개발 현황을 보면 국내에 비 하여 일찍부터 발전 설비 및 산업용 보일러 설비를 운
연 구 논 문
Name (Ys)min.
[MPa(ksi)]
(Ts)min.
[MPa(ksi)]
ε(%) [50mm]
Hardness max.
[HB/HV]
T23 400(58) 이상 510(74) 이상 20 이상 220/230 이하
Table 2 International standards and maximum allowable tube temperature
ASTM German Japanese ASME (℃)
SA213-T23 7CrWVMoNb9-6 STBA24J1
(HCM2S) 600
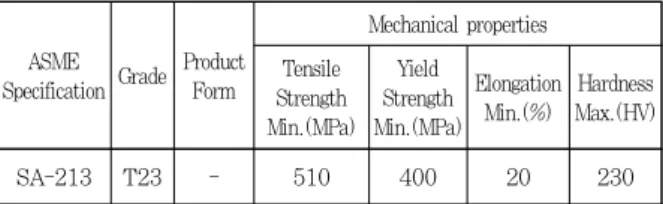
Table 3 Tensile and hardness requirements
ASME
Specification Grade Product Form
Mechanical properties Tensile
Strength Min.(MPa)
Yield Strength Min.(MPa)
Elongation Min.(%)
Hardness Max.(HV)
SA-213 T23 - 510 400 20 230
Table 4 Maximum allowable stress values for metal tem
Temp.
℃ 204 260 316 343 371 399 427 454 482 510 538 Stress
(MPa) 118 118 118 118 107.6 90 74.5 60 41 23.4 14.5 Table 1 Mechanical properties of revised 2.25Cr-1Mo 용해 왔기 때문에 노후화된 설비의 점검 진단에서 수명
평가에 이르기 까지 각 나라마다 고유한 기법을 적용해 왔으며 고온․고압부 보일러 설비에 대하여도 재료 물 성에 대한 자체 데이터를 확보하고 유수의 대학 및 연 구기관과 협력하여 체계적이고 객관적으로 관리․운용 되어오고 있다. 유럽(Finland) VTT 및 미국의 EPRI, ASM, ASTM 등 연구단체에서 현재 발전설비에 적용 된 각 재료에 대하여 기계적 물성치와 미세조직 변화 등에 대한 자료를 계속적으로 실험을 통해 데이터베이 스화 하고 있으며 국내에 비하여 최근 사용재료에 대한 반응성이 빠른 편이며 기술 수준도 높다. 다만, 최근에 개발되어 적용되고 있는 일부 설비재료에 대한 분석 보 고 및 데이터베이스 구축 사례는 드물고 공개되지 않고 있다. 국외 저명한 수명평가 관련 기관에서 확보하고 있는 데이터의 경우, 기술 보안의 이유로 외부에 공개 를 하지 않는 경우가 많으므로 국내에서 이를 활용하기 가 용이하지 않을 뿐더러 비용도 만만치 않은 게 현실 이다. 현재 국내 발전 설비 보일러에 대한 정밀 진단 및 수평평가는 십 수 년 간 수행되어 오고 있으나 현장 검사시 필요한 기기의 물성 데이터를 수명평가시 요구 될 때에 한해 일부 기관 혹은 대외 기관에 요청하여 데 이터를 받아 활용하는 정도에 그치고 있다. 실질적으로 국내에 보일러 설비를 운용하는 회사에 있어서 관련 설 비 재료의 물성 데이터베이스를 구축한 예는 대형 연구 원 한 두 곳을 빼고는 사실상 전무하기 때문에 현재까 지 수명평가 및 진단에 요구되는 물성은 진단 시에 측 정된 자료 혹은 해외로부터 확보된 자료 등을 바탕으로 수명 진단에 적용되고 있는 실정으로 소재에 대한 원천 적인 물성 데이터를 체계적으로 확보하고 검사에 활용 된 사례는 없는 상태이다. 따라서 설비에 대한 필수적 인 재료 물성 데이터는 설비의 정비 시에 수행된 평가 자료, 대학 및 연구기관에서 특수한 조건 하에서 수행 된 연구 자료 외에는 종합적인 데이터베이스는 없다.
본 연구의 목적은 고온고압 기기에 대한 잔존수명평가 기법을 본 실험 데이터베이스에 다양하게 적용하여 보 일러 주요 재료의 재질열화평가에 있어 신뢰도를 높이 고 정량화하기 위함이다.
2. 실 험 2.1 시험재 SA213-T23의 특성
2.1.1 저 Cr-Mo 강의 기계적 특성
1) 600℃정도 이하의 온도영역에서 사용되는 재료이 다. 저 Cr-Mo 강은 Mo의 첨가에 따라 고온 강도를 향상시키고, Cr에 의하여 내산화성 및 흑연화에 대한
저항성을 향상시킨 것이다. 이 재료들은 고온증기 계통 인 주증기, 고온재열, 저온재열 및 추기 계통의 증기에 사용된다.
2) 저 Cr-Mo 합금강 중 사용빈도가 높은 재료는 T11(P11), T12(P12)와 T22(P22)이며, 각 등급의 Cr-Mo의 함유량은 다음과 같다.
T12 : 1Cr-½Mo, T11 : 1¼Cr-½Mo, T22 : 2¼Cr-1Mo
3) 배관의 경제성 및 이용 가능성을 고려할 때 일반 적으로 Grade P11 경우는 565°C까지, 그리고 Grade P22는 593°C 까지 사용 가능하다. 일반적으로 Cr-Mo Grade P22는 증기온도 538°C의 온도 범위에서 가장 경제적인 재료로 간주된다.
4) 최근 화력발전소의 주증기 및 고온재열 증기 계통 은 통상 569°C/596°C의 온도 범위로 되어 있다. 따라 서 보일러 튜브재질의 성질을 향상시키기 위한 노력으 로 기존의 T22를 개량하여 고온강도와 크리프 파단강 도를 향상시킨 T23(Table 1~6)을 개발하였다.
5) 시험재료의 각종 특성
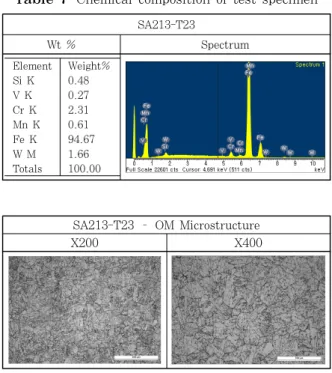
2.1.2 확보된 신재 강종 튜브에 대하여 각 강종 별로 주요
성분(Cr, Ni, Mn)의 함량 적정성을 확인하기 위하여 EDS
장비를 사용하여 성분 분석(Table 7)을 수행하였다.
Spec. &
Grade C Si Mn Cr Mo Nb V W
SA213- T23
0.04- 0.10
0.01 0
0.10- 0.60
1.9- 2.6
0.05- 0.30
0.02- 0.08
0.20- 0.30
1.45- 1.75 N : max 0.030,, Al : max 0.03, B : 0.0005-0.006
Table 6 The results of test specimen and specifications Materials Ts
(MPa)
(Ts)avg. 0.2%
offset (MPa)
(Ys)avg. ε (%)
(ε) avg.
Spec. Spec. Spec.
SA213- T23
T23-1 599.8
605.5 499.8
527.2 31.4 30.3
T23-2 607.9 524.6 30.4
T23-3 608.9 >510 557.1 >400 29.0 >20
Table 7 Chemical composition of test specimen SA213-T23
Wt % Spectrum
Element Weight%
Si K 0.48
V K 0.27
Cr K 2.31
Mn K 0.61
Fe K 94.67
W M 1.66
Totals 100.00
SA213-T23 – OM Microstructure
X200 X400
Fig. 1 SA213-T23 metallography OM(Optical Microscope)
SA213-T23 – SEM Microstructure
X1,500 X5,000
Fig. 2 SA213-T23 metallography SEM Table 5 Chemical composition
Material Temp.(℃) Step (hr)
SA213 - T23
720
℃
Step 1 2 3 4 5
hr New-S 3 10 30 100
Step 6 7 8 9 -
hr 300 1000 1500 2000 -
740
℃
Step 1 2 3 4 5
hr New-S 3 10 30 100
Step 6 7 8 9 -
hr 300 1000 1500 2000 - Table 8 SA213-T23 degradation test scheme
2.1.3 확보된 신재 강종 튜브에 대하여 금속 미세 조 직을 광학현미경과 전자주사현미경(SEM)으로 관찰하였다 (Fig. 1, 2). 관찰된 미세 조직은 X200, X400, X1,500, X5,000 배율로 촬영하였다.
2.2 가속열화시험
인공열화시험 수행을 위하여 확보된 SA213-T23에 대하여 공정절차서 상의 열화 시간 및 온도 단계에 따 라 시험을 수행하였다. 각 온도별 열화 단계는 다음 Table 8과 같다. 시간별, 온도별로 인공 열화된 단계 별 시험편에 대하여 금속미세조직 관찰 및 기계적 특성 을 평가하기 위하여 분석에 용이하도록 시험편을 재가 공하였으며 시편마다 소재 및 열화 온도, 열화 시간의 구분에 혼동이 없도록 Marking하여 평가를 수행하였 으며 최종 적으로 마운팅한 시편에서도 구분이 될 수 있도록 시편별로 Marking 하여 시편이 구별되도록 하 였다.
2.3 조직 시험
열화 시험편에 대하여 광학현미경(OM) 및 전자주사 현미경(SEM)을 사용하여 금속 미세 조직을 관찰하고 사 진으로 촬영하였다. 광학현미경의 경우, X200 및 X400 배율로 촬영하였으며 전자주사현미경의 경우, X1500, X2500, X5000의 배율로 촬영하였다.
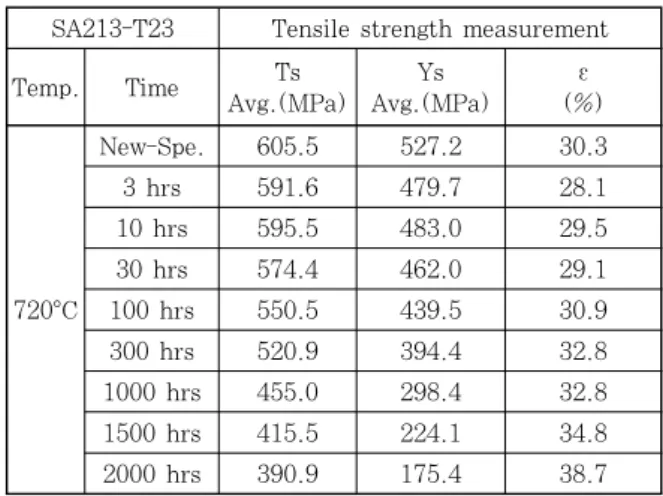
2.4 인장시험
인장시험편의 경우, 각 온도 및 시간별 열화 단계에 대하여 단계별로 각 3 ea씩 가공 및 제작하였으며 제 작된 시편으로 인장시험을 수행한 측정값을 평균하여 각각의 단계별 열화 시편에 대하여 인장시험 결과를 획 득하였다(Table 9, 10).
가속열화온도 720℃, 740℃에서는 열화시간의 1,000Hr
이하에서는 인장강도 및 항복강도값이 서서히 감소하다
가 1,000Hr이상에서는 급격히 감소하였다(Fig. 3, 4,
5, 6). 이것은 베이나이트가 분해 및 구상화 발생하고
탄화물이 조대화되어 인장강도 및 항복강도가 급격히
감소한 것으로 생각된다.
SA213-T23 Tensile strength measurement
Temp. Time Ts
Avg.(MPa) Ys Avg.(MPa)
ε (%)
720°C
New-Spe. 605.5 527.2 30.3
3 hrs 591.6 479.7 28.1
10 hrs 595.5 483.0 29.5 30 hrs 574.4 462.0 29.1 100 hrs 550.5 439.5 30.9 300 hrs 520.9 394.4 32.8 1000 hrs 455.0 298.4 32.8 1500 hrs 415.5 224.1 34.8 2000 hrs 390.9 175.4 38.7
Table 10 Tensile strength at 740°C
SA213-T23 Strength measurement
Temp. Time Ts
Avg.(MPa) Ys Avg.(MPa)
ε (%)
740°C
New-Spe. 605.5 527.2 30.3
3 hrs 595.8 485.8 29.5
10 hrs 579.4 464.1 30.8 30 hrs 557.4 439.0 29.8 100 hrs 525.5 405.6 33.7 300 hrs 468.9 329.0 35.9 1000 hrs 354.2 162.9 43.2 1500 hrs 351.2 154.3 43.8 2000 hrs 359.6 163.3 42.7
700
600
500
400
300
200
0 500 1000 1500 2000
Aging time (Hrs)
Stress(MPa)
T23 UTS 720℃
T23 UTS 740℃
Fit curve of T23 UTS 740℃
Fit curve of T23 UTS 720℃
Fig. 3 Tensile strength due to degradation time
Table 9 Tensile strength at 720°C
700600
500
400
300
200
Stress(MPa)
20 21 22 23 24
LMP(C=20)
T23 UTS vs . LMP at 720℃
T23 UTS vs . LMP at 740℃
Fit curve of T23 UTS vs. LMP
SA213-T23
Fig. 4 Corelation between Ts and LMP
600
500
400
300
200
100
0
0 500 1000 1500 2000
Aging time (Hrs)
Stress(MPa)
T23 UTS 720℃
T23 UTS 740℃
Fit curve of T23 UTS 740℃
Fit curve of T23 UTS 720℃
Fig. 5 Yield strength due to aging time
700
600
500
400
300
200
Stress(MPa)
20 21 22 23 24
LMP(C=20)
T23 YS vs . LMP at 720℃
T23 YS vs . LMP at 740℃
Fit curve of T23 YS vs. LMP
SA213-T23
Fig. 6 Corelation between yield strength and LMP
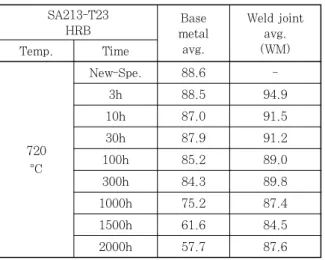
2.5 경도시험 결과
각 열화된 시편에 대하여 경도시험을 실시하였다. 경도 는 Rockwell B scale로 측정 하였으며 각 부위에 대하여 3번을 측정한 후 평균값으로 나타내었다(Table 11, 12).
가속열화온도 720℃, 740℃에서 경도값은 열화시간
1,000Hr이상에서 급격히 감소하는 현상을 나타내었다.
이것은 인장강도 및 항복강도값의 감소현상과 같은 현 상을 나타내었다(Fig. 7, 8). 이것의 원인은 이 열화시 간에서 베이나이트가 분해 및 구상화 발생하고 탄화물 이 조대화되어 경도값이 급격히 감소한 것으로 생각된다.
2.6 압입시험 결과
압입시험은 재료에 손상 없이 시험하는 비파괴시험
이면서도 그 시험법이 간편해 시험편 채취가 불가능한
SA213-T23 HRB
Base metal
avg.
Weld joint avg.
Temp. Time (WM)
720
°C
New-Spe. 88.6 -
3h 88.5 94.9
10h 87.0 91.5
30h 87.9 91.2
100h 85.2 89.0
300h 84.3 89.8
1000h 75.2 87.4
1500h 61.6 84.5
2000h 57.7 87.6
Table 12 Hardness at 740°C SA213-T23
HRB Base metal
avg.
Weld joint avg.
(WM)
Temp. Time
740°C
New-Spe. 88.6 -
3h 88.2 95.1
10h 87.9 93.8
30h 86.8 90.5
100h 84.2 90.1
300h 80.9 88.8
1000h 56.0 63.2
1500h 54.6 62.3
2000h 53.5 54.8
120
T23 HRB 720℃
T23 HRB 740℃
Fit curve of T23 HRB 740℃
Fit curve of T23 HRB 720℃
T23 HRB 720℃
T23 HRB 740℃
Fit curve of T23 HRB 740℃
Fit curve of T23 HRB 720℃
0 500 1000 1500 2000
Aging time (Hrs)
100
80
60
40
20
0
HRB
Fig. 7 Hardness change due to degradation
Table 11 Hardness at 720°C
120100
80
60
40
20
0
HRB
20 21 22 23 24
LMP(C=20)
SA212-T23
HRB vs. LMP at 720℃
HRB vs. LMP at 740℃
Fit curve of T23 HRB vs LMP
Fig. 8 Corelation between yield strength and LMP
SA213-T23 Indentation test strength
Temp. Time Ts
Avg.(MPa) Ys Avg.(MPa)
Work hardning coefficient
720°C
New-Spe. 668.8 616.0 0.06
3 h 555.9 468.6 0.08
10 h 560.3 477.6 0.09
30 h 550.2 476.0 0.10
100 h 527.7 420.6 0.11
300 h 507.3 398.5 0.10
1000 h 460.6 295.3 0.09
1500 h 388.0 200.3 0.08
2000 h 388.9 196.2 0.09
Table 14 Indentation test result at 740°C SA213-T23 Indentation test strength
Temp. Time Ts
Avg.(MPa) Ys Avg.(MPa)
Work hardening coefficient
740°C
New-Spe. 668.8 616.0 0.06
3 h 558.1 428.3 0.13
10 h 550.6 427.9 0.14
30 h 519.4 421.3 0.13
100 h 503.3 420.6 0.11
300 h 487.9 416.8 0.10
1000 h 330.9 160.0 0.06
1500 h 325.4 158.7 0.15
2000 h 352.0 183.0 0.10
Table 13 Indentation test result at 720°C
현장의 가동 중인 구조물에 유용하게 적용할 수 있는 시험법으로 재료에 가해지는 압입 하중에 따른 압입깊 이를 연속적으로 측정하여 압입 하중-변위 곡선을 얻고 이 곡선의 분석을 통해 재료의 기계적 특성을 평가하는
기법으로 경도시험과 유사하나 압입자국을 직접관찰하 지 않고 재료의 유동특성, 잔류응력, 파괴인성 등을 측 정할 수 있는 시험법이다. Frontics사의 AIS3100을 이용하여 압입시험을 수행하였다(Table 13, 14).
가속열화온도 720℃ 및 740℃ 열화시간 1,000Hr 이상에
0 500 1000 1500 2000 Aging time (Hrs)
600
500
400
300
200
Stress(MPa)
T23 indentation UTS 720℃
T23 indentation UTS 740℃
Fit curve of T23 indentation UTS 740℃
Fit curve of T23 indentation UTS 720℃
T23 indentation UTS 720℃
T23 indentation UTS 740℃
Fit curve of T23 indentation UTS 740℃
Fit curve of T23 indentation UTS 720℃
SA213-T23
Fig. 9 Indentation test result of tensile strength changes to degradation time
Stress(MPa)
700
600
500
400
300
200
20 21 22 23 24
LMP(C=20)
T23 indentation UTS vs. LMP at 720℃
T23 indentation UTS vs. LMP at 740℃
Fit curve of T23 indentation UTS vs. LMP
SA213-T23
Fig. 10 Indentation test result of corelation between tensile strength and LMP due to degradation time
800
Stress(MPa)
T23 indentation YS 720℃
T23 indentation YS 740℃
Fit curve of T23 indentation YS 740℃
Fit curve of T23 indentation YS 720℃
T23 indentation YS 720℃
T23 indentation YS 740℃
Fit curve of T23 indentation YS 740℃
Fit curve of T23 indentation YS 720℃
600
400
200
0
0 500 1000 1500 2000
Aging time (Hrs)
SA213-T23
Fig. 11 Indentation test result of yield strength due to aging time
SA213-T23 600
500
400
300
200
100
0
Stress(MPa)
20 21 22 23 24
LMP (C=20)
T23 indentation YS vs. LMP at 720℃
T23 indentation YS vs. LMP at 740℃
Fit curve of T23 indentation YS vs. LMP
Fig. 12 Indentation test result of corelation between yield strength and LMP
Table 15 Hardness test during creep test
Steel Temp.
(℃) Load (MPa)
Time(Hr)
Tr20% Tr40% Tr60% Tr80% Rupture Time SA213-
T23 650 125 46.82 93.64 140.46 187.28 234.10
LMP
400 300 200
10090 8070 60 50 40 30 20
10
18 19 20 21 22
Stress(MPa)
SA213-T23 minimum Tr stress
Fig. 13 MPa vs LMP(℃)
서 급격히 감소하였다. 이것은 인장강도, 항복강도 및 경도값 의 감소현상과 유사함을 나타내었다(Fig. 9, 10, 11, 12).
2.7 크리프 시험 결과
크리프 시험은 모재부에 대하여 실험을 실시하였으며
우선 파단 시간까지 실험을 하여 그 시간을 20%으로 간격으로 실험을 멈춘 후 그에 대한 조직검사 및 경도 를 측정하였다(Table 15).
2.7.1 SA213-T23강의 Larson-Miller Parameter 회귀분석 식 (섭씨 기준)
2.7.2 조직사진 및 경도, 압입인장시험 결과
T23강의 경우 크리프 기공이 많이 발생하지 않았다.
이 강의 경우, 크리프 기공이 입계에 잘 생기지 않는
강이기 때문에 기공이 많이 발생하지 않은 것으로 판단
된다. 조직사진과 함께 각 크리프 수명 소비율에 따른
경도 및 압입인장시험 결과를 수록하였다(Table 16).
SA213-T23
구분 20% 40% 60% 80% 100%
OM (×400)
SEM (×1500)
Hardness
HV 168.7 163.3 158.1 158.9 149.1
Hardness
HRB 85.6 84.2 82.8 83.0 80.0
Indenta -tion
Ts
503.5 499.6 491.4 486.7 467.3
Indenta -tion
Ys
260.1 259.3 260.5 259.2 251.3
Table 17 Mechanical properties(Ts/Ys/ε/Hardness), metallograph and indentation Ts, Ys
Section New-Spe. A B C D E F
OM
SEM
Ts
(MPa) 605.5 595.5 574.4 520.9 455.0 415.5 390.9
Ys
(MPa) 527.2 483.0 462.0 394.4 298.4 224.1 175.4
ε
(1%) 30.3 29.5 29.1 32.8 32.8 34.8 34.7
Hardness
(HRB) 88.6 87.0 87.9 84.3 75.2 61.6 57.7
Indentation
Ts (MPa) 668.8 558.1 550.2 507.3 460.6 388.9 388.0
Indentation
Ys (MPa) 616.0 477.6 476.0 398.5 295.3 200.3 160.0
Table 16 Hardness by creep lifetime ratio and the results of indentation test
Microstructure Grades explanation
lifetime ratio (t/tr)
A bainitic structure 0
B
Initial spheroidisation carbides precipitation atand
grain boundary
0-01
C
Intermediate level of speroidisation, bainite is
partially globular but bainite structure is still
evident
0.2
D
Bainite completely spheroidised but carbides
still included in primary bainite grains
0.2-0.3
E
Carbides homogeneously distributed(no evidence
of ferrite and bainite original structure)
04-0.5
F
Carbides homogeneously distributed and partially
coarsened through coalesoence
Above 0.5
SA213-T23
20.5 21.0 21.5 22.0 22.5 23.0 23.5
LMP (X1000, C=20)
Degradation grade
F E D C B A
Fig. 14 Degradation grades and LMP line Table 18 Grades by metallographic degradation
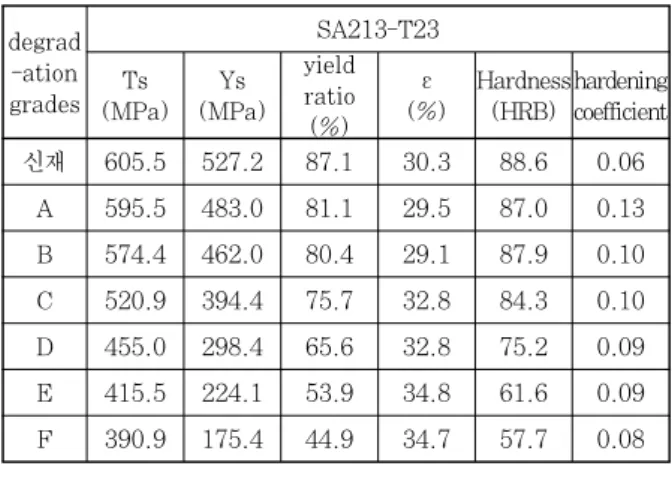
and lifespan(T23) degrad
-ation grades
SA213-T23 Ts
(MPa) Ys (MPa)
yield ratio
(%) ε (%)
Hardness (HRB)
hardening coefficient 신재 605.5 527.2 87.1 30.3 88.6 0.06
A 595.5 483.0 81.1 29.5 87.0 0.13 B 574.4 462.0 80.4 29.1 87.9 0.10 C 520.9 394.4 75.7 32.8 84.3 0.10 D 455.0 298.4 65.6 32.8 75.2 0.09 E 415.5 224.1 53.9 34.8 61.6 0.09 F 390.9 175.4 44.9 34.7 57.7 0.08
Degradation grade
New A B C D E F
0 20 40 60 80 100 200 300 400 500
600 SA213-T23
Data value
UTS(MPa)
YS(MPa)
Hardness(HRB) Yield ratio(%) Elongation(%)
Fig. 15 Mechanical characteristics by degradation grades
Table 19 Mecahnical properties by degradation grades
2.8 각종 물성 시험 결과
3. 결 론
본 연구결과로 좀 더 객관적이고 신뢰성 있는 수명평 가가 가능하고 열화정도에 따른 데이터베이스가 구축되 었다는데 의미가 있으며 미세조직변화에 의한 수명평가 (조직대비법) 가이드라인을 마련했다. 그리고 열화등급 별 기계적 특성 및 정량화에 대한 결론으로 다음과 같 은 특성을 얻어다.
1) 금속온도와 운전시간을 알면 LMP 식을 이용하여
해석적인 방법으로 열화정도를 예측 할 수 있다.
2) 인장강도, 항복강도 및 경도는 열화에 따라 일정하 게 감소하고 있어 신재를 알면 열화 등급을 평가할 수 있다.
3) 항복비가 신재에서 규칙적으로 감소하는 경향이 있고 감소폭도 크므로 잔존수명 정량화가 가능하다. 압 입인장강도기로 항복비를 측정하면 쉽게 열화정도를 평 가할 수 있다(신재에 비해 48.5% 감소).
4) 연신율과 경화지수는 변화폭이 적고 불규칙하여 수명을 정량화하기 어렵다.
References