Effectiveness and Safety of High-Flow Nasal Cannula Oxygen Delivery during
Bronchoalveolar Lavage in Acute Respiratory Failure Patients
Eun Jin Kim, M.D. , Chi Young Jung, M.D. and Kyung Chan Kim, M.D.
Department of Internal Medicine, Daegu Catholic University Medical Center, Daegu Catholic University School of Medicine, Daegu, Korea
Background: Bronchoalveolar lavage (BAL) is a necessary procedure for diagnosis of various lung diseases. High- flow nasal cannula (HFNC) oxygen delivery was recently introduced. This study aimed to investigate the safety and effectiveness of HFNC oxygen supply during BAL procedure in patients with acute respiratory failure (ARF).
Methods: Patients who underwent BAL while using HFNC at a partial pressure of oxygen in arterial blood/fraction of inspired oxygen (PaO
2/FiO
2; PF) ratio of 300 or below among patients who had been admitted from March 2013 to May 2017 were retrospectively investigated.
Results: Thirty-three BAL procedures were confirmed. Their baseline PF ratio was 166.1±46.7. FiO
2values before, during, and after BAL were 0.45±0.12, 0.74±0.19, and 0.57±0.14, respectively. Flow (L/min) values before, during, and after BAL were 26.5±20.3, 49.0±7.2, and 40.8±14.2, respectively. Both FiO
2and flow during and after the procedure were significantly different from those before the procedure (both p<0.001). Oxygen saturation levels before, during, and after BAL measured by pulse oximeter were 94.8±2.9, 94.6±3.5, and 95.2±2.8%, respectively. There were no significant differences in oxygen saturation among the three groups. Complications of BAL procedure included transient hypoxemia, hypotension, and fever. However, there was no endotracheal intubation within 24 hours. Baseline PF ratio in “without HFNC” group was significantly higher than that in “with HFNC” group. There were no differences in complications between the two groups.
Conclusion: The use of HFNC during BAL procedure in ARF patients was effective and safe. However, there were no significant differences in oxygen saturation level and complications comparing “without HFNC” group in mild ARF. More studies are needed for moderate to severe ARF patients.
Keywords: Bronchoalveolar Lavage; Bronchoscopy; Nasal Cannula; Oxygen; Respiratory Failure
Address for correspondence: Kyung Chan Kim, M.D.
Department of Internal Medicine, Daegu Catholic University Medical Center, Daegu Catholic University School of Medicine, 33 Duryugongwon-ro 17- gil, Nam-gu, Daegu 42472, Korea
Phone: 82-53-650-4294, Fax: 82-53-622-2072 E-mail: [email protected]
Received: Nov. 17, 2017, Revised: Jan. 29, 2018, Accepted: Apr. 22, 2018, Published online: Jun. 19, 2018
cc
It is identical to the Creative Commons Attribution Non-Commercial License (http://creativecommons.org/licenses/by-nc/4.0/).
Copyright © 2018
The Korean Academy of Tuberculosis and Respiratory Diseases.
Introduction
Bronchoalveolar lavage (BAL) under bronchoscopy is an important procedure that is helpful for the diagnosis of lung disease and for the prediction of the treatment progress and prognosis
1-4. Hypoxemia, however, may occur during BAL
5, and serious complications like endotracheal intubation (ETI) may occur after the procedure. In the past, noninvasive positive-pressure ventilation (NPPV) was used to prevent hy- poxemia when performing BAL
6,7, but NPPV has been seldom used because it is a time-consuming and very demanding technique, requiring experienced personnel and sufficient ad- aptation time for application to patients.
High-flow nasal cannula (HFNC) oxygen therapy is easy to use and is well-tolerated and comfortable; thus, it is currently being used as a noninvasive method of supplying oxygen to hypoxemic patients
8. Studies of acute respiratory failure (ARF) reported that the application of HFNC was proven to have had beneficial effects
9, showing superior effects compared to the conventional oxygen delivery system or NPPV
10.
Comparative studies using HFNC and NPPV during bron- choscopy on hypoxemic patients were recently reported
11,12. A study where HFNC was used during BAL on patients with ARF in the intensive care unit (ICU) has also been reported
13. As the number of patients reported was not big, however, it is not clear that the use of HFNC during BAL is reasonable.
Moreover, the safety of using HFNC has not been clearly es- tablished. Therefore, this study was conducted to investigate the safety and effectiveness on oxygenation of HFNC oxygen supply during BAL in patients with ARF.
Materials and Methods
1. Study subjects
A retrospective, single-center study was performed, and data were collected by searching medical records. Of the pa- tients who were admitted to the Department of Pulmonology, Daegu Catholic University Medical Center within the period from March 1, 2013, to May 31, 2017, the cases that met the following three inclusion criteria were targeted: (1) patients who underwent BAL during bronchoscopy; (2) patients with a partial pressure of oxygen in arterial blood/fraction of inspired oxygen (PaO
2/FiO
2; PF) ratio of 300 or less before bronchos- copy; and (3) patients for whom HFNC was used. Adopting Berlin’s definition of acute respiratory distress syndrome (ARDS), a PF ratio of 300 or less was considered ARF
14. The cases that met any of the following exclusion criteria were not included in the study: (1) patients for whom the use of HFNC was impossible; (2) patients who underwent ETI; and (3) pa- tients for whom mechanical ventilation, including NPPV, was applied. Data of the patients who did not use HFNC were also
collected if they met the criteria 1 and 2. This study had been approved by the Institutional Review Board of Daegu Catho- lic University Medical Center (IRB No. CR-17-089) and the requirement for written informed consent was waived due to retrospective study design.
2. Study protocol
The result of the arterial blood gas analysis performed with- in 48 hours before BAL was investigated, and the baseline PF ratio was calculated using this result. The severity of ARF was divided into three stages (mild, 200<PF ratio≤300; moderate, 100<PF ratio≤200; and severe, PF ratio≤100) based on Berlin’s definition of ARDS. Before performing BAL, the oxygen deliv- ery device, FiO
2, supplied oxygen flow, and oxygen saturation measured by pulse oximeter (SpO
2) were recorded. If the pa- tient was receiving oxygen through a nasal cannula, the FiO
2value was calculated as 0.24 for 1 L/min, 0.28 for 2 L/min, 0.32 for 3 L/min, 0.36 for 4 L/min, and 0.4 for 5 L/min. If the patient wore a simple oxygen mask, the FiO
2value was calculated as 0.4 for 5–6 L/min. If the patient was receiving more than 10 L/
min of oxygen with a mask with reservoir bag, the FiO
2value was calculated as 0.8
15. Additionally, the measured values of the FiO
2, flow, and SpO
2were examined during and after the BAL procedure. During the procedure, the FiO
2and flow of HFNC were increased to maintain a SpO
2value 90% or above, and the maximum values were recorded. Also, for the SpO
2value during the procedure, the value maintained in the FiO
2and flow states adjusted to the maximum value was recorded.
The complications that occurred during and within 24 hours after the BAL procedure were investigated. Hypoxemia referred to the case where the SpO
2value dropped to below 90%, and transient hypoxemia referred to the case where it was maintained for less than 30 seconds during the BAL pro- cedure. Hypotension was the case where the systolic blood pressure was less than 90 mm Hg or the diastolic blood pres- sure was less than 60 mm Hg
16. Fever was a body temperature of 37.8°C or higher measured at the tympanic membrane
17. Even if fever was already present before the BAL procedure, it was considered a procedure-related fever if the patient had a fever of 37.8°C or higher after the bronchoscopy. Several pre- vious studies
12,18-20concluded that ETI that occurred within 8 hours before completing bronchoscopy is directly associated with bronchoscopy. In this study, however, the occurrence of ETI within 24 hours after the completion of bronchoscopy was checked by applying stricter criteria, as in the study of La Combe et al.
13. And we followed cases for ETI until 2 weeks after the BAL procedure.
3. Definitions of pre-BAL and post-BAL diagnosis
In this study, pre-BAL diagnosis was defined as symptoms,
laboratory results and radiologic findings. Pre-BAL diagnosis
included bacterial pneumonia, atypical pneumonia, intersti- tial lung disease, and alveolar hemorrhage.
Post-BAL diagnosis was defined based on the following criteria. Bacterial pneumonia was defined as a case (1) where clinical manifestation of typical pneumonia (fever, increased cough with sputum production, a change in the shadow on the chest X-ray, increased inflammatory marker) was shown, and the presence of bacteria was proven in the BAL proce- dure; or (2) where clinical manifestation of typical pneumo- nia was shown but bacteria were not detected, neutrophil predominance appeared in the result of BAL, and the clinical manifestation was improved by antibiotics. Atypical pneumo- nia was defined as a case (1) where the presence of atypical microorganisms such as Pneumocystis jiroveci pneumonia, viral pneumonia, and fungal pneumonia was proven; (2) where clinical manifestation of pneumonia and evidence of infection were shown, but it was not typical, and causative or- ganisms were not proven; or (3) where aspiration pneumonia was present
21. Organizing pneumonia was defined as a case (1) where it was diagnosed through lung biopsy; or (2) where there were pneumonia-like chest X-ray findings, there was no evidence of infection, lymphocyte predominance was shown in the result of BAL, and the clinical manifestation improved after the use of steroids
22. Interstitial lung disease was defined as a case (1) where the lesions of interstitial pneumonia previ- ously diagnosed were aggravated; or (2) where the patient had a connective tissue disease showing aggravation of the lesions of interstitial pneumonia in the chest X-ray findings, and there was no evidence of infectious lung disease. Alveolar hemor- rhage was diagnosed after confirming it in the BAL fluid, and acute eosinophilic pneumonia was diagnosed in a case show- ing eosinophilia (>25%) in the BAL procedure. If differential diagnosis was difficult, the most likely clinical diagnosis was used as the post-BAL diagnosis.
Treatment changes were defined as changes in treatment occurring as a result of fluid examination obtained by the BAL procedure.
4. HFNC oxygen delivery
For HFNC, Optiflow (Fisher & Paykel, Auckland, New Zea- land) or AIRVO2 (Fisher & Paykel) was used. HFNC was ap- plied just before bronchoscopy, during the BAL procedure, and until the end of the bronchoscopy. If the SpO
2value was predicted to drop below 90% during the BAL procedure, the FiO
2and flow of HFNC were adjusted, and the values were maintained so that the SpO
2value would be 90% or above.
5. Fiberoptic bronchoscopy and BAL
All the bronchoscopy procedures were performed by three experienced (more than 10 years’ experience) respiratory specialists. Before the procedure, atropine and pethidine were
used to inhibit secretion and reduce the discomfort. For local anesthesia, lidocaine was nebulized into the nasal cavity and pharyngeal mucosa. First, the bronchoscope was inserted in the nasal cavity while oxygen was being supplied through the nose with HFNC. If it was difficult to insert the nasal cannula and bronchoscope at the same time, however, as the internal diameter of the nasal cavity was small, oxygen was supplied by inserting the nasal cannula in the oral cavity. After assess- ing the patient’s condition, sedation was induced using mid- azolam, if necessary. The bronchoscope was inserted in the trachea, and then lidocaine was sprayed into the carina. After that, the bronchi were examined, and the bronchoscope was wedged into the appropriate segmental bronchus. For BAL, normal saline was used, and after instilling 30 mL aliquots, gentle suction was done, which was repeated 5 times, with 1 time added or subtracted depending on the patient’s condi- tion. The bronchoscopy time was measured from the time of insertion of the bronchoscope to the time of its removal. After the procedure, flumazenil was used to reverse the effect of midazolam.
6. Statistical analysis
For the test results, if the absolute values, percentages, and continuous values met the normality assumption, the mean and standard deviation were presented, and if they did not, the median, maximum value, and minimum value were pre- sented. For the FiO
2, flow, SpO
2, and hemodynamic changes over time before, during, and after the BAL procedure under bronchoscopy, repeated-measure one-factor analysis was used. The differences in the implementation of ETI and in the immunosuppression status of the survivor and non-survivor groups were analyzed through Fisher exact test. Various quan- titative factors were compared through the Mann‒Whitney U test, and the difference in the post-BAL diagnosis was ana- lyzed through the chi-square test. The statistical significance level was set to p<0.05. For the statistical analysis, SPSS version 19.0 (SPSS Inc., Chicago, IL, USA) was used.
Results
1. Baseline characteristics of the patients
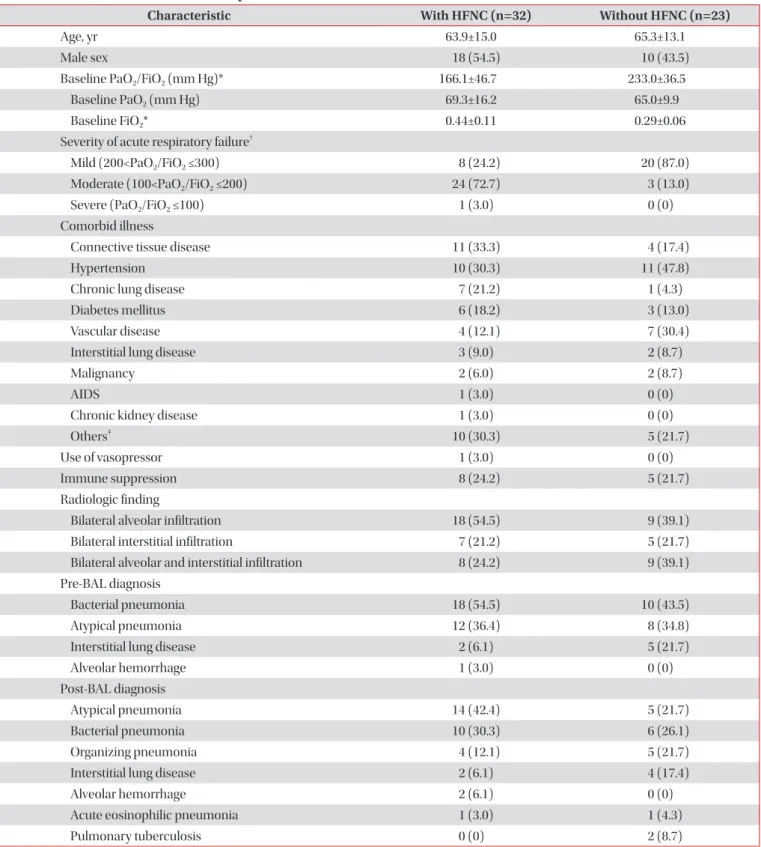
Of the patients who were admitted to Daegu Catholic Uni- versity Medical Center within the period from March 1, 2013, to May 31, 2017, a total of 32 patients met the inclusion crite- ria. Among them, one patient underwent BAL 2 times; thus, the total number of BAL procedures was 33. The mean age was 63.9±15.0 years, and the male-to-female ratio was 18:15.
The mean baseline PF ratio was 166.1±46.7, and the median
was 159.4 (range, 89.1–269.5). Before the BAL procedure, 19
cases of HFNC and 14 cases of nasal cannula were used as
Table 1. Baseline characteristics of the patients
Characteristic With HFNC (n=32) Without HFNC (n=23)
Age, yr 63.9±15.0 65.3±13.1
Male sex 18 (54.5) 10 (43.5)
Baseline PaO
2/FiO
2(mm Hg)* 166.1±46.7 233.0±36.5
Baseline PaO
2(mm Hg) 69.3±16.2 65.0±9.9
Baseline FiO
2* 0.44±0.11 0.29±0.06
Severity of acute respiratory failure
†Mild (200<PaO
2/FiO
2≤300) 8 (24.2) 20 (87.0)
Moderate (100<PaO
2/FiO
2≤200) 24 (72.7) 3 (13.0)
Severe (PaO
2/FiO
2≤100) 1 (3.0) 0 (0)
Comorbid illness
Connective tissue disease 11 (33.3) 4 (17.4)
Hypertension 10 (30.3) 11 (47.8)
Chronic lung disease 7 (21.2) 1 (4.3)
Diabetes mellitus 6 (18.2) 3 (13.0)
Vascular disease 4 (12.1) 7 (30.4)
Interstitial lung disease 3 (9.0) 2 (8.7)
Malignancy 2 (6.0) 2 (8.7)
AIDS 1 (3.0) 0 (0)
Chronic kidney disease 1 (3.0) 0 (0)
Others
‡10 (30.3) 5 (21.7)
Use of vasopressor 1 (3.0) 0 (0)
Immune suppression 8 (24.2) 5 (21.7)
Radiologic finding
Bilateral alveolar infiltration 18 (54.5) 9 (39.1)
Bilateral interstitial infiltration 7 (21.2) 5 (21.7)
Bilateral alveolar and interstitial infiltration 8 (24.2) 9 (39.1)
Pre-BAL diagnosis
Bacterial pneumonia 18 (54.5) 10 (43.5)
Atypical pneumonia 12 (36.4) 8 (34.8)
Interstitial lung disease 2 (6.1) 5 (21.7)
Alveolar hemorrhage 1 (3.0) 0 (0)
Post-BAL diagnosis
Atypical pneumonia 14 (42.4) 5 (21.7)
Bacterial pneumonia 10 (30.3) 6 (26.1)
Organizing pneumonia 4 (12.1) 5 (21.7)
Interstitial lung disease 2 (6.1) 4 (17.4)
Alveolar hemorrhage 2 (6.1) 0 (0)
Acute eosinophilic pneumonia 1 (3.0) 1 (4.3)
Pulmonary tuberculosis 0 (0) 2 (8.7)
Values are presented as mean±standard deviation or number (%).
*p<0.001, Mann-Whitney U test between “with HFNC” and “without HFNC” groups.
†p<0.001, through the chi-square test between “with HFNC” and “without HFNC” groups. The severity of acute respiratory failure was divided into three stages (mild, moderate and severe) based on Berlin’s definition of acute respiratory distress syndrome
14.
‡Others included atrial fibrillation, chronic liver disease, chronic pancreatitis, congestive heart failure, epilepsy, femur fracture, herniated nucleus pulposus, hypothyroidism, schizophrenia and spinal stenosis.
HFNC: high-flow nasal cannula; PaO
2: partial pressure of oxygen in arterial blood; FiO
2: fraction of inspired oxygen; AIDS: acquired immune
deficiency syndrome; BAL: bronchoalveolar lavage.
oxygen delivery devices. Eight cases (24.2%) were classified as mild ARF; 24 cases (72.7%) as moderate ARF; and one case (3%) as severe ARF. For the comorbidities, 11 cases (33.3%) had connective tissue disease, followed by 10 cases (30.3%) of hypertension and seven cases (21.2%) of chronic lung dis- ease, including chronic obstructive pulmonary disease, post- tuberculous destroyed lung, and bronchiectasis. Eight patients (24.2%) were under the immunosuppression state, in which immunosuppressants or steroids needed to be administered for a long time, such as patients with connective tissue dis- ease, interstitial lung disease, or acquired immune deficiency syndrome. Radiologic findings showed bilateral alveolar infil- tration in 18 cases (54.5%), bilateral interstitial infiltration in seven cases (21.2%) and bilateral alveolar and interstitial infil- tration in eight cases (24.2%). For the pre-BAL diagnosis, bac- terial pneumonia was the most common, on the other hand, for the post-BAL diagnosis, atypical pneumonia was the most common. Organizing pneumonia and acute eosinophilic pneumonia were newly diagnosed in the post-BAL diagnosis (Table 1). Atypical pneumonia included P. jiroveci pneumo- nia, viral pneumonia, fungal pneumonia, and unknown-cause pneumonia.
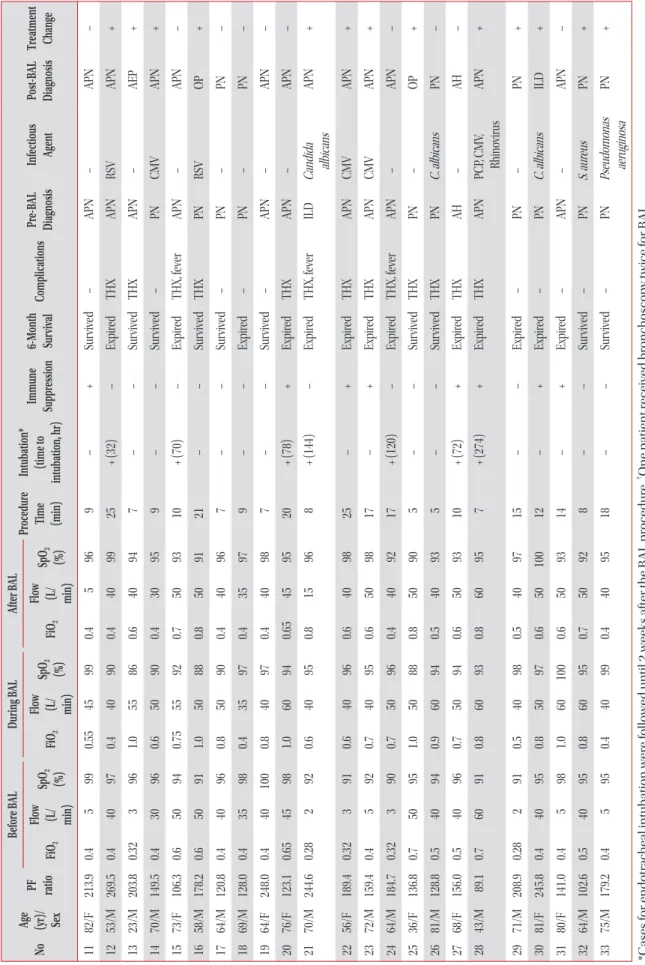
2. BAL procedure
BAL was successfully performed in all the patients. The time spent performing BAL was 14.4±7.2 minutes. The amount of normal saline infused during the BAL procedure was 140.9±27.5 mL, the amount of specimens obtained by BAL was 75.1±25.5 mL, and the recovery rate compared to the instilled volume was 53.1±14.5%. In terms of the BAL site in the bronchus, the right upper lobe had six cases, the right middle lobe had nine cases, the right lower lobe had 13 cases, the left upper lobe had one case, and the left lower lobe had four cases. Midazolam was injected during bronchoscopy in 26 cases, and the amount of injection was 2.67±1.0 mg. In 17 cases, flumazenil was administrated immediately after bron- choscopy, and the amount injected was 0.31±0.11 mg. The total cell counts of BAL fluid were 290/mL (range, 40–25,000/
mL) and the percentage of each cell was as follows: macro- phages 28% (range, 0%–76%), neutrophils 25% (range, 0%–
89%), lymphocytes 17% (range, 1%–71%), and eosinophils 1%
(range, 0%–53%). Infectious agents were identified in 16 cases as follows; bacteria in six cases, cytomegalovirus in four cases, fungus in three cases, P. jiroveci in three cases, and respiratory virus in three cases. After BAL procedure, the treatment plan was changed in 19 cases (57.6%) (Table 2).
3. SpO
2, FiO
2, and flow
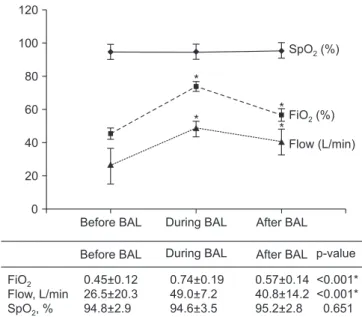
Before the BAL procedure, the FiO
2was 0.45±0.12, the flow was 26.5±20.3 L/min, and the SpO
2was 94.8±2.9%. During the BAL procedure, the FiO
2was 0.74±0.19, the flow was 49.0±7.2
Ta ble 2. C linic al s ta tus in 33 c as es of a cut e r es pir at or y f ailur es r ec eiv ed br on ch oalv eol ar l av ag e (B AL) usin g hi gh-flow n as al c ann ul a o xy gen del iv er y No Ag e (yr)/ Sex
PF ra tio
Befor e B AL Dur in g B AL Af ter B AL Pr oc edur e tim e (min) In tub ation* (tim e t o in tub ation, hr) Imm un e Suppr es sion 6-M on th sur viv al Com pl ica tions Pr e-B AL diag no sis Infe ctio us ag ent Po st-B AL diag no sis Tr ea tm en t ch an ge Fi O
2Flow (L/ min)
Sp O
2(%) Fi O
2Flow (L/ min) Sp O
2(%) Fi O
2Flow (L/ min)
Sp O
2(%) 1 80/F 109.6 0.7 40 93 0.9 40 98 0.8 40 90 20 + (26) – Expir ed THX, fe ver PN Acinet ob act er baumanii PN – 2 56/M 165.6 0.6 50 90 0.9 50 96 0.6 50 90 5 + (76) – Expir ed THX, fe ver ILD – ILD – 3 43/F 133.3 0.4 5 96 0.7 60 98 0.7 60 98 20 – – Expir ed Fe ver PN – AH + 4
†42/F 165.3 0.4 5 97 0.9 50 96 0.4 5 95 30 – – Expir ed Fe ver PN PCP APN + 5
†42/F 173.8 0.4 5 93 0.94 50 94 0.65 50 98 30 – – Expir ed THX, fe ver APN PCP APN – 6 71/M 159.3 0.4 5 98 0.5 50 98 0.5 50 96 20 – – Sur vive d Fe ver PN – PN – 7 83/M 138.9 0.45 47 98 0.7 47 96 0.5 47 97 20 – – Sur vive d – PN – OP + 8 73/F 115.8 0.5 50 90 0.9 50 95 0.6 50 98 15 – – Sur vive d – PN – OP + 9 56/M 200.0 0.4 30 98 0.56 50 91 0.5 40 99 15 – – Expir ed THX PN Staph ylo co cc us aur eus PN + 10 68/F 212.3 0.4 5 96 0.6 50 97 0.4 5 96 15 – – Sur vive d H yp ot ens ion PN A. b aumanii, S. aur eus PN + (C ontinue d)
Ta ble 2. Con tin u ed No Ag e (yr)/ Sex
PF ra tio
Befor e B AL Dur in g B AL Af ter B AL Pr oc edur e Tim e (min) In tub ation* (tim e t o in tub ation, hr) Imm un e Suppr es sion 6-M on th Sur viv al Com pl ica tions Pr e-B AL Diag no sis Infe ctio us Ag ent Po st-B AL Diag no sis Tr ea tm en t Ch an ge Fi O
2Flow (L/ min)
Sp O
2(%) Fi O
2Flow (L/ min) Sp O
2(%) Fi O
2Flow (L/ min)
Sp O
2(%) 11 82/F 213.9 0.4 5 99 0.55 45 99 0.4 5 96 9 – + Sur vive d – APN – APN – 12 53/M 269.5 0.4 40 97 0.4 40 90 0.4 40 99 25 + (32) – Expir ed THX APN RSV APN + 13 23/M 203.8 0.32 3 96 1.0 55 86 0.6 40 94 7 – – Sur vive d THX APN – AEP + 14 70/M 149.5 0.4 30 96 0.6 50 90 0.4 30 95 9 – – Sur vive d – PN CMV APN + 15 73/F 106.3 0.6 50 94 0.75 55 92 0.7 50 93 10 + (70) – Expir ed THX, fe ver APN – APN – 16 58/M 178.2 0.6 50 91 1.0 50 88 0.8 50 91 21 – – Sur vive d THX PN RSV OP + 17 64/M 120.8 0.4 40 96 0.8 50 90 0.4 40 96 7 – – Sur vive d – PN – PN – 18 69/M 128.0 0.4 35 98 0.4 35 97 0.4 35 97 9 – – Expir ed – PN – PN – 19 64/F 248.0 0.4 40 100 0.8 40 97 0.4 40 98 7 – – Sur vive d – APN – APN – 20 76/F 123.1 0.65 45 98 1.0 60 94 0.65 45 95 20 + (78) + Expir ed THX APN – APN – 21 70/M 244.6 0.28 2 92 0.6 40 95 0.8 15 96 8 + (144) – Expir ed THX, fe ver ILD Candid a albic ans APN + 22 56/F 189.4 0.32 3 91 0.6 40 96 0.6 40 98 25 – + Expir ed THX APN CMV APN + 23 72/M 159.4 0.4 5 92 0.7 40 95 0.6 50 98 17 – + Expir ed THX APN CMV APN + 24 64/M 184.7 0.32 3 90 0.7 50 96 0.4 40 92 17 + (120) – Expir ed THX, fe ver APN – APN – 25 36/F 136.8 0.7 50 95 1.0 50 88 0.8 50 90 5 – – Sur vive d THX PN – OP + 26 81/M 128.8 0.5 40 94 0.9 60 94 0.5 40 93 5 – – Sur vive d THX PN C. albic ans PN – 27 68/F 156.0 0.5 40 96 0.7 50 94 0.6 50 93 10 + (72) + Expir ed THX AH – AH – 28 43/M 89.1 0.7 60 91 0.8 60 93 0.8 60 95 7 + (274) + Expir ed THX APN PCP , CMV , Rhinovirus APN + 29 71/M 208.9 0.28 2 91 0.5 40 98 0.5 40 97 15 – – Expir ed – PN – PN + 30 81/F 245.8 0.4 40 95 0.8 50 97 0.6 50 100 12 – + Expir ed – PN C. albic ans ILD + 31 80/F 141.0 0.4 5 98 1.0 60 100 0.6 50 93 14 – + Expir ed – APN – APN – 32 64/M 102.6 0.5 40 95 0.8 60 95 0.7 50 92 8 – – Sur vive d – PN S. aur eus PN + 33 75/M 179.2 0.4 5 95 0.4 40 99 0.4 40 95 18 – – Sur vive d – PN Pseudomonas aeruginos a PN + *C ases for endotr ac he al int ub ation wer e followe d until 2 we eks aft er the B AL pr oce dur e.
†O ne p atient r eceive d br onc hoscopy t wice for B AL . P F r atio: b aseline P aO
2/F iO
2; F iO
2: fr action of ins pir ed o xy gen; F low: g as flow r at e; S pO
2: o xy gen s at ur ation r ecor de d by pulse o ximetr y; F : female; THX : tr ans ient h yp ox emi a; P N: bact eri al pneumoni a; M: male; ILD: int er stiti al lung dise ase; AH: alve ol ar hemorr hag e; P CP : Pneumo cy stis jir ove ci pneumoni a; AP N: at ypic al pneumoni a; OP : or ganizing pneu - moni a; RS V: r es pir at or y s ync yti al virus ; AEP : ac ut e e os inophilic pneumoni a; CMV: c yt ome galovirus .
L/min, and the SpO
2was 94.6±3.5%. After the BAL procedure, the FiO
2was 0.57±0.14, the flow was 40.8±14.2 L/min, and the SpO
2was 95.2±2.8%. There were no differences in SpO
2among the three groups (p=0.651), but there were statisti- cally significant differences in FiO
2and flow during and after the BAL procedure compared to before the BAL procedure (p<0.001) (Figure 1).
4. Hemodynamic changes
The systolic blood pressure was 114.9±15.8 mm Hg be- fore the BAL procedure, 120.3±22.5 mm Hg during the BAL procedure, and 119.2±19.0 mm Hg after the BAL procedure (p=0.201). As for the diastolic blood pressure, it was 68.0±10.0 mm Hg before the BAL procedure, 73.4±12.6 during the BAL procedure, and 71.6±11.5 mm Hg after the procedure (p=0.025). Before the procedure, there was no difference in the systolic blood pressure, but the diastolic blood pressure significantly increased during and after the BAL procedure compared to before the BAL procedure. The heart rate per minute was 90.5±13.5 times before the procedure, 104.7±17.1 times during the procedure, and 98.7±13.5 times after the pro- cedure, showing statistically significant differences (p<0.001) (Figure 2).
5. Complications of the BAL procedure
During the BAL procedure, transient hypoxemia appeared in 17 cases (51.5%), SpO
2was maintained 90% or above by in- creasing the FiO
2and flow. There was no hypoxemia, however, that lasted for more than 30 seconds. Hypotension occurred in one case (3%), but the patient recovered after 30 minutes through fluid hydration and the use of inotropics. This case was associated with sepsis caused by bacterial pneumonia.
Deterioration of the clinical status due to hypotension was not observed. After the BAL procedure, fever was developed in nine cases (27.3%). In five cases, fever that was not present before the bronchoscopy occurred after the bronchoscopy,
Table 3. Complications of the bronchoalveolar lavage Complications With HFNC Without HFNC During bronchoalveolar lavage
Transient hypoxemia* 17 (51.5) 9 (39.1)
Hypotension
†1 (3.0) 0 (0)
After bronchoalveolar lavage
Fever
‡9 (27.3) 3 (13.0)
ETI within 24 hours 0 (0) 0 (0)
Values are presented as number (%).
*Transient hypoxemia referred to the case where the SpO
2value dropped to below 90% was maintained for less than 30 seconds during the bronchoalveolar lavage procedure.
†Hypotension was the case where the systolic blood pressure was less than 90 mm Hg or the diastolic blood pressure was less than 60 mm Hg
16.
‡Fever was a body temperature of 37.8°C or higher measured at the tym- panic membrane
17.
HFNC: high-flow nasal cannula; ETI: endotracheal intubation;
SpO
2: oxygen saturation recorded by pulse oximetry.
Figure 1. Changes in saturation measured by pulse oximeter (SpO
2), fraction of inspired oxygen (FiO
2), and gas flow rate before, during and after the bronchoalveolar lavage (BAL) using high-flow nasal cannula oxygen delivery. The FiO
2values in the table are shown as percent (%) in the graph. *p<0.001, Multiple comparison result by contrast between before BAL and during BAL, before BAL and after BAL, respectively.
SpO (%)
2FiO (%)
2Flow (L/min) 120
100
80
60
40
20
0
FiO Flow, L/min SpO , %
2
2
Before BAL During BAL After BAL p-value 0.74 0.19
49.0 7.2 94.6 3.5
+ + +
0.57 0.14 40.8 14.2 95.2 2.8
+ + +
<0.001*
<0.001*
0.651 Before BAL During BAL After BAL
*
*
* *
0.45+0.12 26.5 20.3 94.8 2.9
+ +
Systolic BP (mmHg) Heart rate (/min)
Diastolic BP (mmHg) 140
100
80
60
0
Before BAL During BAL After BAL