Preventive Medicine
& Public Health Preventive Medicine
& Public Health
J Prev Med Public Health 2016;49:275-287 • http://dx.doi.org/10.3961/jpmph.16.025C-reactive Protein Concentration Is Associated With a Higher Risk of Mortality in a Rural Korean Population
Jung Hyun Lee1, Hyungseon Yeom2, Hyeon Chang Kim2, Il Suh2, Mi Kyung Kim3, Min-Ho Shin4, Dong Hoon Shin5, Sang-Baek Koh6,7, Song Vogue Ahn6,7, Tae-Yong Lee8, So Yeon Ryu9, Jae-Sok Song10, Hong-Soon Choe10,
Young-Hoon Lee11, Bo Youl Choi3
1Graduate School of Public Health, Yonsei University, Seoul; 2Department of Preventive Medicine, Yonsei University College of Medicine, Seoul;
3Department of Preventive Medicine, Hanyang University College of Medicine, Seoul; 4Department of Preventive Medicine, Chonnam National University Medical School, Gwangju; 5Department of Preventive Medicine, Keimyung University School of Medicine, Daegu; 6Department of Preventive Medicine, Yonsei University Wonju College of Medicine, Wonju; 7Institute of Genomic Cohort, Yonsei University Wonju College of Medicine, Wonju; 8Department of Preventive Medicine, Chungnam National University School of Medicine, Daejeon; 9Department of Preventive Medicine, Chosun University Medical School, Gwangju; 10Department of Preventive Medicine and Institute of Catholic Kwandong University College of Medicine, Gangneung; 11Department of Preventive Medicine and Institute of Wonkwang Medical Science, Wonkwang University School of Medicine, Iksan, Korea
Original Article
Objectives: C-reactive protein (CRP), an inflammatory biomarker, has been widely used as a preclinical marker predictive of morbidity and mortality. Although many studies have reported a positive association between CRP and mortality, uncertainty still remains about this association in various populations, especially in rural Korea.
Methods: A total of 23 233 middle-aged participants (8862 men and 14 371 women) who were free from cardiovascular disease, can- cer, and acute inflammation (defined by a CRP level ≥10 mg/L) were drawn from 11 rural communities in Korea between 2005 and 2011. Blood CRP concentration was analyzed as a categorical variable (low: 0.0-0.9 mg/L; intermediate: 1.0-3.0 mg/L; high: 3.1-9.9 mg/L) as well as a continuous variable. Each participant’s vital status through December 2013 was confirmed by death statistics from the Na- tional Statistical Office. Cox proportional hazard models were used to assess the independent association between CRP and mortality after adjusting for other risk factors.
Results: The total quantity of observed person-years was 57 975 for men and 95 146 for women, and the number of deaths was 649 among men and 367 among women. Compared to the low-CRP group, the adjusted hazard ratio for all-cause mortality of the inter- mediate group was 1.17 (95% confidence interval [CI], 0.98 to 1.40) for men and 1.27 (95% CI, 1.01 to 1.61) for women, and the corre- sponding values for the high-CRP group were 1.98 (95% CI, 1.61 to 2.42) for men and 1.41 (95% CI, 1.03 to 1.95) for women. Similar trends were found for CRP evaluated as a continuous variable and for cardiovascular mortality.
Conclusions: Higher CRP concentrations were associated with higher mortality in a rural Korean population, and this association was more prominent in men than in women.
Key words: C-reactive protein, Mortality, Cardiovascular diseases, Rural population, Republic of Korea
Received: February 29, 2016 Accepted: August 18, 2016 Corresponding author: Hyeon Chang Kim, MD, PhD 50-1 Yonsei-ro, Seodaemun-gu, Seoul 03722, Korea.
Tel: +82-2-2228-1873, Fax: +82-2-392-8133 E-mail: [email protected]
This is an Open Access article distributed under the terms of the Creative Commons Attribution Non-Commercial License (http://creativecommons.org/licenses/by- nc/4.0/) which permits unrestricted non-commercial use, distribution, and repro- duction in any medium, provided the original work is properly cited.
pISSN 1975-8375 eISSN 2233-4521
INTRODUCTION
Chronic inflammation has been considered to be an emerg- ing risk factor for many chronic diseases, such as cancers and cardiovascular disease (CVD) [1-3]. C-reactive protein (CRP) is a widely used inflammatory marker, and reflects both acute and chronic inflammation status. Although many other biomarkers
indicate inflammation status, such as fibrinogen levels, white cell count, and erythrocyte sedimentation rate, CRP is the only established biomarker that can be used for risk assessment as part of the primary prevention of CVD [4,5]. Several studies have reported associations between CRP and the incidence of vascular and non-vascular disease [6,7], as well as associations between CRP and cause-specific and all-cause mortality [8- 11]. Recently, some articles have suggested that these associa- tions may be affected by the presence of other risk factors for CVD [12-16]. It is not clear whether CRP is directly associated with mortality or is associated with mortality due to the pres- ence of other risk factors, such as hypertension.
In addition, most previous studies addressing associations between CRP and mortality have reported findings from West- ern populations [7,12,17]. Although some studies have been carried out in East Asia, few studies have dealt with rural popu- lations [6,11,13]. Differently distributed blood concentrations of CRP have been found in different ethnic groups, and the re- lationship between mortality and CRP has been found to vary between rural and urban areas due to distinct lifestyle factors [18-20]. The role of CRP in predicting risk for CVD and mortality appears to be different from population to population. To the best of our knowledge, no previous research has assessed the association between CRP and all-cause mortality in a rural Ko- rean population. Thus, we aimed to evaluate the association of CRP with all-cause mortality and cardiovascular mortality in rural regions in Korea. Additionally, we aimed to determine whether the association between CRP and all-cause mortality was modified by the presence of hypertension.
METHODS
Study Participants
We used data from the Korean Genome and Epidemiology Study - Cardiovascular Disease Association Study (KoGES_CA- VAS). The aims, recruitment criteria, and baseline characteris- tics of KoGES_CAVAS have been described in more detail else- where [21]. In brief, a total of 28 338 community dwellers (age
≥40 years) were recruited from 11 rural communities in Korea from 2005 to 2011. In eight communities, the study partici- pants were recruited beginning in 2005, and those in the other three communities were recruited beginning in 2006. The fol- low-up is ongoing, and in this study, we assessed mortality cases based on data from the National Statistical Office. We ex- cluded 2346 participants with a history of stroke, angina, myo-
cardial infarction, or cancer, and then excluded 484 partici- pants due to evidence of acute inflammation (CRP ≥10 mg/L).
Next, we excluded 227 participants whose vital status could not be confirmed, as well as 1604 participants whose CRP con- centrations were not measured. Finally, we excluded 442 par- ticipants due to missing data in some independent variables, as well as two participants who died in the same month that they were enrolled in the study. Thus, a total of 23 233 people (8862 men and 14 371 women) were included in the final anal- ysis. All participants provided written informed consent, and the study protocol was approved by the institutional review board of each institution that participated in KoGES_CAVAS.
Data Collection
Information about demographic factors, socioeconomic sta- tus, health behaviors, and disease history were collected using a standardized questionnaire. Educational status was used to represent socioeconomic status, and was defined as elemen- tary school or below, middle school, high school, and universi- ty or above. Non-smokers were defined as those who had con- sumed less than 400 cigarettes over the course of their lifetime [22]. Participants who had consumed 400 or more cigarettes were categorized into two groups: former smokers, who ab- stained from smoking at the time of the questionnaire, and current smokers, who persisted in smoking. Participants were divided according to their alcohol consumption as never drink- ers, former drinkers, and current drinker. Never drinkers were defined as those who had never consumed an alcoholic drink over the course of their lifetime, for physical or other reasons.
Former drinkers were defined as participants who abstained from drinking at the time of the questionnaire, while current drinkers were defined as those who persisted in consuming al- cohol. Participants were classified in terms of regular exercise based on ‘yes’ and ‘no’ answers to the following question. “Do you currently engage in regular exercise strenuous enough to cause you to break into a sweat at least once per week?”
Anthropometric measurements were also obtained using standardized methods. Body mass index (BMI) was calculated as weight (kg) divided by height squared (m2). Participants were defined into four classes based on BMI: underweight (BMI <18.5 kg/m2), normal (18.5≤ BMI <23.0 kg/m2), over- weight (23.0≤ BMI <25.0 kg/m2), and obesity (BMI ≥25.0 kg/
m2), according to the World Health Organization classification of BMI in adult Asians [23]. Systolic blood pressure (SBP) and diastolic blood pressure (DBP) were measured twice in the
right arm using a standardized mercury or automatic sphyg- momanometer depending on the institution. Participants were seated for at least five minutes before the blood pressure measurements, and the mean of the two blood pressure read- ings was recorded for data analysis. Laboratory evaluations were performed using blood samples obtained after partici- pants had fasted overnight. Blood concentrations of glucose, total cholesterol, high-density lipoprotein (HDL) cholesterol, and triglycerides were measured using the enzyme method (ADVIA 1650 and ADVIA 1800; Siemens Healthineers, Deer- field, IL, USA). Low-density lipoprotein (LDL) cholesterol levels were calculated using the Friedewald formula [24] in individu- als with blood triglyceride levels <4.52 mmol/L. CRP was measured using a turbidimetric immunoassay (ADVIA 1650 and ADVIA 1800; Siemens Healthineers). Hypertension was considered to be present when the SBP was at least 140 mmHg, the DBP was at least 90 mmHg, or if hypertension was self-reported based on a physician’s diagnosis. Diabetes was defined as a fasting blood glucose level ≥7.0 mmol/L, or a self-reported physician’s diagnosis. Dyslipidemia was defined based on a total cholesterol level ≥5.957 mmol/L, an LDL cholesterol level ≥3.885 mmol/L, an HDL cholesterol level
<1.036 mmol/L, a triglyceride level ≥2.260 mmol/L, or a self- reported physician’s diagnosis. Other diseases, such as stroke, angina, and myocardial infarction, were defined only based on a self-reported physician’s diagnosis.
The outcome of our study was mortality. To verify partici- pants’ vital status, their records in our study were cross- checked with death statistics from the National Statistical Of- fice via the Korea Centers for Disease Control and Prevention using an anonymized form through December 2013. Cardio- vascular mortality was evaluated according to the Internation- al Classification of Diseases, 10th revision. Deaths caused by diseases in the circulatory system (I00-I99) were considered to be cardiovascular deaths. As the follow-up period, we used the period between the month in which each participant first par- ticipated in the study and the month of death, or December 2013 for surviving participants.
Statistical Analysis
Gender-stratified analyses were performed. Blood CRP con- centrations were classified into the following three groups, ac- cording to the National Academy of Clinical Biochemistry Lab- oratory Medicine Practice Guidelines (NACB LMPG): low (CRP
<1.0 mg/L), intermediate (1.0≤ CRP ≤3.0 mg/L), and high
(CRP >3.0 mg/L) [5]. To identify category-free associations, blood CRP concentrations were also analyzed as a continuous variable. Continuous variables are represented by mean and standard deviation (SD), or median and interquartile range for skewed variables (skewness >|2|). Categorical variables are represented as number and percentage. We used the t-test, analysis of variance, the Mann-Whitney test, the Kruskal-Wallis test, and the chi-square test for comparisons. We estimated hazard ratios (HRs) and 95% confidence intervals (CIs) be- tween CRP and mortality using the Cox proportional hazard model. The proportional hazard assumption was assessed by including interactions with time as time-dependent covariates in our model, and no obvious violations were found (p for pro- portional test >0.05). As adjustment variables, we selected age, rural region, BMI, educational status, alcohol use, smok- ing status, regular exercise, the presence of disease (hyperten- sion, diabetes, and dyslipidemia), SBP, DBP, and fasting con- centrations of blood glucose, total cholesterol, triglycerides, and HDL cholesterol. Adjustment variables were selected based on previous studies [11,13,17]. We employed restricted cubic splines (RCSs) to evaluate the possibility of complex (i.e., non-linear) hazard functions [25]. In this method, we selected five CRP concentration values as knots based on CRP concen- tration percentiles, tested the linear and non-linear associa- tions between knots using a cubic function, and presented the integrated graph smoothly. Since the RCS could be affected by outliers, we excluded values lower than the 1st percentile and greater than the 99th percentile. An interaction term was cre- ated between hypertension status and CRP and was added into the Cox proportional hazard model. Sensitivity analysis was performed by excluding deaths that occurred within two years from the month that each participant first participated in the study in order to rule out deaths caused by unknown underlying diseases. Since blood CRP concentrations were right-skewed, another sensitivity analysis was performed us- ing log-transformed blood CRP concentrations. All statistical analyses were performed using SAS version 9.3 (SAS Institute Inc., Cary, NC, USA), and RCS analysis was carried out using the SAS LGTPHCURV9 macro [26]. The p-values <0.05 were de- fined as indicating statistical significance.
RESULTS
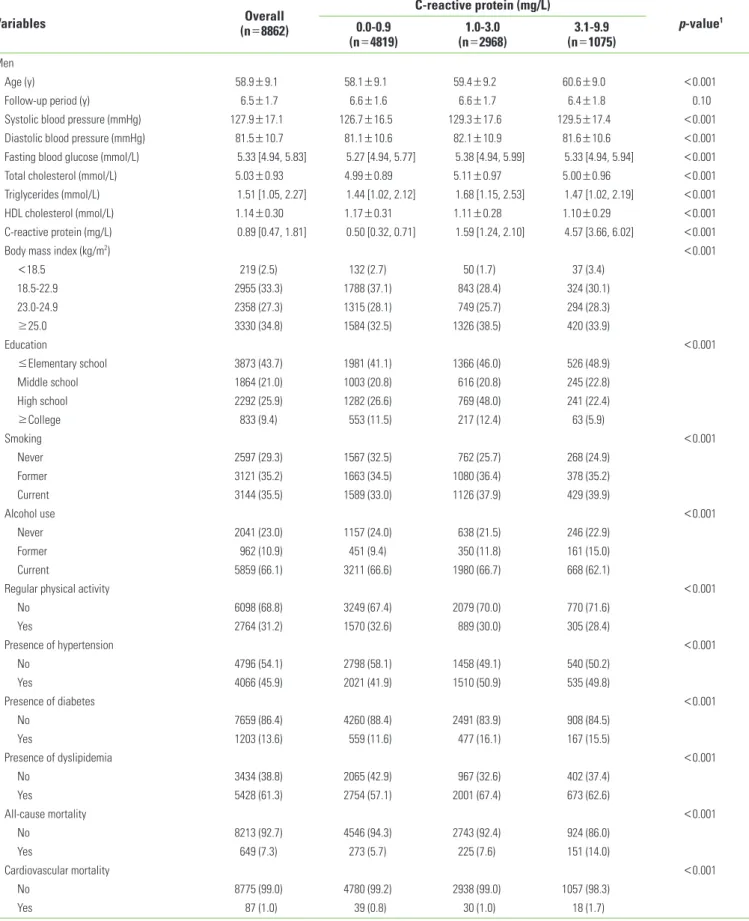
Table 1 shows the baseline characteristics of the study par- ticipants. The overall mean age was 58.9 years (SD, 9.1 years),
Table 1. Baseline characteristics of participants by C-reactive protein category by gender
Variables Overall
(n=8862)
C-reactive protein (mg/L)
p-value1 0.0-0.9
(n=4819) 1.0-3.0
(n=2968) 3.1-9.9
(n=1075) Men
Age (y) 58.9±9.1 58.1±9.1 59.4±9.2 60.6±9.0 <0.001
Follow-up period (y) 6.5±1.7 6.6±1.6 6.6±1.7 6.4±1.8 0.10
Systolic blood pressure (mmHg) 127.9±17.1 126.7±16.5 129.3±17.6 129.5±17.4 <0.001
Diastolic blood pressure (mmHg) 81.5±10.7 81.1±10.6 82.1±10.9 81.6±10.6 <0.001
Fasting blood glucose (mmol/L) 5.33 [4.94, 5.83] 5.27 [4.94, 5.77] 5.38 [4.94, 5.99] 5.33 [4.94, 5.94] <0.001
Total cholesterol (mmol/L) 5.03±0.93 4.99±0.89 5.11±0.97 5.00±0.96 <0.001
Triglycerides (mmol/L) 1.51 [1.05, 2.27] 1.44 [1.02, 2.12] 1.68 [1.15, 2.53] 1.47 [1.02, 2.19] <0.001
HDL cholesterol (mmol/L) 1.14±0.30 1.17±0.31 1.11±0.28 1.10±0.29 <0.001
C-reactive protein (mg/L) 0.89 [0.47, 1.81] 0.50 [0.32, 0.71] 1.59 [1.24, 2.10] 4.57 [3.66, 6.02] <0.001
Body mass index (kg/m2) <0.001
<18.5 219 (2.5) 132 (2.7) 50 (1.7) 37 (3.4)
18.5-22.9 2955 (33.3) 1788 (37.1) 843 (28.4) 324 (30.1)
23.0-24.9 2358 (27.3) 1315 (28.1) 749 (25.7) 294 (28.3)
≥25.0 3330 (34.8) 1584 (32.5) 1326 (38.5) 420 (33.9)
Education <0.001
≤Elementary school 3873 (43.7) 1981 (41.1) 1366 (46.0) 526 (48.9)
Middle school 1864 (21.0) 1003 (20.8) 616 (20.8) 245 (22.8)
High school 2292 (25.9) 1282 (26.6) 769 (48.0) 241 (22.4)
≥College 833 (9.4) 553 (11.5) 217 (12.4) 63 (5.9)
Smoking <0.001
Never 2597 (29.3) 1567 (32.5) 762 (25.7) 268 (24.9)
Former 3121 (35.2) 1663 (34.5) 1080 (36.4) 378 (35.2)
Current 3144 (35.5) 1589 (33.0) 1126 (37.9) 429 (39.9)
Alcohol use <0.001
Never 2041 (23.0) 1157 (24.0) 638 (21.5) 246 (22.9)
Former 962 (10.9) 451 (9.4) 350 (11.8) 161 (15.0)
Current 5859 (66.1) 3211 (66.6) 1980 (66.7) 668 (62.1)
Regular physical activity <0.001
No 6098 (68.8) 3249 (67.4) 2079 (70.0) 770 (71.6)
Yes 2764 (31.2) 1570 (32.6) 889 (30.0) 305 (28.4)
Presence of hypertension <0.001
No 4796 (54.1) 2798 (58.1) 1458 (49.1) 540 (50.2)
Yes 4066 (45.9) 2021 (41.9) 1510 (50.9) 535 (49.8)
Presence of diabetes <0.001
No 7659 (86.4) 4260 (88.4) 2491 (83.9) 908 (84.5)
Yes 1203 (13.6) 559 (11.6) 477 (16.1) 167 (15.5)
Presence of dyslipidemia <0.001
No 3434 (38.8) 2065 (42.9) 967 (32.6) 402 (37.4)
Yes 5428 (61.3) 2754 (57.1) 2001 (67.4) 673 (62.6)
All-cause mortality <0.001
No 8213 (92.7) 4546 (94.3) 2743 (92.4) 924 (86.0)
Yes 649 (7.3) 273 (5.7) 225 (7.6) 151 (14.0)
Cardiovascular mortality <0.001
No 8775 (99.0) 4780 (99.2) 2938 (99.0) 1057 (98.3)
Yes 87 (1.0) 39 (0.8) 30 (1.0) 18 (1.7)
( Continued to the next page)
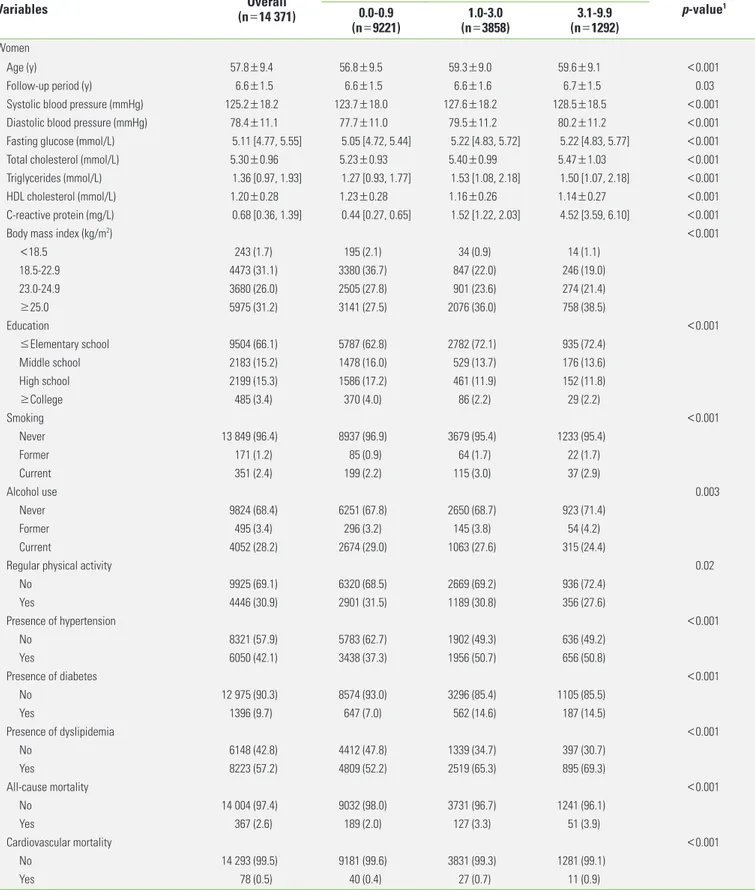
Table 1. Continued from the previous page
Variables Overall
(n=14 371)
C-reactive protein (mg/L)
p-value1 0.0-0.9
(n=9221) 1.0-3.0
(n=3858) 3.1-9.9
(n=1292) Women
Age (y) 57.8±9.4 56.8±9.5 59.3±9.0 59.6±9.1 <0.001
Follow-up period (y) 6.6±1.5 6.6±1.5 6.6±1.6 6.7±1.5 0.03
Systolic blood pressure (mmHg) 125.2±18.2 123.7±18.0 127.6±18.2 128.5±18.5 <0.001
Diastolic blood pressure (mmHg) 78.4±11.1 77.7±11.0 79.5±11.2 80.2±11.2 <0.001
Fasting glucose (mmol/L) 5.11 [4.77, 5.55] 5.05 [4.72, 5.44] 5.22 [4.83, 5.72] 5.22 [4.83, 5.77] <0.001
Total cholesterol (mmol/L) 5.30±0.96 5.23±0.93 5.40±0.99 5.47±1.03 <0.001
Triglycerides (mmol/L) 1.36 [0.97, 1.93] 1.27 [0.93, 1.77] 1.53 [1.08, 2.18] 1.50 [1.07, 2.18] <0.001
HDL cholesterol (mmol/L) 1.20±0.28 1.23±0.28 1.16±0.26 1.14±0.27 <0.001
C-reactive protein (mg/L) 0.68 [0.36, 1.39] 0.44 [0.27, 0.65] 1.52 [1.22, 2.03] 4.52 [3.59, 6.10] <0.001
Body mass index (kg/m2) <0.001
<18.5 243 (1.7) 195 (2.1) 34 (0.9) 14 (1.1)
18.5-22.9 4473 (31.1) 3380 (36.7) 847 (22.0) 246 (19.0)
23.0-24.9 3680 (26.0) 2505 (27.8) 901 (23.6) 274 (21.4)
≥25.0 5975 (31.2) 3141 (27.5) 2076 (36.0) 758 (38.5)
Education <0.001
≤Elementary school 9504 (66.1) 5787 (62.8) 2782 (72.1) 935 (72.4)
Middle school 2183 (15.2) 1478 (16.0) 529 (13.7) 176 (13.6)
High school 2199 (15.3) 1586 (17.2) 461 (11.9) 152 (11.8)
≥College 485 (3.4) 370 (4.0) 86 (2.2) 29 (2.2)
Smoking <0.001
Never 13 849 (96.4) 8937 (96.9) 3679 (95.4) 1233 (95.4)
Former 171 (1.2) 85 (0.9) 64 (1.7) 22 (1.7)
Current 351 (2.4) 199 (2.2) 115 (3.0) 37 (2.9)
Alcohol use 0.003
Never 9824 (68.4) 6251 (67.8) 2650 (68.7) 923 (71.4)
Former 495 (3.4) 296 (3.2) 145 (3.8) 54 (4.2)
Current 4052 (28.2) 2674 (29.0) 1063 (27.6) 315 (24.4)
Regular physical activity 0.02
No 9925 (69.1) 6320 (68.5) 2669 (69.2) 936 (72.4)
Yes 4446 (30.9) 2901 (31.5) 1189 (30.8) 356 (27.6)
Presence of hypertension <0.001
No 8321 (57.9) 5783 (62.7) 1902 (49.3) 636 (49.2)
Yes 6050 (42.1) 3438 (37.3) 1956 (50.7) 656 (50.8)
Presence of diabetes <0.001
No 12 975 (90.3) 8574 (93.0) 3296 (85.4) 1105 (85.5)
Yes 1396 (9.7) 647 (7.0) 562 (14.6) 187 (14.5)
Presence of dyslipidemia <0.001
No 6148 (42.8) 4412 (47.8) 1339 (34.7) 397 (30.7)
Yes 8223 (57.2) 4809 (52.2) 2519 (65.3) 895 (69.3)
All-cause mortality <0.001
No 14 004 (97.4) 9032 (98.0) 3731 (96.7) 1241 (96.1)
Yes 367 (2.6) 189 (2.0) 127 (3.3) 51 (3.9)
Cardiovascular mortality <0.001
No 14 293 (99.5) 9181 (99.6) 3831 (99.3) 1281 (99.1)
Yes 78 (0.5) 40 (0.4) 27 (0.7) 11 (0.9)
Values are presented as number (%), mean±SD, or median [IQR].
HDL, high-density lipoprotein; SD, standard deviation; IQR, interquartile range.
1p-values were derived from analysis of variance, the Kruskal-Wallis test, or the chi-square test.
women, while the intermediate-CRP group showed a signifi- cant adjusted HR only for women: the HR was 1.17 (95% CI, 0.98 to 1.40) for men and 1.27 (95% CI, 1.01 to 1.61) for wom- en. The results of the Cox regression analysis of CRP levels on cardiovascular mortality were similar to those between CRP levels and all-cause mortality, although the relationship was only significant for continuous CRP concentrations in men. In the sensitivity analysis, in which deaths occurring within two years from the beginning of study participation were exclud- ed, the HR was attenuated, but the tendency was consistent.
When blood CRP concentrations were used as a continuous variable, the adjusted HR for CRP and all-cause mortality for men was 1.10 (95% CI, 1.05 to 1.14) and 1.05 (95% CI, 0.98 to 1.12) for women. When analyses were performed using log- transformed CRP values, the HR likewise showed a consistent tendency. The adjusted HR between CRP and all-cause mortal- ity for men was 1.26 (95% CI, 1.16 to 1.36) and 1.16 (95% CI, 1.04 to 1.29) for women. The sensitivity analysis between CRP and cardiovascular mortality showed a consistent tendency (data not shown).
and the mean duration of follow-up was 6.5 years (SD, 1.7 years) for men. The overall mean age was 57.8 years (SD, 9.4 years), and the mean duration of follow-up was 6.6 years (SD, 1.5 years) for women. Most variables showed significant differ- ences in their values among the CRP concentration groups.
Overall, men participants had a higher median CRP concentra- tion than women participants (0.89 mg/L for men, 0.68 mg/L for women). In order to evaluate selection bias, we compared the baseline characteristics between study participants and non-participants, and did not find a statistically significant dif- ference in CRP concentration (Supplemental Table 1).
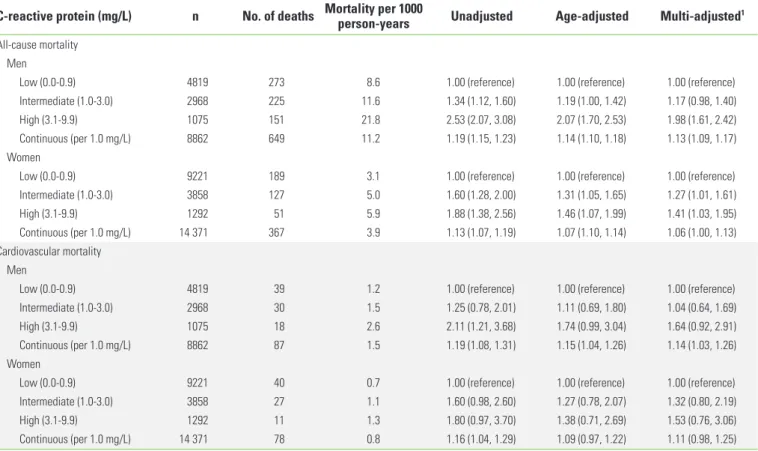
Table 2 shows the result of the Cox regression analysis of CRP on all-cause and cardiovascular mortality per 1000 per- son-years. The high-CRP group showed the highest mortality rate. During the follow-up period, 649 men participants and 367 women participants died. Adjusting for our adjustment variables attenuated the strength of the association. Com- pared to the low-CRP group, the high-CRP group showed a significant adjusted HR for both gender: the HR was 1.98 (95%
CI, 1.61 to 2.42) for men and 1.41 (95% CI, 1.03 to 1.95) for
Table 2. Cox regression analysis of C-reactive protein on all-cause and cardiovascular mortality
C-reactive protein (mg/L) n No. of deaths Mortality per 1000 person-years Unadjusted Age-adjusted Multi-adjusted1 All-cause mortality
Men
Low (0.0-0.9) 4819 273 8.6 1.00 (reference) 1.00 (reference) 1.00 (reference)
Intermediate (1.0-3.0) 2968 225 11.6 1.34 (1.12, 1.60) 1.19 (1.00, 1.42) 1.17 (0.98, 1.40)
High (3.1-9.9) 1075 151 21.8 2.53 (2.07, 3.08) 2.07 (1.70, 2.53) 1.98 (1.61, 2.42)
Continuous (per 1.0 mg/L) 8862 649 11.2 1.19 (1.15, 1.23) 1.14 (1.10, 1.18) 1.13 (1.09, 1.17)
Women
Low (0.0-0.9) 9221 189 3.1 1.00 (reference) 1.00 (reference) 1.00 (reference)
Intermediate (1.0-3.0) 3858 127 5.0 1.60 (1.28, 2.00) 1.31 (1.05, 1.65) 1.27 (1.01, 1.61)
High (3.1-9.9) 1292 51 5.9 1.88 (1.38, 2.56) 1.46 (1.07, 1.99) 1.41 (1.03, 1.95)
Continuous (per 1.0 mg/L) 14 371 367 3.9 1.13 (1.07, 1.19) 1.07 (1.10, 1.14) 1.06 (1.00, 1.13)
Cardiovascular mortality Men
Low (0.0-0.9) 4819 39 1.2 1.00 (reference) 1.00 (reference) 1.00 (reference)
Intermediate (1.0-3.0) 2968 30 1.5 1.25 (0.78, 2.01) 1.11 (0.69, 1.80) 1.04 (0.64, 1.69)
High (3.1-9.9) 1075 18 2.6 2.11 (1.21, 3.68) 1.74 (0.99, 3.04) 1.64 (0.92, 2.91)
Continuous (per 1.0 mg/L) 8862 87 1.5 1.19 (1.08, 1.31) 1.15 (1.04, 1.26) 1.14 (1.03, 1.26)
Women
Low (0.0-0.9) 9221 40 0.7 1.00 (reference) 1.00 (reference) 1.00 (reference)
Intermediate (1.0-3.0) 3858 27 1.1 1.60 (0.98, 2.60) 1.27 (0.78, 2.07) 1.32 (0.80, 2.19)
High (3.1-9.9) 1292 11 1.3 1.80 (0.97, 3.70) 1.38 (0.71, 2.69) 1.53 (0.76, 3.06)
Continuous (per 1.0 mg/L) 14 371 78 0.8 1.16 (1.04, 1.29) 1.09 (0.97, 1.22) 1.11 (0.98, 1.25)
Values are presented as hazard ratio (95% confidence interval).
1Adjusted for age, rural region, body mass index, educational status, alcohol use, smoking status, regular exercise, presence of disease (hypertension, diabetes, and dyslipid- emia), systolic blood pressure, diastolic blood pressure, fasting blood glucose, and concentrations of total cholesterol, triglycerides, and high-density lipoprotein cholesterol.
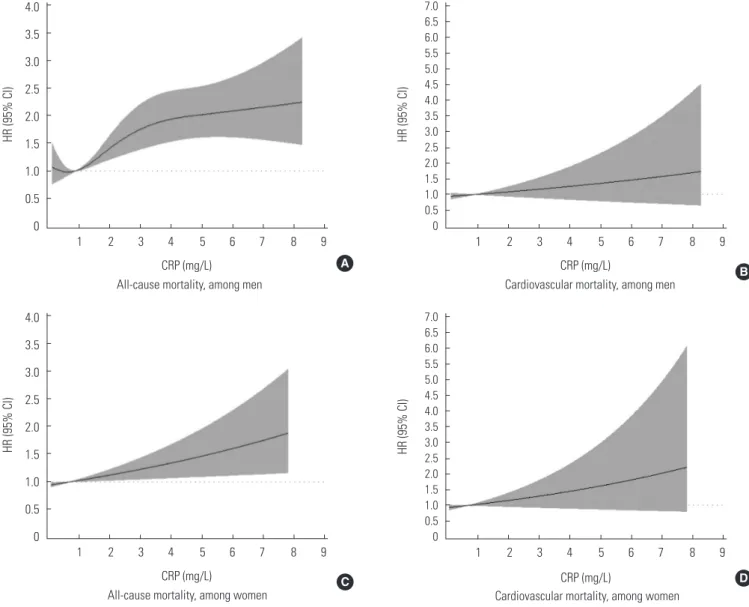
In Figure 1, the RCS shows a significant non-linear pattern between blood CRP concentrations and all-cause mortality for men (p-value for the non-linear relation of 0.048; p-value for the linear relation lower than 0.001), while a significant linear pattern was found for women (p-value for the non-linear rela- tion of 0.267; p-value for the linear relation of 0.013). The RCS between blood CRP concentrations and cardiovascular mor- tality did not show a significant association. Table 3 shows the
Figure 1. The associations of CRP concentrations with HRs for all-cause mortality (A, C) and cardiovascular mortality (B, D). Knots were set at the 5th, 25th, 75th, and 95th percentiles, and the plot was truncated at the 1st and 99th percentiles. The median CRP level was used as the reference. HRs were adjusted for age, rural region, body mass index, educational status, alcohol use, smok- ing status, regular exercise, the presence of disease (hypertension, diabetes, and dyslipidemia), systolic blood pressure, diastolic blood pressure, fasting blood glucose, and concentrations of total cholesterol, triglycerides, and high-density lipoprotein choles- terol. In (A), the p-value for the non-linear relation was 0.048, so we show the spline model. In (C), the p-value for the non-linear relation was 0.267, but the p-value for the linear relation was 0.013, so we show the linear model. In (B) and (D), neither the linear nor the non-linear relation was significant (all p-values >0.05). In these cases, we show the linear model. CRP, C-reactive protein;
HR, harzard ratio; CI, confidence interval.
HR (95% CI) HR (95% CI) HR (95% CI) HR (95% CI)
CRP (mg/L)
CRP (mg/L) CRP (mg/L)
CRP (mg/L) All-cause mortality, among men
All-cause mortality, among women Cardiovascular mortality, among women
Cardiovascular mortality, among men 4.0
3.5 3.0 2.5 2.0 1.5 1.0 0.5 0
4.0 3.5 3.0 2.5 2.0 1.5 1.0 0.5 0
1 2 3 4 5 6 7 8 9
1 2 3 4 5 6 7 8 9
7.0 6.5 6.0 5.5 5.0 4.5 4.0 3.5 3.0 2.5 2.0 1.5 1.0 0.5 0
1 2 3 4 5 6 7 8 9
7.0 6.5 6.0 5.5 5.0 4.5 4.0 3.5 3.0 2.5 2.0 1.5 1.0 0.5 0
1 2 3 4 5 6 7 8 9
A B
C D
interaction of hypertension with this relationship in both gen- der. All interaction terms were insignificant. When CRP was analyzed as a categorical variable (Supplemental Table 2), only the interaction term between CRP and hypertension for all- cause mortality was significant in a comparison of the low- CRP and high-CRP groups in women.
DISCUSSION
We observed a non-linear association between blood CRP concentrations and all-cause mortality in a rural Korean men population, and a linear association in a rural Korean women population. Many observational studies have reported such associations, but most of them analyzed these associations us- ing predetermined CRP risk groups, or based on the p-for- trend for fractile-based groups [12,27,28]. One meta-analysis showed a log-linear association, but its participants were mostly white [7]. In Figure 1A in this study, the HR is shown to have rapidly increased as CRP concentration increased from 1 mg/L to 3 mg/L. However, only a small HR increase was found for CRP levels >3 mg/L. Based on these results, we suggest that a more accurate risk grouping for men in Korea is needed within the intermediate risk group [20,29]. Originally, the NACB LMPG risk groups for CRP were determined by US popu- lation tertiles, but some studies in East Asia have reported lower average CRP concentrations than those observed in Western countries [30-32]. In contrast, as shown in Figure 1B, only a linear association was found between CRP concentra- tions and all-cause mortality in women. The estimated HR be- tween CRP and all-cause mortality for women was lower than that for men in our study, although both relationships were significant. This discrepancy may be due to gender differences in CRP concentrations and mortality [12]. In other studies that
showed significant associations between CRP and mortality for men, significant associations were rarely found in women [11,27]. Due to this gender-based discrepancy, further evalua- tion will be needed regarding the different association pat- terns observed between CRP and mortality according to gen- der. Meanwhile, associations between CRP and cardiovascular mortality were not found to be significant (Figure 1). This find- ing is not consistent with our results presented in Table 2, in which CRP concentrations were used as a continuous variable.
This discrepancy within our study may be due to methodolog- ical differences. Since we excluded outliers for the RCS analy- sis, the results obtained using this method were more attenu- ated than those presented in Table 2. Therefore, we were not able to determine whether a significant association was pres- ent between CRP and cardiovascular mortality. The life expec- tancy of Koreans was 78.5 years for mens and 85.1 for womens in 2013 [33]. Considering the average age of our study partici- pants and the duration of follow-up, we most likely did not in- clude enough cases of cardiovascular mortality. In addition, the HR for cardiovascular mortality in women increased after adjustment (Table 2). However, the results were still insignifi- cant, and the adjusted HR was attenuated in comparison with the unadjusted HR, so this may not change the interpretation of our results.
Since this was the first study regarding association between CRP and mortality to be performed in Korean rural communi- Table 3. Cox regression analysis of CRP on all-cause and cardiovascular mortality according to the presence of hypertension
CRP (mg/L) n Median CRP (mg/L) No, of of death Mortality per 1000
person-years Multi-adjusted1
HR (95% CI) p for interaction All-cause mortality
Men
Hypertension ( -) 4796 0.79 323 10.4 1.15 (1.09, 1.20) -
Hypertension (+) 4066 1.01 326 12.1 1.11 (1.05, 1.17) 0.32
Women
Hypertension (-) 8321 0.59 168 3.1 1.11 (1.02, 1.21) -
Hypertension (+) 6050 0.84 199 4.9 1.02 (0.94, 1.11) 0.11
Cardiovascular mortality Men
Hypertension ( -) 4796 0.79 41 1.3 1.14 (0.98, 1.32) -
Hypertension (+) 4066 1.01 46 1.7 1.19 (1.04, 1.37) 0.58
Women
Hypertension (-) 8321 0.59 31 0.6 1.10 (0.88, 1.38) -
Hypertension (+) 6050 0.84 47 1.2 1.13 (0.97, 1.31) 0.83
CRP, C-reactive protein; HR, hazard ratio; CI, confidence interval.
1Adjusted for age, rural region, body mass index, educational status, alcohol use, smoking status, regular exercise, presence of disease (diabetes and dyslipidemia), systolic blood pressure, diastolic blood pressure, fasting blood glucose, and concentrations of total cholesterol, triglycerides, and high-density lipoprotein cholesterol.
ties, we compared our findings with those of previous studies conducted in rural areas. One such study conducted in Japan reported that participants within the highest tertile of CRP concentrations showed higher all-cause mortality (HR=2.26) than the lowest-tertile group in men [6]. A study conducted in Finland showed an insignificant association between CRP and all-cause mortality after adjustment for conventional CVD risk factors [34]. Our study results were consistent with those of the study performed in Japan. In addition, we compared our results to those of another large cohort study in Korea [11].
That study reported a significant association between CRP and all-cause mortality in men. However, our results showed high- er CRP concentrations and mortality rates. The population of that study included participants who underwent health check- ups in urban areas, and the average age of the participants was lower than in our study. This may have affected differenc- es in blood CRP concentrations, but the presence of such an association was consistent across different populations in Ko- rea. Generally, rural inhabitants had a lower socioeconomic status, less access to health services, and lived in more hazard- ous environments than urban inhabitants [35]. Due to the dif- ficulty of enrolling rural inhabitants, many large studies target- ing apparently healthy people have been conducted in urban areas. Our study is unique in that it focused on multiple rural areas, showing the health landscape among a difficult-to- study population.
Another aim of our study was to evaluate the effect of hy- pertension in modifying the association between blood CRP concentrations and mortality. However, our analysis that was stratified according to the presence of hypertension did not show a significant interaction (p for interaction >0.1), and in- cluding hypertension as a confounder in our analyses did not cause the relationship between CRP and all-cause mortality to become insignificant (Table 2). Therefore, hypertension might be neither an effect modifier nor a mediator. Although a sig- nificant interaction was found between CRP risk groups and all-cause mortality when CRP concentration was analyzed as a categorical variable (Supplemental Table 2), we were not able to reach a conclusion regarding effect modification due to the low number of deaths over an insufficient follow-up period.
Similarly, previous studies evaluating the effect modification of diabetes and hypertension on the relationship between CRP and mortality reported insignificant results [15,16].
This study has some limitations. First, although we recruited participants from 11 rural communities in order to obtain a
representative sample, only volunteers participated in the study. Therefore, selection bias may have been present be- tween study participants and non-participants. As a result, our findings must be applied carefully to the entire population of rural Korean inhabitants. Second, we were not able to examine the incidence of some diseases, such as hypertension, diabe- tes, dyslipidemia, or CVD. Not only disease presence, but dis- ease incidence may affect the association between CRP and mortality. Further research with respect to disease incidence therefore needs to be carried out. Third, a limited approach to disease history was another limitation of our study. We only evaluated the presence of common diseases, such that the ef- fects of other inflammatory diseases that affect CRP, such as rheumatoid arthritis, were not assessed. Fourth, the partici- pants’ history of taking medications with direct effects on CRP concentrations was not available in our data. Angiotensin II re- ceptor blockers, beta-blockers, and statins have been reported to reduce CRP concentrations [36,37]. Finally, we measured blood CRP concentrations only once. Repeat measurements would be needed to evaluate intraparticipant CRP variability.
However, in a previous study, changes in CRP were not found to have a significant effect on mortality [11].
In conclusion, blood CRP concentration showed a positive association with all-cause mortality and cardiovascular mor- tality in a rural Korean population. The strength of the associa- tion among men was greater than among women. This associ- ation was not found to be modified by the presence of hyper- tension. Further evaluation of the associations between CRP and other outcomes, such as hypertension or CVD incidence, is needed.
ACKNOWLEDGEMENTS
This work was supported by a research program funded by the Korea Centers for Disease Control and Prevention (funding code 2004-E71004-00, 2005-E71013-00, 2005-E71011-00, 2006-E71002-00, 2006-E71011-00, 2006-E71009-00, 2007- E71002-00, 2007-E71013-00, 2008-E71004-00, 2009-E71006- 00, 2010-E71003-00, 2011-E71002-00).
CONFLICT OF INTEREST
The authors have no conflicts of interest associated with the material presented in this paper.
ORCID
Jung Hyun Lee http://orcid.org/0000-0001-7141-4532 Hyungseon Yeom http://orcid.org/0000-0002-8004-8244 Hyeon Chang Kim http://orcid.org/0000-0001-7867-1240 Il Suh http://orcid.org/0000-0002-9689-7849
Bo Youl Choi http://orcid.org/ 0000-0003-0115-5736
REFERENCES
1. Libby P. Inflammatory mechanisms: the molecular basis of in- flammation and disease. Nutr Rev 2007;65(12 Pt 2):S140-S146.
2. Shacter E, Weitzman SA. Chronic inflammation and cancer.
Oncology (Williston Park) 2002;16(2):217-226.
3. Willerson JT, Ridker PM. Inflammation as a cardiovascular risk factor. Circulation 2004;109(21 Suppl 1):II2- II10.
4. Windgassen EB, Funtowicz L, Lunsford TN, Harris LA, Mulvagh SL. C-reactive protein and high-sensitivity C-reactive protein:
an update for clinicians. Postgrad Med 2011;123(1):114-119.
5. NACB LMPG Committee Members, Myers GL, Christenson RH, Cushman M, Ballantyne CM, Cooper GR, et al. National Acade- my of Clinical Biochemistry Laboratory Medicine Practice guidelines: emerging biomarkers for primary prevention of cardiovascular disease. Clin Chem 2009;55(2):378-384.
6. Makita S, Nakamura M, Satoh K, Tanaka F, Onoda T, Kawamura K, et al. Serum C-reactive protein levels can be used to predict future ischemic stroke and mortality in Japanese men from the general population. Atherosclerosis 2009;204(1):234-238.
7. Emerging Risk Factors Collaboration, Kaptoge S, Di Angelan- tonio E, Lowe G, Pepys MB, Thompson SG, et al. C-reactive protein concentration and risk of coronary heart disease, stroke, and mortality: an individual participant meta-analysis.
Lancet 2010;375(9709):132-140.
8. Ridker PM. High-sensitivity C-reactive protein as a predictor of all-cause mortality: implications for research and patient care.
Clin Chem 2008;54(2):234-237.
9. Ahmadi-Abhari S, Luben RN, Wareham NJ, Khaw KT. Seven- teen year risk of all-cause and cause-specific mortality associ- ated with C-reactive protein, fibrinogen and leukocyte count in men and women: the EPIC-Norfolk study. Eur J Epidemiol 2013;28(7):541-550.
10. Goyal A, Terry MB, Jin Z, Siegel AB. C-reactive protein and colorectal cancer mortality in U.S. adults. Cancer Epidemiol Biomarkers Prev 2014;23(8):1609-1618.
11. Sung KC, Ryu S, Chang Y, Byrne CD, Kim SH. C-reactive protein
and risk of cardiovascular and all-cause mortality in 268 803 East Asians. Eur Heart J 2014;35(27):1809-1816.
12. Doran B, Zhu W, Muennig P. Gender differences in cardiovas- cular mortality by C-reactive protein level in the United States:
evidence from the National Health and Nutrition Examination Survey III. Am Heart J 2013;166(1):45-51.
13. Kim KI, Oh SW, Ahn S, Heo NJ, Kim S, Chin HJ, et al. CRP level and HDL cholesterol concentration jointly predict mortality in a Korean population. Am J Med 2012;125(8):787- 795.e4.
14. Ding D, Wang M, Su D, Hong C, Li X, Yang Y, et al. Body mass index, high-sensitivity C-reactive protein and mortality in Chi- nese with coronary artery disease. PLoS One 2015;10(8):
e0135713.
15. Sung JW, Lee SH, Byrne CD, Chung PW, Won YS, Sung KC.
High-sensitivity C-reactive protein is associated with the pres- ence of coronary artery calcium in subjects with normal blood pressure but not in subjects with hypertension. Arch Med Res 2014;45(2):170-176.
16. Kengne AP, Batty GD, Hamer M, Stamatakis E, Czernichow S.
Association of C-reactive protein with cardiovascular disease mortality according to diabetes status: pooled analyses of 25,979 participants from four U.K. prospective cohort studies.
Diabetes Care 2012;35(2):396-403.
17. Koenig W, Khuseyinova N, Baumert J, Meisinger C. Prospec- tive study of high-sensitivity C-reactive protein as a determi- nant of mortality: results from the MONICA/KORA Augsburg Cohort Study, 1984-1998. Clin Chem 2008;54(2):335-342.
18. Yusuf S, Reddy S, Ounpuu S, Anand S. Global burden of car- diovascular diseases. Part II: variations in cardiovascular dis- ease by specific ethnic groups and geographic regions and prevention strategies. Circulation 2001;104(23):2855-2864.
19. Miranda JJ, Gilman RH, Smeeth L. Differences in cardiovascu- lar risk factors in rural, urban and rural-to-urban migrants in Peru. Heart 2011;97(10):787-796.
20. Kelley-Hedgepeth A, Lloyd-Jones DM, Colvin A, Matthews KA, Johnston J, Sowers MR, et al. Ethnic differences in C-reactive protein concentrations. Clin Chem 2008;54(6):1027-1037.
21. Kim Y, Han BG; KoGES group. Cohort profile: the Korean ge- nome and epidemiology study (KoGES) Consortium. Int J Epi- demiol 2016. http://dx.doi.org/10.1093/ije/dyv316.
22. Lee EH, Park SK, Ko KP, Cho IS, Chang SH, Shin HR, et al. Ciga- rette smoking and mortality in the Korean Multi-center Can- cer Cohort (KMCC) study. J Prev Med Public Health 2010;43(2):
151-158 (Korean).
23. World Health Organization. The Asia-Pacific perspective: rede-
fining obesity and its treatment [cited 2016 Sep 4]. Available from: http://www.wpro.who.int/nutrition/documents/docs/
Redefiningobesity.pdf.
24. Friedewald WT, Levy RI, Fredrickson DS. Estimation of the con- centration of low-density lipoprotein cholesterol in plasma, without use of the preparative ultracentrifuge. Clin Chem 1972;18(6):499-502.
25. Heinzl H, Kaider A. Gaining more flexibility in Cox proportion- al hazards regression models with cubic spline functions.
Comput Methods Programs Biomed 1997;54(3):201-208.
26. Li R, Hertzmark E, Louie M, Chen L, Spiegelman D. The SAS LGTPHCURV9 macro; 2011 [cited 2016 Sep 4]. Available from:
https://cdn1.sph.harvard.edu/wp-content/uploads/sites/271/
2012/09/lgtphcurv9_7-3-2011.pdf.
27. Iso H, Cui R, Date C, Kikuchi S, Tamakoshi A; JACC Study Group.
C-reactive protein levels and risk of mortality from cardiovas- cular disease in Japanese: the JACC Study. Atherosclerosis 2009;207(1):291-297.
28. Currie CJ, Poole CD, Conway P. Evaluation of the association between the first observation and the longitudinal change in C-reactive protein, and all-cause mortality. Heart 2008;94(4):
457-462.
29. Pearson TA, Mensah GA, Alexander RW, Anderson JL, Cannon RO 3rd, Criqui M, et al. Markers of inflammation and cardio- vascular disease: application to clinical and public health practice: a statement for healthcare professionals from the Centers for Disease Control and Prevention and the American Heart Association. Circulation 2003;107(3):499-511.
30. Woloshin S, Schwartz LM. Distribution of C-reactive protein
values in the United States. N Engl J Med 2005;352(15):1611- 1613.
31. Saito I, Sato S, Nakamura M, Kokubo Y, Mannami T, Adachi H, et al. A low level of C-reactive protein in Japanese adults and its association with cardiovascular risk factors: the Japan NCVC-Collaborative Inflammation Cohort (JNIC) study. Ath- erosclerosis 2007;194(1):238-244.
32. Zhao Y, Wang R, Ma X, Yan X, Zhang Z, He X, et al. Distribution of C-reactive protein and its association with cardiovascular risk factors in a population-based sample of Chinese. Dis Markers 2010;28(6):333-342.
33. Organization for Economic Cooperation and Development.
Health status [cited 2015 Nov 29]. Available from: http://stats.
oecd.org/index.aspx?DataSetCode=HEALTH_STAT.
34. Kuoppamäki M, Salminen M, Vahlberg T, Irjala K, Kivelä SL, Räihä I. High sensitive C-reactive protein (hsCRP), cardiovas- cular events and mortality in the aged: a prospective 9-year follow-up study. Arch Gerontol Geriatr 2015;60(1):112-117.
35. Smith KB, Humphreys JS, Wilson MG. Addressing the health disadvantage of rural populations: how does epidemiological evidence inform rural health policies and research? Aust J Ru- ral Health 2008;16(2):56-66.
36. Hage FG. C-reactive protein and hypertension. J Hum Hyper- tens 2014;28(7):410-415.
37. Ridker PM, Danielson E, Fonseca FA, Genest J, Gotto AM Jr, Kastelein JJ, et al. Reduction in C-reactive protein and LDL cholesterol and cardiovascular event rates after initiation of rosuvastatin: a prospective study of the JUPITER trial. Lancet 2009;373(9670):1175-1182.
Supplemental Table 1. Comparison of baseline characteristics between study participants and non-participants
Variables Study participants Non-participants
p-value1
n Mean±SD n Mean±SD
Men
Age (y) 8862 58.9±9.1 773 58.9±9.2 0.88
Systolic blood pressure (mm Hg) 8862 127.9±17.1 757 126.6±17.5 0.04
Diastolic blood pressure (mm Hg) 8862 81.5±10.7 752 80.7±11.8 0.07
Fasting blood glucose (mmol/L) 8862 5.33±0.88 768 5.33±0.94 0.60
Total cholesterol (mmol/L) 8862 5.03±0.93 768 4.98±0.97 0.12
Triglycerides (mmol/L) 8862 1.51±1.22 767 1.41±1.07 0.02
HDL cholesterol (mmol/L) 8862 1.14±0.30 767 1.12±0.29 0.14
C-reactive protein (mg/L) 8862 0.89±1.34 233 0.85±1.02 0.57
Women
Age (y) 14 371 57.8±9.4 1502 56.3±9.1 <0.001
Systolic blood pressure (mm Hg) 14 371 125.2±18.2 1476 124.3±18.2 0.07
Diastolic blood pressure (mm Hg) 14 371 78.4±11.1 1466 77.2±11.2 <0.001
Fasting blood glucose (mmol/L) 14 371 5.11±0.78 1494 5.05±0.67 <0.001
Total cholesterol (mmol/L) 14 371 5.30±0.96 1494 5.20±0.95 <0.001
Triglycerides (mmol/L) 14 371 1.36±0.96 1486 1.32±0.93 0.05
HDL cholesterol (mmol/L) 14 371 1.20±0.29 1493 1.20±0.28 0.43
C-reactive protein (mg/L) 14 371 0.68±1.03 434 0.64±1.03 0.17
Values of the concentrations of fasting glucose, triglycerides, and C-reactive protein are presented as median±IQR, while other variables are presented as mean±SD.
HDL, high-density lipoprotein; SD, standard deviation; IQR, interquartile range.
1p-values were derived from the t-test and the Mann-Whitney test.
Supplemental Table 2. Cox regression analysis of CRP on all-cause and cardiovascular mortality according to the presence of hypertension (by CRP group)
n No. of deaths Mortality per 1000
person-years Multi-adjusted1
HR (95% CI) p for interaction (vs. low-CRP group) All-cause mortality
Men
Low-CRP group
No hypertension 2798 138 7.6 1.00 (reference)
Hypertension 2021 135 10.1 1.10 (0.84, 1.44)
Intermediate-CRP group 0.46
No hypertension 1458 109 11.5 1.25 (0.97, 1.61)
Hypertension 1510 116 11.6 1.20 (0.90, 1.60)
High-CRP group 0.23
No hypertension 540 76 22.0 2.23 (1.28, 2.96)
Hypertension 535 75 21.7 1.92 (1.40, 2.63)
Women Low-CRP group
No hypertension 5783 94 2.5 1.00 (reference)
Hypertension 3438 95 4.2 1.04 (0.74, 1.45)
Intermediate-CRP group 0.41
No hypertension 1902 45 3.6 1.12 (0.78, 1.61)
Hypertension 1956 82 6.3 1.42 (1.00, 2.01)
High-CRP group 0.02
No hypertension 636 29 6.9 2.06 (1.35, 3.15)
Hypertension 656 22 4.9 1.02 (0.61, 1.71)
Cardiovascular mortality Men
Low-CRP group
No hypertension 2798 21 1.2 1.00 (reference)
Hypertension 2021 18 1.3 0.56 (0.27, 1.18)
Intermediate-CRP group 0.63
No hypertension 1458 13 1.4 0.92 (0.46, 1.86)
Hypertension 1510 17 1.7 0.66 (0.31, 1.39)
High-CRP group 0.41
No hypertension 540 7 2.0 1.26 (0.53, 3.00)
Hypertension 535 11 3.2 1.15 (0.50, 2.64)
Women Low-CRP group
No hypertension 5783 19 0.5 1.00 (reference)
Hypertension 3438 21 0.9 0.78 (0.37, 1.62)
Intermediate-CRP group 0.34
No hypertension 1902 8 0.6 0.96 (0.42, 2.22)
Hypertension 1956 19 1.5 1.24 (0.58, 2.66)
High-CRP group 0.93
No hypertension 636 4 1.0 1.50 (0.50, 4.49)
Hypertension 656 7 1.6 1.23 (0.46, 3.31)
CRP, C-reactive protein; HR, hazard ratio; CI, confidence interval.
1Adjusted for age, rural region, body mass index, educational status, alcohol use, smoking status, regular exercise, the presence of disease (diabetes and dyslipidemia), systolic blood pressure, diastolic blood pressure, fasting blood glucose, and concentrations of total cholesterol, triglycerides, and high-density lipoprotein cholesterol.