ies have shown that the incidence of the disease has sig- nificantly increased over the past several decades in Asia.
2,3This change in Asia may be the result of Westernized diet, improved hygiene, increasing use of antibiotics, or changes in the gut microbiota.
4IBD is a unique and disabling condition that often de- mands the care of gastroenterology specialists. Indeed, many studies on IBD in the literature have been conducted in ter- tiary referral centers (TRCs).
5However, little is known about the clinical features and management of patients with IBD in primary or secondary care units. We surmise that there must be a difference in the characteristics and treatments between patients in secondary hospitals (SHs) and those in INTRODUCTION
Inflammatory bowel disease (IBD), which mainly com- prises UC and CD, is characterized by chronic repetitive bowel inflammation that requires life-long treatment.
1Although IBD prevails in Western countries, recent stud-
Received May 2, 2017. Revised August 13, 2017.
Accepted August 14, 2017. Published online September 15, 2017 Correspondence to Eun Soo Kim, Division of Gastroenterology and Hepatology, Department of Internal Medicine, School of Medicine, Kyungpook National University, 680 Gukchaebosang-ro, Jung-gu, Daegu 41944, Korea. Tel: +82-53-200-5879, Fax: +82-53-200-5879, E-mail:
dandy813@hanmail.net
Characteristics and management of patients with
inflammatory bowel disease between a secondary and tertiary hospitals: a propensity score analysis
Ki Hwan Song
1, Eun Soo Kim
2, Yoo Jin Lee
3, Byung Ik Jang
4, Kyeong Ok Kim
4, Sang Gyu Kwak
5, Hyun Seok Lee
2, on behalf of Crohn’s and Colitis Association in Daegu-Gyeongbuk (CCAiD)
1
Department of Surgery, Goo Hospital, Daegu,
2Department of Internal Medicine, School of Medicine, Kyungpook National University, Daegu,
3
Department of Internal Medicine, Keimyung University School of Medicine, Daegu,
4Department of Internal Medicine, Yeungnam University College of Medicine, Daegu,
5Department of Medical Statistics, Catholic University of Daegu School of Medicine, Daegu, Korea
Background/Aims: This study aimed to compare the clinical characteristics and management patterns of inflammatory bow- el disease (IBD) patients in a secondary hospital (SH) with those in tertiary referral centers (TRC). Methods: Data from IBD patients in SH and 2 TRCs were retrospectively reviewed. The cumulative thiopurine use rate was compared between hospitals after controlling for different baseline characteristics using propensity score matching. Results: Among the total of 447 patients with IBD, 178 Crohn’s disease (CD) and 269 ulcerative colitis (UC) patients were included. Regarding initial CD symptoms, pa- tients from SH were more likely to show perianal symptoms, such as anal pain or discharge (56.6% vs. 34.3%, P=0.003), whereas those from TRCs more often had luminal symptoms, such as abdominal pain (54.9% vs. 17.1%, P<0.001), diarrhea (44.1% vs.
18.4%, P<0.001), and body weight loss (9.8% vs. 1.3%, P=0.025). Complicating behaviors, such as stricturing and penetrating, were significantly higher in TRCs, while perianal disease was more common in SH. Ileal location was more frequently observed in TRCs. For UC, SH had a more limited extent of disease (proctitis 58.8% vs. 21.2%, P<0.001). The cumulative azathioprine use rate in SH was significantly lower than that in TRCs in both CD and UC patients after controlling for disease behavior, location, and perianal disease of CD and extent of UC. Conclusions: The clinical characteristics and management of the IBD patients in SH were substantially different from those in TRCs. Thiopurine treatment was less commonly used for SH patients. (Intest Res 2018;16:216-222)
Key Words: Inflammatory bowel disease; Secondary care; Tertiary care centers; Propensity score
https://doi.org/10.5217/ir.2018.16.2.216 • Intest Res 2018;16(2):216-222
TRCs. It would be clinically relevant to understand if there are any disparities for better understanding of IBD patients as a whole and for setting up an appropriate management strategy for patients who were referred from primary or SHs. Therefore, we aimed to compare the demographic and clinical characteristics of IBD patients from a SH with those from TRCs. The steroid, immunomodulator and anti-tumor necrosis factor (anti-TNF) use pattern for patients with IBD was also compared between the 2 groups.
METHODS
1. Subjects
The medical records of patients with CD and UC from an SH and 2 TRCs were reviewed retrospectively by 2 gastroen- terology specialists (E.S.K. and K.O.K.). The SH had general physicians and surgeons while the 2 TRCs had specialized gastroenterology units including the department of gastro- enterology and the department of surgery and only received referred patients from primary or SHs. Their diagnoses were made between January of 2011 and March of 2015. Patients older than 18 years and who were followed up with at least more than 6 months after diagnosis were included in the study. The disease diagnosis was based on a thorough clini- cal history taking, physical examination, laboratory inves- tigations, endoscopic assessment, radiologic findings, and pathology assessment according to the Korean guidelines of IBD diagnosis.
6,7The Institutional Review Boards from all of the hospitals approved this study (DSMC2015-06-003).
The informed consent from patients was waived because this was a retrospective study.
2. Variables
Variables included age at diagnosis, sex, initial symptoms and history of medications, such as steroid exposure, thiopu- rine, and anti-TNF. Initial CD symptoms included perianal symptoms, such as anal discharge or painful anal swelling, and luminal symptoms, such as abdominal pain, diarrhea, or body weight loss. The UC symptoms consisted of hema- tochezia, diarrhea, abdominal pain, or body weight loss. For CD, the locations were classified as ileal (L1), colonic (L2) or ileocolonic (L3), and the behaviors were categorized as in- flammatory (B1), stricturing (B2) or penetrating (B3) in cor- respondence with the Montreal classification. Perianal dis- ease, including perianal fistula or abscess, was also recorded.
However, hemorrhoids and skin tag were not included in the definition of perianal disease. For UC, the extent of the disease was assessed as proctitis (E1), left sided (E2), or ex- tensive (E3) according to the Montreal classification as well.
3. Statistical Analysis
For categorical variables, Fisher exact or chi-square tests were used to assess the differences between the groups. For non-categorical variables, the Mann-Whitney U test was used and they were described as medians and ranges. The treatments patterns were analyzed after controlling for dif- ferent baseline clinical characteristics, such as initial symp- toms, disease behavior, CD location, extent of UC, and age at diagnosis using propensity score matching between the 2 groups. Propensity scores were estimated using a logistic re- gression analysis. A Kaplan-Meier analysis with the log-rank test was applied to describe cumulative use of thiopurine and anti-TNF between the groups. A two-tailed P-value <0.05 was considered statistically significant. Statistical analyses were performed using SPSS version 18.0 (SPSS Inc., Chicago, IL, USA).
RESULTS
1. Baseline Characteristics
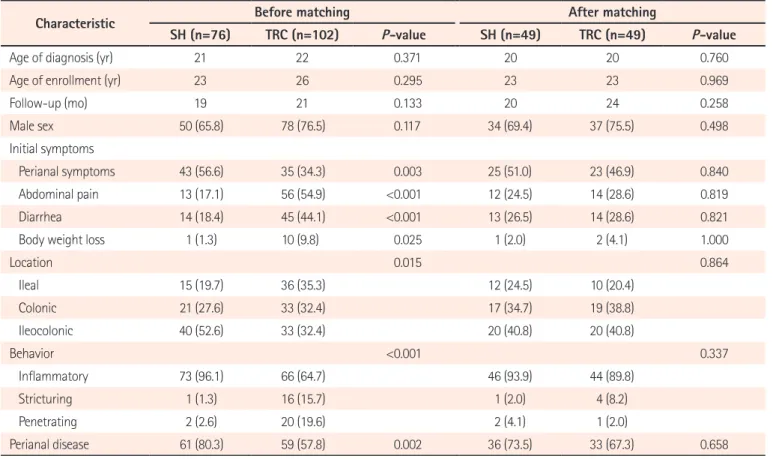
Overall, 178 patients with CD and 269 patients with UC were included in the study. For CD, 76 patients were from the SH while 102 were from the TRCs. The age at diagnosis for the CD patients was not different between the SH and the TRCs (median, 21 years (18−71) vs. 22 years (18−69);
P=0.371). There was no difference in age of enrollment and follow-up period between SH and TRC. Both groups had a male predominance (SH 65.8% and TRC 76.5%, P=0.117).
There was a clear difference between the groups regarding their initial CD symptoms. Specifically, perianal symptoms were more frequently observed in the SH (56.6% vs. 34.3%, P =0.003) while luminal symptoms, such as abdominal pain (17.1% vs. 54.9%, P<0.001), diarrhea (18.4% vs. 44.1%, P <0.001), and body weight loss (1.3% vs. 9.8%, P =0.025) were more likely reported in the TRCs. Regarding the CD locations, ileal involvement (L1) was observed more in the TRC group than in the SH group (35.3% vs. 19.7%, P=0.015).
Complicating behaviors, such as stricturing or penetrating types were more common in the TRCs than in the SH (35.3%
vs. 3.9%, P<0.001). The SH group had more perianal disease
instances than the TRC group (80.3% vs. 57.8%, P=0.002).
Age of enrollment (yr) 23 26 0.295 23 23 0.969
Follow-up (mo) 19 21 0.133 20 24 0.258
Male sex 50 (65.8) 78 (76.5) 0.117 34 (69.4) 37 (75.5) 0.498
Initial symptoms
Perianal symptoms 43 (56.6) 35 (34.3) 0.003 25 (51.0) 23 (46.9) 0.840
Abdominal pain 13 (17.1) 56 (54.9) <0.001 12 (24.5) 14 (28.6) 0.819
Diarrhea 14 (18.4) 45 (44.1) <0.001 13 (26.5) 14 (28.6) 0.821
Body weight loss 1 (1.3) 10 (9.8) 0.025 1 (2.0) 2 (4.1) 1.000
Location 0.015 0.864
Ileal 15 (19.7) 36 (35.3) 12 (24.5) 10 (20.4)
Colonic 21 (27.6) 33 (32.4) 17 (34.7) 19 (38.8)
Ileocolonic 40 (52.6) 33 (32.4) 20 (40.8) 20 (40.8)
Behavior <0.001 0.337
Inflammatory 73 (96.1) 66 (64.7) 46 (93.9) 44 (89.8)
Stricturing 1 (1.3) 16 (15.7) 1 (2.0) 4 (8.2)
Penetrating 2 (2.6) 20 (19.6) 2 (4.1) 1 (2.0)
Perianal disease 61 (80.3) 59 (57.8) 0.002 36 (73.5) 33 (67.3) 0.658
Values are presented as median or number (%).
SH, secondary hospital; TRC, tertiary referral center.
Table 2. Baseline Characteristics of Patients with UC before and after Matching
Characteristic Before matching After matching
SH (n=170) TRC (n=99) P-value SH (n=65) TRC (n=65) P-value
Age of diagnosis (yr) 47 36 <0.001 53 41 0.162
Age of enrollment (yr) 52 39 0.001 57 49 0.196
Follow-up (mo) 36 20 0.012 37 22 0.127
Male sex 113 (66.5) 56 (56.6) 0.117 49 (75.4) 40 (61.5) 0.131
Initial symptoms
Hematochezia 159 (93.5) 77 (77.8) <0.001 58 (89.2) 59 (90.8) 1.000
Diarrhea 40 (23.5) 56 (56.6) <0.001 20 (30.8) 27 (41.5) 0.273
Abdominal pain 12 (7.1) 16 (16.2) 0.023 7 (10.8) 5 (7.7) 0.545
Body weight loss 0 8 (8.1) 0.001 0 0
Disease extent <0.001 0.120
Proctitis 100 (58.8) 21 (21.2) 17 (26.2) 17 (26.2)
Left sided 33 (19.4) 50 (50.5) 22 (33.8) 32 (49.2)
Extensive 37 (21.8) 28 (28.3) 26 (40.0) 16 (24.6)
Values are presented as median or number (%).
SH, secondary hospital; TRC, tertiary referral center.
https://doi.org/10.5217/ir.2018.16.2.216 • Intest Res 2018;16(2):216-222
Regarding UC, 170 SH patients and 99 TRC patients were evaluated. The ages at diagnosis in the SH were significantly higher than in the TRCs (median, 47 years vs. 36 years;
P<0.001). There was no significant difference in gender be- tween the groups. We found a significant difference in the age of enrollment (median, 52 years vs. 39 years; P=0.001) and follow-up duration (median, 36 months vs. 20 months;
P=0.012) between SH and TRC before matching. Although hematochezia was the most commonly reported initial symptom in both groups, the SH patients had this symp- tom more frequently than the TRC patients did (93.5% vs.
77.8%, P<0.001). However, the UC patients in the TRCs more frequently reported diarrhea (56.6% vs. 23.5%, P<0.001), ab- dominal pain (16.2% vs. 7.1%, P=0.023) and body weight loss (8.1% vs. 0%, P=0.001) than in the SH. The UC patients from the SH had a more limited extent of the disease than in the TRCs (proctitis 58.8% vs. 21.2%, P<0.001). Statistically sig- nificant differences in the baseline characteristics including initial symptoms, CD location, CD behavior, age at diagnosis and enrollment of UC, follow-up duration in UC and extent of UC were not observed after propensity score matching.
The baseline characteristics are described in Tables 1 and 2.
2. Treatments Patterns between the Groups after Matching
Before comparing the treatments pattern between the groups, we matched patients at a 1 to 1 ratio from each group using propensity score matching (Fig. 1). The number of patients was reduced to 98 (49 vs. 49) and 130 (65 vs. 65) for CD and UC, respectively. The treatment patterns between the groups were compared, as shown in Table 3. The CD pa- tients in the TRCs were exposed to steroids more frequently than in the SH (42.9% vs. 12.2%, P=0.001). Additionally, more CD patients in the TRCs took thiopurine medication than in the SH (87.8% vs. 16.3%, P<0.001). However, the use of anti- TNF for CD in the SH was similar to that in the TRCs (30.6%
vs. 24.5%, P=0.498). Anti-TNF treatment without thiopurine initiation was more common in the SH than in the TRCs (20.4% vs. 0%, P=0.001). Bowel resection rate was not dif- ferent between groups. For the UC treatment, there was no significant difference between the groups regarding steroid
Fig. 1. Matching flow of the patients.
Secondary hospital
76 Patients
Tertiary referral centers
99 Patients
27 Patients
49 Patients 65 Patients
34 Patients CD
102 Patients
Tertiary referral centers 178 Total patients
49 Patients
53 Patients Initial symptoms,
behavior, location, perianal disease
matched
UC
Secondary hospital
170 Patients
269 Total patients
65 Patients 105 Patients
Age at diagnosis, initial symptoms, disease extent
matched
Table 3. Treatment Pattern in a Secondary Hospital and Tertiary Referral Centers after Matching
Treatments CD (n=98) UC (n=130)
SH (n=49) TRC (n=49) P-value SH (n=65) TRC (n=65) P-value
Steroid exposure 6 (12.2) 21 (42.9) 0.001 24 (36.9) 28 (43.1) 0.474
Thiopurine 8 (16.3) 43 (87.8) <0.001 8 (12.3) 20 (30.8) 0.018
Anti-TNF 15 (30.6) 12 (24.5) 0.498 9 (13.8) 7 (10.8) 0.790
Anti-TNF without thiopurine use 10 (20.4) 0 0.001 4 (6.2) 1 (1.5) 0.365
Surgery
a4 (8.2) 1 (2.0) 0.362 0 1 (1.5) 1.000
Values are presented as number (%).
a
Surgery indicates bowel resection and colectomy for CD and UC, respectively.
SH, secondary hospital; TRC, tertiary referral center; anti-TNF, anti-tumor necrosis factor.
exposure and anti-TNF use, whereas more patients in the TRCs were administered thiopurine medication than in the SH (30.8% vs. 12.3%, P=0.018). Total colectomy rate was not different between groups. A Kaplan-Meier analysis of the cumulative use of thiopurine showed that the time from the diagnosis to start of thiopurine treatment was significantly shorter in the TRC group compared with the SH group for both CD (log-rank P<0.001) and UC (log-rank P=0.013) (Fig.
2A and B). We did not find a significant difference between the groups in the cumulative use of anti-TNF for both CD and UC (Fig. 2C and D).
DISCUSSION
We found that there was a significant difference in the clinical characteristics of patients with IBD from a second- ary care unit and from TRCs. The CD patients in the SH were more likely to have perianal disease-related problems whereas the CD patients in the TRCs had ileal location and
complicating behaviors more frequently compared with the SH. Additionally, the UC patients in the SH were more likely to have a limited extent of the disease compared with those in the TRCs. Moreover, there was a substantial gap in the treatment behavior for patients with IBD between the SH and TRCs. After controlling for different characteristics using propensity score matching, the cumulative use of thiopurine for both CD and UC in the SH group was significantly lower than that in the TRC group.
To the best of our knowledge, this is the first study to com- pare the clinical features and management of patients with IBD between a secondary care unit and TRCs using a pro- pensity score matching system. Although IBD is perceived as a condition that usually requires management by gastroen- terology specialists in referral centers, the role of primary or secondary care units is recognized as essential in the long- term care of patients with IBD.
8Further, issues in the com- munication between health care services for patients with IBD have been highlighted.
9Therefore, it is imperative to Fig. 2. Kaplan-Meier analysis of cumulative use of treatment after matching. (A) Thiopurine in CD, (B) thiopurine in UC, (C) anti-tumor necrosis factor (anti-TNF) in CD, and (D) anti-TNF in UC. SH, secondary hospital; TRC, tertiary referral centers.
Cumulativeuseof
0 0.4
0.2
8,000 Days
0
6,000 4,000
2,000
Log-rank <0.001P
Cumulativeuseof
0 0.4
0.2
8,000 Days
0
SH TRC
6,000 4,000
2,000
Cumulativeuseofanti-TNF
0 1.0
0.8
0.6
0.4
0.2
8,000 Days
0
SH TRC
6,000 4,000
2,000
Log-rank =0.325P Cumulativeuseofanti-TNF
0 1.0
0.8
0.6
0.4
0.2
8,000 Days
0
SH TRC
6,000 4,000
2,000
Log-rank =0.844P
C D
https://doi.org/10.5217/ir.2018.16.2.216 • Intest Res 2018;16(2):216-222