Corresponding author: Jin Soo Seo ([email protected]) Department of Electrical Engineering, Gangneung-Wonju National University, Gangneung, Rep. of Korea
Speaker Change Detection Based on a Graph-Partitioning Criterion
Jin Soo Seo*
* Dept. of Electrical Engineering, Gangneung-Wonju National University (Received January 19, 2011; accepted February 8, 2011)
Abstract
Speaker change detection involves the identification of time indices of an audio stream, where the identity of the speaker changes. In this paper, we propose novel measures for the speaker change detection based on a graph-partitioning criterion over the pairwise distance matrix of feature-vector stream. Experiments on both synthetic and real-world data were performed and showed that the proposed approach yield promising results compared with the conventional statistical measures.
Keywords: Speaker change, audio segmentation, distance matrix, graph cut, graph partitioning Subject classification: Speech Signal Recognition (2.5)
I. Introduction
The segmentation of contents under various criteria, such as people, objects, and environ- ments, is indispensable to quickly and interactively respond to the users’ request for browsing, retrieval, and indexing on content repositories.
This paper focuses on one of the issues, speaker change detection (SCD) of an audio stream. SCD is an indispensable prior step for speaker segm- entation and clustering, which has a wide range of applications including audio indexing and retrieval, speaker tracking and identification, and movie summarization [1].
Speaker change detection is most commonly done by statistically determining whether the two adjacent segments of a speech stream are significantly different or not. As shown in Fig.
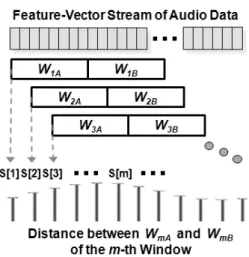
1, the initial approach to SCD involves sliding an analysis window through the feature-vector
stream of an audio data and measuring the distance between the two parts A and B within the window. Along the sliding windows, the local maxima points of the distances, which exceed a threshold, are considered as change points [2]. Various distance measures have been utilized for SCD, which include the symmetric Kullback- Leibler measure [3], weighted Euclidean distance [4], and the second-order similarity measures [3]. A comparative detailed review of the previous SCD methods is given in [2]. Among the various metrics, the generalized likelihood ratio (GLR) based on the Bayesian information criterion (BIC) [5-7] is considered as a standard approach for SCD, which involves a statistical hypothesis test between the null hypothesis (no speaker change in the analysis window) and the alter- native hypothesis (a speaker change in the analysis window).
The existence of phonetic variations over the
speaker difference has been a main obstacle in
making correct speaker-change decision within
a limited amount of time. Most of the previous
methods model each segment independently
Fig. 1. Sliding window framework over a feature-vector stream for speaker change detection.
before comparing each other, which is known to be vulnerable to phonetic variations especially for a short segment size [1]. In this paper, we seek a different approach using the pairwise distance matrix of a feature-vector stream, which makes it possible to construct various difference measures directly over the pair of feature vectors. Especially we introduce the minimum statistics in measuring inter-speaker variations of the two parts in a window to suppress the phonetic variations while retaining speaker-change information. Moreover, the incorporation of the weighting factor further enhances accuracy by reducing false positives.
The preliminary work on the SCD based on the pairwise distance matrix was presented at [8].
In this paper, we reformulate three different inter-speaker variation measures over the pairwise distance matrix and compare the SCD performance of them by the experiments on both synthetic and real-world conversations.
This paper is organized as follows. Section II describes the proposed SCD method based on a graph-partitioning criterion. Section III evaluates the performance of the proposed method. Section IV summarizes the performance and the limitations of the proposed method.
II. Proposed SCD Measures
2.1. Construction of the Pairwise Distance Matrix
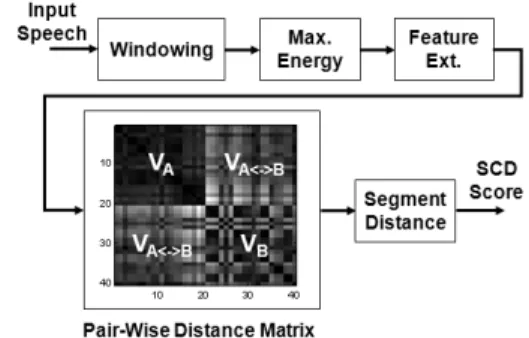
The overview of the proposed method is shown in Fig. 2. A speech signal is split into overlapping segments (called frames) of 32 ms with 22 ms overlap. To save computations in the subsequent analysis, the frames with the highest energy at every 100 ms are only consi- dered for feature extraction. Thus there is nine- tenths reduction of the feature vectors. We consider the 20-order mel-frequency cepstral coefficients (MFCC) as a low-level spectral feature as in [5, 7], since MFCC is the most commonly used feature for SCD [2]. However, other features can be used in the proposed method with a minor adjustment.
A fixed-size analysis window (typically 4 s) is slid through the given selected feature stream at a predetermined rate (in our case every 0.1 s) as shown in Fig. 1. At each instance, a speaker change is hypothesized at the midpoint of the window. By computing the distance between the feature vectors of a window, we construct the m -th window pairwise distance matrix D
m, whose elements D
m[ i,j ] refers to the distance between the i -th and the j -th feature vector.
As a distance measure, we use the squared Euclidean distance. The distance matrix with the speaker change has a clear cut at the midpoint, while that without speaker change is somehow more homogeneous. In both cases, there exist some distortions caused by the phonetic difference.
2.2. SCD Based on the Pairwise Distance Matrix
For notational convenience, the size of the
distance matrix D
mis assumed to be 2 N by
2 N , which denotes that there are 2 N frames
in a window. Each speech frame is regarded as
Fig. 2. Overview of the proposed SCD method based on the pair-wise distance matrix.
a data point in a graph, where the proximity of the data points is represented as the reciprocal of the pairwise distance matrix as shown in Fig. 2. Since a speaker change is hypothesized at the midpoint of the window, the first N by N and the last N by N part of D
mrepresent the intra-speaker variations, and the remaining part represents the inter-speaker variations. A good graph partition is the one where the distances between two subsets have very high values, and distances within a subset have low values. Over the graph structure from the pairwise distance matrix, we will formulate the SCD score as the ratio between the inter- and the intra-speaker variation measure inspired from the min-max cut [9] used for data clustering and video shot boundary detection [10]. The m -th window SCD score S [ m ] for determining the speaker-change point is given by the ratio between the inter- segment distance
↔ and the intra-segment distances
and
as follows:
↔
(1)
The inter- and the intra-segment distance measures should be carefully selected in order to suppress the phonetic-difference distortions while keeping the speaker-specific information.
Without further information, we have to assume that the speaker change occurs when the measured inter-segment distance could not be regarded as within the conjectured intra-phonetic variation.
In this regard, the average phonetic variation is used for the intra-segment distance as follows:
(2)
For the inter-segment distance measures, we consider three kinds of approaches over the distance matrix D
m. The first one is a conventional
approach based on the average statics of the inter-segment matrix given by
↔
(3)
The second one adopts a minimum statistics as a measure for the inter-speaker variation as follows:
↔
≤ ≤
≤ ≤
(4)
The use of the minimum statistics makes it possible to compare between the acoustically similar groups, which is expected to be effective in suppressing the phonetic difference and focusing on the speaker difference. Instead of the minimum statistics, Malegaonkar et. al. [1] use the adapted Gaussian mixture model for the same purpose.
The proposed method is computationally simpler than that in [1].
The third one applies a weighting factor w emphasizing the frames around the midpoint (i.e. the hypothesized change point) of the m -th window as follows:
↔
≤ ≤
≤ ≤
(5)
where
. We can formulate the selection of the weights w [ i ] as maximizing the expectation of the inter-segment distance
↔ at the speaker-change point. Actually the inter-segment distance in (5) is the inner product between the weight factor w and the min values of D
m. Thus the optimal weights, which make the inner product maximum, are given as the expectation of the min values of D
mat the speaker-change point.
The expected min values E[ min ( D
m)] near the speaker-change points have sharp peak while the E[ min ( D
m)] at the other points are relatively flat. Since the goal of SCD is to discern between the two cases, we select the weight factors which has almost zero values at the start and rise sharply near the center of window. Among the widely used windows, the Kaiser window with
was used in our study. The weighting factor w can remove some of the unwanted false alarms by concentrating on the hypothesized speaker- change point.
In all three considered measures, the inter- segment distance,
↔ , represent the speaker difference, while the intra-segment distances,
and
, represent the average phonetic variations. Thus the SCD score S [ m ] represents a speaker-difference measure normalized by the average intra-phonetic variation. By the widely-adopted assumption that the inter- segment distance at the speaker-change points is greater than the phonetic variations, the final step of the SCD involves setting a threshold which can be used to determine whether the m -th window contains a significant speaker difference or not. Specifically, at each speaker- change point, the score S [ m ] is the locally maximum among the 2 M neighborhood and larger than a predetermined threshold T . In other words, the presence of a speaker-change point is checked adaptively at each window position m as follows:
. ] [
] [ max ]
[
T m S where
k S m
S
m M km M>
=
− << +(6)
As in the other approaches [2], the threshold selection is the tradeoff between the two types of errors, false alarms and miss detections.
2.3. Complexity Considerations
The computational cost is another important issue, since the real-time processing of SCD is often required. For the window size N , the previous BIC-based method typically requires up to O ( N
2) [2] computations in estimating and comparing the statistical models. The compu- tational cost of the proposed method is also O ( N
2). In practice, we reduce computations by only considering the frames with the highest energy at every 100 ms, which corresponds to nine-tenths reduction in the size of window. As in BIC-based methods [1], the sliding-window framework makes the computational cost neces- sary for constructing the distance matrix can be significantly reduced. Only the distances, for the newly added feature vectors, need to be computed.
III. Experimental Results
To evaluate the proposed method, we tested our method on the conTIMIT dataset
1)in [7]
and the speech-excerpt dataset from movies, which is constructed by the authors and available upon request. The conTIMIT dataset consists of 55 recordings of artificially created dialogues along with the ground-truth associated with speaker changes. The recordings have a total duration of about 1 h. The inhouse speech- excerpt dataset is constructed of 15 convert- sations, whose length ranges from 10 s to 46 s.
Compared with the conTIMIT dataset, the speech
1) Avilable at
http://poseidon.csd.auth.gr/LAB_RESEARCH/Latest/data/
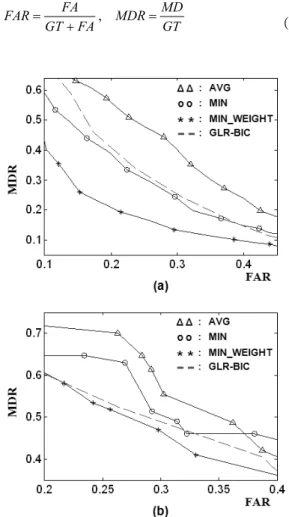
Fig. 3. FAR versus MDR for (a) the conTIMIT dataset and (b) the speech-excerpt dataset from various movies; AVG, MIN, and MIN_WEIGHT refer to the inter-segment distance measures in (3), (4), and (5) respectively.
excerpts from the real-world data have more distortions, such as environmental noise and background music. All the audio recordings are sampled at 16000 Hz. Each recording in the dataset was divided into frames of 32 ms over- lapped by 22 ms. We computed the 20-order MFCC of each frame. The tests in this experi- mental investigation were conducted by sliding a window of 4-s duration ( N =20) through the recording at a rate of 0.1 s between two succes- sive instances of the window. At the threshold test, the value of M was 5.
In evaluating SCD performance, we use the false alarm rate (FAR) and the miss detection rate (MDR) defined by
GT MDR MD FA GT
FAR FA =
= + , (7)
where FA denotes the number of false alarms, MD the number of miss detections, and GT stands for the actual number of speaker change points [2]. As in [7], the tolerance of the results was set to be 1 s. A detected speaker change point is declared to be correct if it is within a 0.5-s margin on either side of the actual speaker change point. The proposed method was compared with the standard GLR-BIC [6-7], where each window is modelled by a multivariate Gaussian distribution with the full covariance. The same features, window length, and adaptive thresholding in (6) were used in both the proposed method and the GLR-BIC.
We obtained the results in Fig. 3 by measuring FAR and MDR by varying the threshold in (6).
AVG, MIN, and MIN_WEIGHT in Fig. 3 refer to the inter-segment distance measures in (3), (4), and (5) respectively. In all three inter-segment distance measures, the SCD score in (1) was used along with the intra-segment distance measure in (2). In case of the conTIMIT dataset, the proposed method, based on the pairwise distance matrix, improved the MDR by more than 2 % (up to 20 %) at the same FAR compared with the standard GLR-BIC method. Among the considered inter-segment distance measures, the one with the minimum statistics and the weight factors has shown the best performance.
In case of the speech-excerpt dataset from movies, the proposed method, with the minimum statistics and the weight factors, showed slightly better performance than the standard GLR-BIC.
As a shortcoming, the proposed method, based
on the pairwise distance matrix, preferred
frequent speaker turns and thus was prone to
the false positives for a long speech without
turns. Combination of the proposed method with
GLR-BIC as in [3] or incorporation of the
speaker-utterance modeling in [7] might be
beneficial as a countermeasure for the shortcoming.
IV. Conclusion
This paper proposes a novel SCD method based on the pairwise distance matrix in an attempt to measure the inter-speaker difference efficiently. Through the use of the minimum statistics along with the relevant weighting factor, the proposed method focuses on the speaker-specific variations rather than the phonetic difference, which is conducive for reducing the false alarms without increasing misdetections. Moreover, the segmentation based on the distance matrix does not require an explicit parametric statistical model, which is needed for most of the previous SCD methods.
Thus the high computational cost involved in estimating and comparing statistical models can be avoided. In the proposed method, the compu- tations in constructing distance matrix are reduced by using the speech frames with the locally highest energy. The performance of the proposed method was experimentally compared with that of the standard GLR-BIC method on both the synthetic and the real-world dialogues. The experimental results show that the proposed method is promising for SCD on both datasets.
Further work includes the application of other graph-theoretic distance measures and the extension of the proposed method to the variable- length windowing.
Acknowledgment
This work was supported by the grant from Gangneung-Wonju National University, 2009.
References
1. A. Malegaonkar, A. Ariyaeeinia, and P. Sivakumaran, “Efficient speaker change detection using adapted gaussian mixture models,” IEEE Trans. Audio, Speech, Language Process. , vol. 15, no. 6, pp. 1859-1869, 2007.
2. M. Kotti, V. Moschou, and C. Kotropoulos, “Speaker segmentation and clustering,” Signal Processing , vol. 88, no. 5, pp. 1091-1124, May 2008.
3. P. Delacourt and C. Wellekens, “Distbic: A speaker-based segmentation for audio data indexing,” Speech Communication , vol. 32, no. 1-2, pp. 111-126, 2000.
4. S. Kwon and S. Narayanan, “Speaker change detection using a new weighted distance measure,” Proc. ICSLP-2002 , pp. 2537-2540, 2002.
5. J. Ajmera, I. McCowan, and H. Bourlard, “Robust speaker change detection,” IEEE Signal Processing Letters , vol. 11, no. 8, pp. 649-651, 2004.
6. B. Chen and P. Gopalakrishnan, “Clustering via the Bayesian information criterion with applications in speech recognition,”
Proc. ICASSP-1998 , pp. 645-648, 1998.
7. M. Kotti, E. Benetos, and C. Kotropoulos, “Computationally efficient and robust bic-based speaker segmentation,” IEEE Trans. Audio, Speech, Language Process. , vol. 16, no. 5, pp. 920-933, 2008.
8. Jin S. Seo, “Speaker change detection based on the pairwise distance matrix,” Proc. ICPR-2010 , pp. 93-96, 2010.
9. C. Ding, X. He, H. Zha, M. Gu, and H. Simon, “A min-max cut algorithm for graph partitioning and data clustering,”
Proc. ICDM-2001 , pp. 107-114, 2001.
10. J. Yuan, H. Wang, L. Xiao, W. Zheng, J. Li, F. Lin, and B.
Zhang, “A formal study of shot boundary detection,” IEEE Trans. Circuit and Systems for Video Tech. , vol. 17, no. 2, pp. 168-186, 2007.
【Profile】
∙ Jin Soo Seo
Received the B.S., M.S., and Ph.D. degrees from Korea Advanced Institute of Science and Technology in 1998, 2000, and 2005 respectively, all in electrical engineering. While working toward Ph.D. degree, he was an adjunct research staff at Electronics and Telecommunications Research Institute (ETRI) in 2001 and a thesis trainee at Philips Research Eindhoven in 2002.
He was a senior researcher at ETRI from 2006 to 2008. He joined the Department of Electrical Engineering at Gangneung-Wonju National University in 2008. His research interests are speech and audio processing, multimedia retrieval, and pattern recognition.