J. Kor. Soc. Fish. Tech., 44(3), 194 206, 2008 DOI:10.3796/KSFT.2008.44.3.194
Standardization of CPUE for bigeye(Thunnus obesus) and yellowfin(Thunnus albacares) tunas by the Korean longline fishery
in the Indian Ocean
Youjung K
WON, Doo Hae A
N1, Jae Bong L
EE2*, Chang Ik Z
HANGand Dae Yeon M
OON1Department of Fisheries Physics, Graduate School, Pukyong National University, Busan, 608-737, Korea
1
Distant Water Fisheries Resources Division, National Fisheries Research and Development Institute, Busan, 619-902, Korea
2
Fisheries Resources Research Division, National Fisheries Research and Development Institute, Busan, 619-902, Korea
This study standardized catch per unit effort(CPUE) of the Korean longline fishery, which has been used to assess the status of stock as an index of abundance, for bigeye and yellowfin tunas in the Indian Ocean. The Generalized Linear Model(GLM) was used to analyze the fishery data, which were catch in number and effort data collected each month from 1971 to 2007 by 5 5 degree of latitude and longitude. Explanatory variables for the GLM analysis were year, month, fishing area, number of hooks between floats(HBF), and environment factors. The HBF was divided into three classes while the area was divided into eight sub- areas. Although sea surface temperature(SST) and southern oscillation index(SOI) were considered as environmental factors, only SST was used to build a model based on statistical significance. Standardized CPUE for yellowfin tuna showed a declining trend, while nominal CPUE for the species showed an increasing trend.
*
Corresponding author: [email protected], Tel: 82-51-720-2296, Fax: 82-51-720-2277(Class Osteichthyes) (Order Perciformes) (Family Scom-
bridae) , , ,
, .
,
(FAO, 1997). , (T. obesus)
, ( 0
250m) (FAO, 2003). 10 N 10 S
4 9 , 1 3
. (T. albacares)
,
(FAO, 2003).
, (Indian Ocean Tuna
Commission, IOTC) .
1950
38 50
(FAO, 2007),
6 52%
. Fig. 1(a)
6
. 1980 10
. 1960
, , ,
. 1980
, ,
30 .
1960 1970
1980
.
, 1977 6 5
1998 1
. Fig. 1(b)
, ,
, .
Key words : Bigeye tuna Thunnus obesus, Yellowfin tuna Thunnus albacares, Standardized CPUE, Generalized Linear Model, Indian Ocean
Fig. 1. Annual catches of bigeye and yellowfin tunas by country (a) and of Korean longline fishery by species (b) in the Indian Ocean(FAO, 2007).
400 300 200 100 0 80 60 40 20 0
1950 1955 1960 1065 1970 1975 1980 1985 1990 1995 2000 2005
1950 1955 1960 1065 1970 1975 1980 1985 1990 1995 2000 2005 Catch(103mt)
Year (a)
(b)
(Polacheck et al., 1993),
(catch per unit effort,
CPUE) (Maunder, 2001).
, CPUE
( , , , ,
)
(Hilborn and Walters, 1992; Maunder and Starr, 1995; Hinton and Nakano, 1996).
CPUE
(Hinton and Nakano, 1996).
, IOTC
. 1970
CPUE .
,
, ,
,
CPUE .
CPUE
.
1971 2007
5 5
.
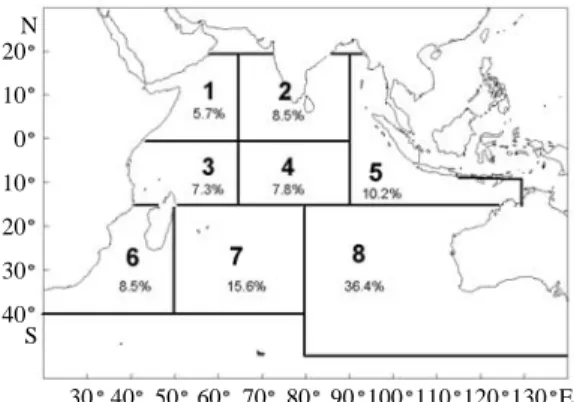
(IOTC) 51 57 7
Okamoto and Shono(2006)
Fig. 2 7
8 . CPUE
, ( ),
(number of hooks between floats, HBF)
. HBF
9 , 10 15 , 16
3 ,
(southern oscillation index,
SOI) (SST)
.
CPUE
(Generalized Linear Model, GLM) , (analysis of variance, ANOVA)
, SAS(version 9.1 for
Windows) .
CPUE (multiplicative error structure)
(Quinn and Deriso, 1999)
Fig. 2. Regional structure for standardizing CPUE in the Indian Ocean(Numbers of percent indicate the relative proportions of sub-area) (modified from Okamoto and Shono, 2006).
N 20 10 0 10 20 30 40S
30 40 50 60 70 80 90 100 110 120 130 E
(log-normal distribution) .
(GLM; Nelder and Wedderburn, 1972) CPUE
(Maunder and Punt,
2004). (1)
,
(Guisan et al., 2002).
g( μ
i) X
iT
β (1)
g , μ
iE(Y
i) ,
X
ii
, β , Y
ii
. (1)
CPUE
(2) .
(IOTC) CPUE
, , ,
(Okamoto et al., 2007;
Liu et al., 2007; Wang et al., 2006).
CPUE
(CPUE 0) CPUE
(c 0.1) (Maunder and Punt, 2004).
(dummy variable)
,
.
log(U
ijklc) μ Y
iM
jA
kH
lE (interaction) (2)
U
ijkl1,000 , c
, μ , Y
ii CPUE
, M
jj CPUE , A
kk
CPUE , H
lHBF
CPUE , E CPUE
. , CPUE (Y
i)
(Maunder and Punt, 2004),
(interaction)
. (E)
,
(T) .
(2) (3) (4)
, (3) , (4)
CPUE .
log(U
ijklc) μ Y
iM
jA
kH
lT
(Y A) (A H) (M H) (M T) (3) log(U
ijklc) μ Y
iM
jA
kH
lT
(Y A) (Y T) (M A)
(A H) (T H) (4)
(3) (4) Y A
(least square mean, LSM) (5) Shono and Ogura(1999)
CPUE .
U
i∑ W
k(e
LSM(Yi Ak)c) (5)
U
ii CPUE, W
kk , (Fig. 2)
1 ( ∑ W
k1).
1971 2007
Fig. 3 1978
80 90
, CPUE (r 0.524, P 0.001).
1 5
. 1970
1 3
, 1990
.
CPUE 7(r 0.038, P 0.1)
Fig. 4. Time series of annual catch and CPUE of yellowfin tuna by sub-area in the Indian Ocean.
200
100
0 100
50
0 8
4
01971 1975 1979 1980 1984 1988 1995 1999 2003 2007 1971 1975 1979 1980 1984 1988 1995 1999 2003 2007
Year
Catch(103individuals) CPUE(No/103hooks)
1971 1975 1979 1980 1984 1988 1995 1999 2003 2007 40
20
0 60
30
0 2
1
0
400
200
0 60
30
0 600
300
0 20
10
0 10
5
0 30
15
0
20
10
0 20
10
0 4
2
0
20
10
0 30
15
0 20
10
0
Fig. 3. Time series of annual catch and CPUE of bigeye tuna by sub-area in the Indian Ocean.
300
150
0 200
100
0 8
4
0
1971 1975 1980 1984 1988 1995 1999 2003 2007 1971 1975 1979 1980 1984 1988 1995 1999 2003 2007
Year
Catch(103individuals) CPUE(No/103hooks)
1971 1975 1979 1980 1984 1988 1995 1999 2003 2007 100
50
0 200
100
0 8
4
0 20
10
0 20
10
0 20
10
0
300
150
0 12
6
0 800
400
0 20
10
0 20
10
0 20
10
0
20
10
0 10
5
0 20
10
0
.
Fig. 4 ,
1978
. CPUE
1980
(r 0.455, P 0.005).
1 3
6 8
. 1978
60% 3
. CPUE
. 1971 2007
, 1980
. Fig. 5
, 3
, CPUE
5 6 .
, CPUE
( r 0.381,
P 0.352; r 0.451, P 0.282).
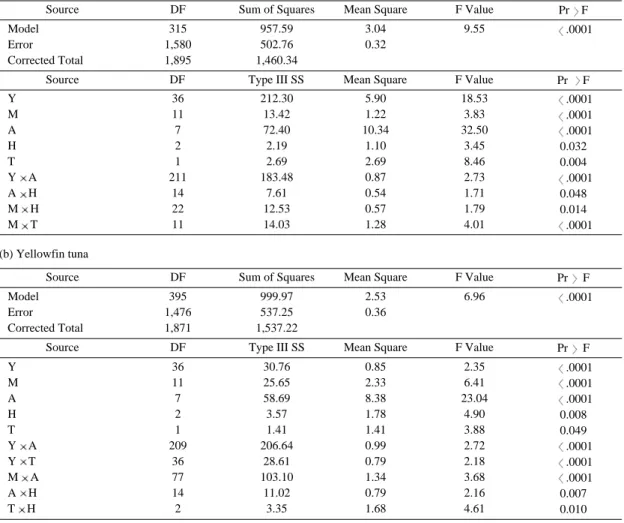
Table 1 1971
2007 , ,
, ANOVA .
Type
, , , , ,
. CPUE
.
Y A, A H, M H, M
T ,
Y A, Y T, M A, A H, T H
. CPUE
Fig. 6
.
Fig. 7 (STD) CPUE
(nominal)
. , CPUE
1970 1970
1980 .
, 1980 CPUE
. , CPUE
1980 1990
2000 ,
Fig. 5. The correlation between accumulative catch andCPUE of (a) bigeye and (b) yellowfin tunas by sub-area in the Indian Ocean.
3
2
1
0 3
2
1
0
1 2 3 4 5 6 7 8
Area (a)
(b)
Accumulative catch(106individuals) CPUE(No/103hooks)
12
8
4
0 12
8
4
0
.
CPUE Fig. 7(a) 1978
(r 0.407, P 0.001). ,
CPUE (CV)
(F 2.38, P 0.01),
(t 4.49, P 0.001). CPUE CPUE
1970 1980
1990 ,
2000
. CPUE Fig. 7(b)
(r 0.463, P 0.004),
. CPUE
(CV)
(F 1.93, P 0.05), (t 4.86, P
0.001). CPUE 1970
1980
Table 1. Results of ANOVA for standardizing CPUE (a) Bigeye tuna
Source
Source Model Error
Corrected Total Source
Source Y
M A H T
Y A
Y T
M A
A H
T H
Y M A H T
Y A
A H
M H
M T
Model Error
Corrected Total
DF Sum of Squares Mean Square F Value Pr F
DF Sum of Squares Mean Square F Value Pr F
395 1,476 1,871
999.97 537.25 1,537.22
2.53 0.36
6.96 .0001
DF Type III SS Mean Square F Value Pr F
DF Type III SS Mean Square F Value Pr F
36 11 7 2 1 209
36 77 14 2
30.76 25.65 58.69 3.57 1.41 206.64
28.61 103.10
11.02 3.35
0.85 2.33 8.38 1.78 1.41 0.99 0.79 1.34 0.79 1.68
2.35 6.41 23.04
4.90 3.88 2.72 2.18 3.68 2.16 4.61
.0001 .0001 .0001 0.008 0.049 .0001 .0001 .0001 0.007 0.010 36
11 7 2 1 211
14 22 11
212.30 13.42 72.40 2.19 2.69 183.48
7.61 12.53 14.03
5.90 1.22 10.34
1.10 2.69 0.87 0.54 0.57 1.28
18.53 3.83 32.50
3.45 8.46 2.73 1.71 1.79 4.01
.0001 .0001 .0001 0.032 0.004 .0001 0.048 0.014 .0001 315
1,580 1,895
957.59 502.76 1,460.34
3.04 0.32
9.55 .0001
where, Y: year, M: month, A: sub-area, H: number of hooks between floats, T: sea surface temperature, DF: degree of freedom
(b) Yellowfin tuna
Fig. 6. Histogram of residuals in GLM. (a) Bigeye tuna, (b) Yellowfin tuna.
Fig. 7. Time series of nominal and standardized CPUEs (left panel) and their anomalies (right panel) for (a) bigeye and (b) yellowfin tunas in the Indian Ocean. STD indicates standardized CPUE.
450 420 390 360 330 300 270 240 210 180 150 120 90 60 30 0
Frequency
Standardized residual
(a) (b)
-5.0 -4.5 -4.0 -3.5 -3.0 -2.5 -2.0 -1.5 -1.0 -0.5 0.0 0.5 1.0 1.5 2.0 2.5 3.0 3.5 4.0 4.5 5.0 -5.0 -4.5 -4.0 -3.5 -3.0 -2.5 -2.0 -1.5 -1.0 -0.5 0.0 0.5 1.0 1.5 2.0 2.5 3.0 3.5 4.0 4.5 5.0
15.0
10.0
5.0
15.0
10.0
5.0
0.0
8 6 4 2 0 -2 -4 -6 8 6 4 2 0 -2 -4 -6
8 6 4 2 0 -2 -4 -6 8 6 4 2 0 -2 -4 -6
1971 1974 1977 1980 1983 1986 1989 1992 1995 1998 2001 2004 2007 1971 1977 1983 1989 1995 2001 2007
1971 1977 1983 1989 1995 2001 2007 1971 1974 1977 1980 1983 1986 1989 1992 1995 1998 2001 2004 2007
Year (a)
(b)
CPUE(No/103hooks) Anomaly
Year
, 1990 .
CPUE Fig. 8
.
CPUE(r 0.750) (r 0.524)
43% ,
CPUE(r 0.667) (r 0.456) 47%
.
Fig. 9 (r 0.181, P 0.1), CPUE
CPUE CPUE
(r 0.481, P 0.01).
CPUE
. CPUE , ,
Fig. 8. Correlationships between catch and CPUEs for bigeye and yellowfin tunas in the Indian Ocean. (a) & (c) Catch vs.
Nominal CPUE, (b) & (d) Catch vs. STD CPUE. STD means standardized CPUE.
800 600 400 200 0 800 600 400 200 0
0 3 6 9 12 15 0 3 6 9 12 15
Catch(103individuals)
Nominal CPUE (a)
(c)
(b)
(d)
STD CPUE
Fig. 9. Correlationships of CPUEs between bigeye and yellowfin tunas. (a) Nominal CPUE, (b) Standardized CPUE.
15 12 9 6 3 0 15 12 9 6 3 0
0 3 6 9 12 15
Bigeye tuna (a)
(b)
Yellowfin tuna
,
. CPUE
(Maunder, 2001). CPUE
.
Gavaris(1980) , , , ,
, CPUE
, Olsen and Laevastu(1983)
CPUE 32
.
, ,
, , ,
.
(H), (A),
(T)
(M) (Y)
CPUE .
,
CPUE .
, CPUE
(Y A) (A H)
.
(Polacheck, 2006).
( , ,
) CPUE
.
, Fig. 7
CPUE
.
CPUE CPUE
,
. CPUE
.
CPUE
.
CPUE .
.
.
(Maunder and Harley, 2005; ICCAT, 2005; Hampton et al., 2006a).
,
(IOTC, 2007; Hoyle and Maunder, 2005; ICCAT, 2004; Hampton et al., 2006b).
CPUE
. IOTC (2007) 1960
CPUE 1980 CPUE
, 1960
1980 CPUE
. CPUE 1960 1980
, 1980
CPUE
(IOTC, 2007).
CPUE Fig. 7
. CPUE
. Fig. 1(a) ,
, 1970
80
1970 1980
CPUE .
CPUE
. ,
. , 150m
(IOTC, 2007),
CPUE .
,
,
(Indian scillation index, IOI)
. , CPUE
.
, 1970
CPUE
,
.
CPUE
(Maunder and Punt, 2004).
, ,
.
CPUE .
, , ,
CPUE ,
CPUE , (Y A)
(A H)
. CPUE
CPUE
. CPUE
, CPUE
1970 1980
CPUE ,
2000 .
1970 10
.
FAO, 1997. Review of the state of world fishery resources: Marine Resources Service. FAO Fisheries Circular., No. 920, pp. 173.
FAO, 2003. Managing fishing capacity of the world tuna fleet. FAO Fisheries Circular., No. 982, pp. 82.
FAO, 2007. Capture production 2005. FAO Yearbook of Fishery Statistics, Vol. 100/1. pp. 539.
Gavaris, S., 1980. Use of a multiplicative model to estimate catch rate and effort from commercial data.
Can. J. Fish. Aquat. Sci., 37, 2272 2275.
Guisan, A., Jr. T.C. Edwards and T. Hastie, 2002.
Generalized linear and generalized additive models in studies of species distributions: setting the scene.
Ecol. modell., 157, 89 100.
Hampton, J., A. Langley and P. Kleiber, 2006a. Stock assessment of bigeye tuna in the Western and Central Pacific Ocean, including an analysis of management options. WCPFC-SC2-2006/SA WP 2, pp. 103.
Hampton, J., A. Langley and P. Kleiber, 2006b. Stock assessment of yellowfin tuna in the Western and Central Pacific Ocean, including an analysis of management options.WCPFC-SC2-2006/SA WP 1, pp. 99.
Hilborn, R. and C.J. Walters, 1992. Quantitative fisheries stock assessment: choice, dynamics and uncertainty.
Chapman and Hall, New York, pp. 570.
Hinton, M.G. and H. Nakano, 1996. Standardizing catch and effort statistics using physiological, ecological, or behavioral constraints and environmental data, with an application to blue marlin(Makaira nigricans) catch and effort data from Japanese longline fisheries in the Pacific. Inter-Am. Trop. Tuna Comm. Bull., 21, 171 200.
Hoyle, S.D. and M.N. Maunder, 2005. Status of yellowfin tuna in the Estern Pacific Ocean in 2004 and outlook for 2005. Inter-Amer. Trop. tuna Comm. Stock Assess. Rep., pp. 102.
ICCAT(International Commission for the Conservation of Atlantic Tunas), 2005. Report of the 2004 ICCAT bigeye tuna stock assessment session. 58(1), pp.110.
IOTC(Indian Ocean Tuna Commssion), 2007. Report of the Ninth Session of the IOTC Working Party on Tropical Tunas. IOTC-2007-WPTT-R[E], pp. 44.
Liu, H., S. Chang and S. Chang, 2007. Catch rate standardization runs for yellowfin yuna caught by
Taiwanese deep sea longline fishery in the Indian Ocean using generalized linear model and generalized linear mixed model. IOTC-2007-WPTT-19, pp. 13.
Maunder, M.N., 2001. A general framework for integrating the standardization of catch per unit of effort into stock assessment models Can. J. Fish.
Aquat. Sci., 58, 795 803.
Maunder, M.N. and S.J. Harley, 2005. Status of bigeye tuna in the Estern Pacific Ocean in 2004 and outlook for 2005. Inter-Amer. Trop. tuna Comm. Stock Assess. Rep., pp. 206.
Maunder, M.N. and A.E. Punt, 2004. Standardizing catch and effort data: a review of recent approaches. Fish.
Res., 70, 141 159.
Maunder, M.N. and P.J. Starr, 1995. Rock lobster standardized CPUE analysis. New Zealand Fisheries Assessment Res. Doc. 95/11. [Available from National Institute of Water and Atmospheric Research (NIWA), Greta Point, P.O. Box 297, Wellington, N.Z.], pp. 28.
Nelder, J.A. and R.W.M. Wedderburn. 1972. Generalized linear models. J. R. Statist. Soc., 137, 370 384.
Okmoto, H. and H. Shono, 2006. Japanese longline CPUE for bigeye tuna in the Indian Ocean up to 2004 standardized by GLM applying gear material information in the model. IOTC-2006-WPTT-1, pp. 17.
Okmoto, H., H. Shono and T. Nishida, 2007. Japanese longline CPUE for yellowfin tuna in the Indian Ocean up to 2005 standardized by GLM. IOTC- 2007-WPTT-10, pp. 23.
Olsen, S. and T. Laevastu, 1983. Factors affecting catch of longlines, evaluated by a simulation model of longline fishing. Draft manuscript for ICES Fish Capture Comm., pp. 13.
Polacheck, T., 2006. Tuna longline catch rates in the Indian Ocean: Did industrial fishing result in a 90%
rapid decline in the abundance of large predatory species?, Mar. Pol., 30(5), 470 482.
Polacheck, T., R. Hilborn, and A.E. Punt, 1993. Fitting surplus production models: comparing methods and
measuring uncertainty. Can. J. Fish. Aquat. Sci., 50, 2597 2607.
Quinn, II T.J. and R.B. Deriso, 1999. Quantitative fish dynamics. Oxford University Press. New York, pp.
542.
Shono, H. and M. Ogura, 1999. The standardized skipjack CPUE including the effect of searching devices, of the Japanese distant water pole and line fishery in the Western Central Pacific Ocean.
ICCAT-SCRS/99/59, pp. 18.
Wang, S., S. Chang, T. Nishida and S. Lin, 2006. CPUE standardization of Indian Ocean swordfish from Taiwanese longline fishery for Data up to 2003.
OTC-2006-WPB-09, pp. 13.