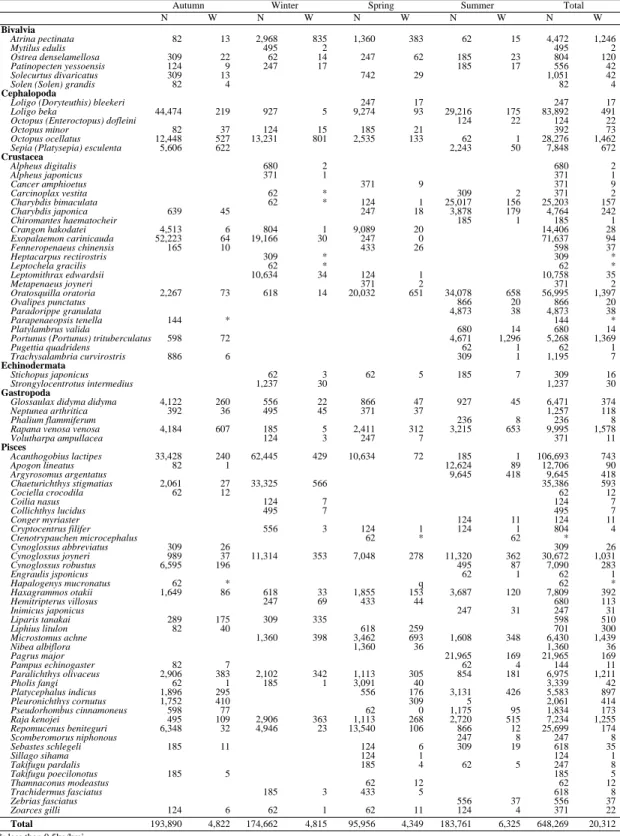
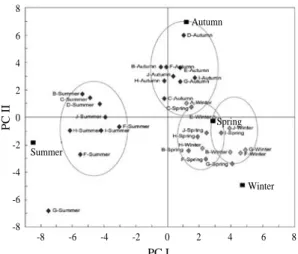
Seasonal variation of fisheries resources composition in the coastal ecosystem of the middle Yellow Sea of Korea
13
0
0
전체 글
(2)
(3)
(4)
(5)
(6)
(7)
(8)
(9)
(10)
(11)
(12)
(13)
수치


+3

관련 문서
MP Yousef Al-Fadalah, Supervisor of Parliament Business Environment Committee declared that the Public Institution for Housing Care intends to dedicate nearly 150
Due to the heavy downpours during the coming few hours, and anticipations of Meteorological Department that weather fluctuation shall continue, it has been decided
Kuwait Direct Investment Promotion Authority (KDIPA) said the 2019 Doing Business Report of the World Bank Group, came in recognition of the reforms made between June 2, 2017, and
In a statement to Kuwait News Agency (KUNA) on the sidelines of a meeting of the Arab Parliament's Foreign Affairs Political and National Security
The meeting was attended by Assistant Foreign Minister for GCC Affairs, Ambassador, Nasser Al-Muzayyen, and Deputy Assistant Foreign Minister for the Office of the
“ Sheikh Nasser has a written message from HH the Amir, Sheikh Sabah Al-Ahmad Al-Jaber Al-Sabah to the Chinese President, Chi Gen Beng related to enhancing mutual
On his part, CEO of Express Roads Authority, Saud Al-Naqqi said that the heavy rains of the previous day led to clogging parts of the express
Kuwait will celebrate on Sunday the fourth anniversary of the UN honoring and proclamation of His Highness the Amir, Sheikh Sabah Al-Ahmad Al-Jaber Al-Sabah as
