A Technology Analysis Model using Dynamic Time Warping
1)
JunHyeog, Choi *, SungHae, Jun**
Abstract
Technology analysis is to analyze technological data such as patent and paper for a given technology field. From the results of technology analysis, we can get novel knowledge for R&D planing and management. For the technology analysis, we can use diverse methods of statistics. Time series analysis is one of efficient approaches for technology analysis, because most technologies have researched and developed depended on time. So many technological data are time series. Time series data are occurred through time. In this paper, we propose a methodology of technology forecasting using the dynamic time warping (DTW) of time series analysis. To illustrate how to apply our methodology to real problem, we perform a case study of patent documents in target technology field. This research will contribute to R&D planning and technology management.
▸Keywords : Patent big data, Time series clustering, Dynamic time warping, Management of technology
∙제1저자 : 최준혁
∙접수일 : 2015. 1. 7, 심사일 : 2015. 1. 13, 심사완료일 : 2015. 2. 7.
* 김포대학교 비서경영과 교수(Dept. of Secretarial Management)
**청주대학교 통계학과 교수(Dept. of Statistics, Cheongju University)
※ 이 논문은 2014학년도 김포대학교의 연구비 지원에 의하여 연구되었음
I. Introduction
We should make R&D planning for technology management in companies and nations. In the age of limitless competition, the technology is very important issue for surviving a company continuously [1]. So many researches about management of technology (MOT) have been published in the diverse fields such as business, computer science, or management engineering [2-3].
Technology analysis is one of the MOT works.
Technology analysis is to analyze technological data which are the researched and developed results of given technology, the technological data are patent documents, papers, or articles [4]. In general, the results of technology analysis are used for technology forecasting and innovation, in addition, these are applied to build the R&D planning [1],[5-6]. In this paper, we consider patent documents as technological data, because a patent includes much more information of developed technology such as title and abstract of applied patent, inventors' name, applied and registered date, international patent classification (IPC) code, claims, figures, citation information, and so forth [7]. Also, patent has more practical results of researched and developed technologies than paper, because the technology of registered patent are protected by government for a limited period.
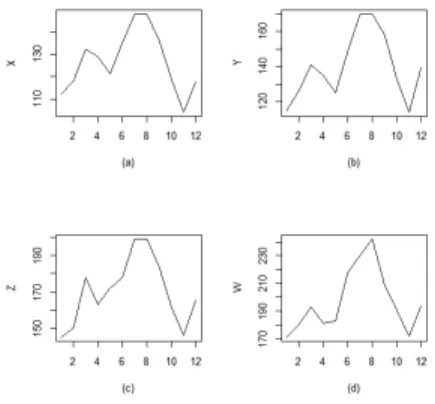
The technology data based on patent are depended on time, because most technologies are developed over time. So in this paper, we propose a technology analysis using time series analysis methods. We apply the dynamic time warping (DTW), which is one of time series clustering, for technology forecasting. This finds proper alignment between two time dependent data [8-9]. Figure 1 shows four time series data.
Figure 1. Time Series Data
Using the DTW of time series analysis, we can cluster the time series data to similar groups from four time dependent sequences, X, Y, Z, and W. The X, Y, Z, and W represent the time trends of four different technologies respectively. The DTW compares the features of four technologies over time, and assigns them to optimal clusters [10]. In our research, we perform technology analysis using the DTW for the R&D planning of company and nation.
To verify the performance of our work, we show a case study using collected patent documents of target technology. Next section deals with the research background related to our study. In section three, we show our proposed methodology which is a technology analysis using the DTW. The experimental result of our case study is shown in section four. The conclusions of this paper are in the last section.
Ⅱ. Related Works
1 Technology Analysis
Technology analysis is to analyze the results of
researched and developed technologies based on
bibliometrics such as patent documents or papers
[11-12]. A patent has diverse information about
developed technologies, which are registered date,
title, abstract, drawing, figure, claims, technology
classification code, inventor's name, citation, etc [13-15]. Also a paper includes theoretical information of researched technologies, authors' name, title, abstract, proposed method, experimental results, and so on [13]. In addition, we can get the resource data for technology analysis from others such as articles, or web documents. Next figure shows general process of technology analysis based on statistics, machine learning algorithm and Delphi.
Figure 2. Technology Analysis Process
In this paper, we sonsider time series analysis as one of technology analysis methods. Also we use patent documents as one of the results of researched and developed technologies.
2 Time Series Clustering
Patent includes the characteristic of time, and patent documents are depended on date, applied, filing dates. In this paper, we consider patents are time series date. Time series are the observed data through time. Form many methods of time series analysis, we use a time series clustering based on the DTW. That is, time series clustering is to cluster time series data to similar clusters [16]. Also, we consider the DTW, one of various distance measures [17-19]. In our research, We assign sub technologies and technological keywords to similar clusters by the DTW.
III. Technology Analysis using Dynamic Time Warping
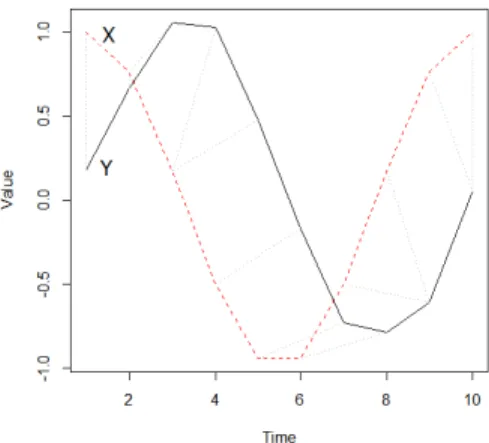
Dynamic time warping (DTW) is a method to search an optimal alignment between two time series data [10]. Next figure shows an example of two time series data X (dotted line) and Y (solid line).
Figure 3. Two Time Dependent Sequences
The DTW computes the similarity value between time series X and Y using the feature distance of X and Y. This compares their paired peak and valley values (points) one by one. In addition, the DTW has been used in diverse data mining fields such as automatic recognition of speech patterns, or information retrieval [10],[17]. Using the DTW, we can compare two time series data X and Y as (1).
(1)
The time sequences of length N and M are discrete time series. Also we should define a feature space F, and then and are included in F,
and . To compare the
features of x and y, we use local distance measure
(ldm) as (2) [10].
× →≥ (2)
When is small, then the time dependent sequences x and y are similar to each other. If is large, then we can decide the x and y are dissimilar to each other. So, in the technology analysis works, we perform technology clustering using the following DTW result.
Figure 4. Two DTW Matrix for Technology Analysis
If we determine a target technology, we classify the technology into p sub technologies ( ). In the above figure, we compute all ldm values between and
( ) for constructing the DTW matrix.
Instead of the sub technologies, we can apply keywords or international patent classification (IPC) codes of patent documents to build the DTW matrix.
In this paper, we propose a R&D planning approach by technology analysis using the DTW. Next figure shows the process of our study.
Figure 5. Process of Technology Analysis using DTW
First we define sub technologies or extract keywords or IPC codes from retrieved technological documents such as patent and paper. Second we make DTW matrix by the ldm for time series analysis. We build R&D planning by the result of technology analysis for companies and nations.
IV. Experiment and Result
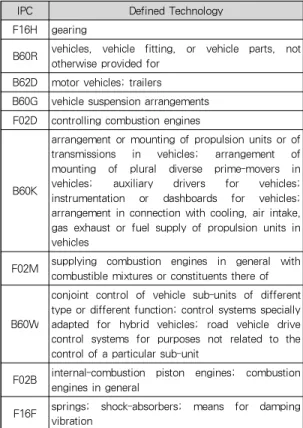
To verify the performance of this paper, we used patent documents form patent database [20]. We selected the patent documents applied by Hyundai motors, the patents of Hyundai were analyzed in the previous research [21]. The research dealt with decision tree methods, this was not time series analysis [21]. For performing our experiment, we use R and R package of "dtw" [22-23]. In this paper, we top ten IPC codes extracted from the Hyundai
IPC Defined Technology
F16H gearing
B60R vehicles, vehicle fitting, or vehicle parts, not otherwise provided for
B62D motor vehicles; trailers B60G vehicle suspension arrangements F02D controlling combustion engines
B60K
arrangement or mounting of propulsion units or of transmissions in vehicles; arrangement of mounting of plural diverse prime-movers in vehicles; auxiliary drivers for vehicles;
instrumentation or dashboards for vehicles;
arrangement in connection with cooling, air intake, gas exhaust or fuel supply of propulsion units in vehicles
F02M supplying combustion engines in general with combustible mixtures or constituents there of
B60W
conjoint control of vehicle sub-units of different type or different function; control systems specially adapted for hybrid vehicles; road vehicle drive control systems for purposes not related to the control of a particular sub-unit
F02B internal-combustion piston engines; combustion engines in general
F16F springs; shock-absorbers; means for damping vibration
Table 1. Top Ten IPC Codes and Defined Technologies
patents as its sub technologies. Table 1 shows the IPC codes and their defined technologies.
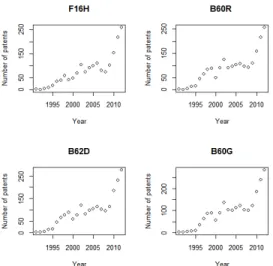
We knew the defined technologies of top ten IPC codes by WIPO(World Intellectual Property Organization) [24-25]. These are the most popular technologies in Hyundai motors company. To find more detailed results of Hyndai technology analysis by time series analysis, we plotted the applied numbers of top ten IPC codes over year from the retrieved patent documents. Next figure shows the scatter plots of top four IPC codes of "
F16H", "B60R","B62D", and "B60G".
Figure 6. Time Series Plots of F16H B60R B62D B60G
Though the overall trends of the plots are similar to each other, the bottom-up trends are different to each other. In this paper, we find the difference between the IPC codes by the DTW measure. Next figure shows the plots of the remained IPC codes except top four IPC codes.
Using these time series patterns, we partition the top ten IPC codes to the similar clusters by the DTW. We can perform the R&D planning for Hyundai using the result of time series clustering.
Next figure shows the result of time series clustering based on the DTW when the number of clusters is two.
Figure 8. DTW Time Series Clustering: Number of Clusters=2
In technology development of Hyndai, the technology of F16H has very different pattern to other technologies. But we need to divide the nine IPC codes more detailed. Next we perform the time series clustering deciding three as the number of clusters.
Figure 7. Time Series Plots of F02D B60K F02M B60W F02B F16F
Figure 9. DTW Time Series Clustering: Number of Clusters=3
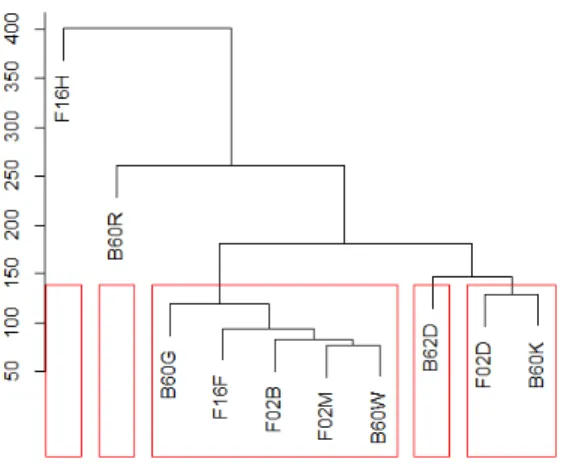
Except the technology of F16H, the technology of B60R is different to other eight IPC codes. Next two figures show the clustering results when the numbers of clusters are four and five respectively.
Figure 10. DTW Time Series Clustering: Number of Clusters=4
Using the DTW results, we can plan the R&D management efficiently for Hyundai company. For example, if the number of the research and developing groups is four, we can assign four technology developing teams as follow,
Team1: research and develop the technology of F16H.
Team2: research and develop the technology of
B60R.
Team3: research and develop the technology of B60G, F16F, F02B, F02M, and B60W.
Team4: research and develop the technology of B62D, F02D, and B60K.
Other cases are same to this. In this experiment, we focused on the time series trend of developed technology by the DTW.
V. Conclusions
In this paper, we propose a technology analysis using time series analysis, because most results of researched and developed technologies are depended on time. We used time series clustering as one of time series analysis methods, also we consider the DTW for the distance measure of time series clustering. To show how our research applied to real domain, we performed a case study of Hyundai motor company using the applied patent documents related to Hyundai. We found the DTW results according to the cluster sizes. This can be used for assigning the R&D groups to target technologies efficiently. Our research contributes to the R&D maangement of a company or nation. In our future studies, we will develop more advanced methodology
Figure 11. DTW Time Series Clustering: Number ofClusters=5
for time series data in technology analysis.
REFERENCES
[1] Roper, A. T., Cunningham, S. W., Porter, A.
L., Mason, T. W., Rossini F. A., Banks J.
Forecasting and Management of Technology, John Wiley & Sons, 2011.
[2] Cyert, R. M., Kumar, P., “Technology Management and the Future”, IEEE Transactions on Engineering Management, Vol.
41, No. 4, pp. 333-334, 1994.
[3] McDermott, C. M., Kang, H., Walsh, S., “A Framework for Technology Management in Services”, IEEE Transactions on Engineering Management, Vol. 48, No. 3, pp. 333-341, 2001.
[4] Jun, S., Park, S., Jang, D. “Technology Forecasting using Matrix Map and Patent Clustering”, Industrial Management & Data Systems, Vol. 112, Iss. 5, pp. 786-807, 2012.
[5] Martino, J. P., “Technology forecasting–An overview”, Management Science, Vol. 26, No. 1, pp. 28-33, 1980.
[6] Yun, Y. C., Jeong, G. H., Kim, S. H., “A Delphi technology forecasting approach using a semi-Markov concept”, Technological Forecasting and Social Change, Vol. 40, pp.
273-287, 1991.
[7] Hunt, D., Nguyen, L., Rodgers, M., Patent Searching Tools & Techniques, Wiley, 2007.
[8] Keogh, E. J., Pazzani, M. J. "Derivative dynamic time warping," Proceedings of the 1st SIAM International Conference on Data Mining, pp. 1-11, 2001.
[9] J. Choi, S. Jun, "Time Series Clustering for Patent Big Data", Proceedings of Asia Workshop on Convergence Information Technology of KSCI 2014, pp. 159-162.
[10] Müller, M., Information Retrieval for Music and Motion, Springer, pp. 69-84, 2007.
[11] Daim, T. U., Rueda, G., Martin, H., Gerdsri,
P. "Forecasting emerging technologies: Use of bibliometrics and patent analysis", Technological Forecasting and Social Change, Vol. 73, Iss. 8, pp. 981–1012, 2006.
[12] Jun, S. “IPC Code Analysis of Patent Documents Using Association Rules and Maps-Patent Analysis of Database Technology”, Communications in Computer and Information Science, Vol. 258, pp. 21-30, 2011.
[13] Hwang, J., Kim, B. "Analysis on the multi‐
technology capabilities of Korea and Taiwan using patent bibliometrics," Asian Journal of Technology Innovation, Vol. 14, No. 2, pp. 183–
199, 2006.
[14] Jun, S., Park, S., Jang, D., “Technology Forecasting using Matrix Map and Patent Clustering”, Industrial Management & Data Systems, Vol. 112, Iss. 5, pp. 786-807, 2012.
[15] Mishra, S., Deshmukh, S. G., Vrat, P.,
“Matching of technological forecasting technique to a technology”, Technological Forecasting and Social Change, Vol. 69, pp. 1-27, 2002.
[16] Zhang, X., Liu, J., Du, Y., Lv, T., “A Novel Clustering method on Time Series Data,” Expert Systems with Application, Vol. 38, pp.
11891-11900, 2011.
[17] Rabiner, L. R., Juang, B. H., Fundamentals of Speech Recognition, Prentice Hall Signal Processing Series, 1993.
[18] Zhao, Y., R and Data Mining – Examples and Case Studies, Academic Press, Elsevier, 2013.
[19] Liao, T. W., “A Clustering Procedure for Exploratory Mining of Vector Time Series,”
Pattern Recognition, Vol. 40, pp. 2550-2562, 2007.
[20] WIPSON, WIPS Corporation, http://www.wipson.com, 2014.
[21] Lee, S., Jun, S., "Key IPC Codes Extraction Using Classification and Regression Tree Structure," Advances in Intelligent Systems and ComputingVolume 271, pp 101-109, 2014.
[22] R Development Core Team, R: A language and
environment for statistical computing, R Foundation for Statistical Computing, www.r-project.org, 2014.
[23] Giorgino, T., Package ‘dtw’ - Dynamic time
warping algorithms, R CRAN
dtw.r-forge.r-project.org, 2014.
[24] WIPO IPC, International Patent Classification(IPC), World Intellectual Property Organization,
www.wipo.int/classifications/ipc/en, 2014.
[25] WIPO, World Intellectual Property Organization, www.wipo.org, 2014.
저 자 소 개
최 준 혁1995: 인하대학교 전자계산공학과 석사 2000: 인하대학교 전자계산공학과 박사 2003: 연세대학교 대학원 경영학 석사 2013: 연세대학교 대학원 경영학 박사
(기술경영학전공)
1997~현재: 김포대학교 비서경영과 교수
2001~2002: 한국전자통신연구원 컴퓨터 소프트웨어연구소 (초빙연구원) 2014~현재: 김포대학교 국제교류처장 2014~현재: 김포대학교
비서경영과교수 관심분야: 기술경영, 지능형 알고리즘,
USN, 임베디드 시스템, 전자상거래 보안 Email : [email protected] 전 성 해
2001: 인하대학교 통계학과 이학박사 2007: 서강대학교 컴퓨터공학과
공학박사
2013: 고려대학교 정보경영공학과 공학박사
현재 : 청주대학교 통계학과 교수 관심분야 : 기술경영, 데이터과학 Email : [email protected]