Spatio-Temporal Variations of Harmful Algal Blooms in the South Sea of Korea
Dae Hyun Kim*, Widhiyanuriyawan Denny**, Seung-Hwan Min**, Dong-In Lee***, and Hong-Joo Yoon**†
*Korea Inter-University Institute of Ocean Science, Pukyong National University
**Department of Satellite Information Sciences, Pukyong National University
***Department of Environmental Atmospheric Sciences, Pukyong National University
Abstract :Harmful algal blooms (HAB) caused by the dominant species Cochlodinium polykrikoides (C.
polykrikoides) appear in the South Sea of Korea and are particularly present in summer and fall seasons.
Environmental factors such as water temperature, weather conditions (air temperature, cloud cover, sunshine, precipitation and wind) influence on the initiation and subsequent development of HAB. The purpose of this research was to study spatial and temporal variations of HAB in the Yeosu area using environmental (oceanic and meteorological) and satellite data. Chlorophyll-a concentrations were calculated using Sea-viewing Wide Field-of-view Sensor (SeaWiFS) images by an Ocean Chlorophyll 4 (OC4) algorithm, and HAB were estimated using the Red tide index Chlorophyll Algorithm (RCA). We also used the surface velocity of sequential satellite images applying the Maximum Cross Correlation method to detect chlorophyll-a movement. The results showed that the water temperature during HAB occurrences in August 2002-2008 was 19.4-30.2˚C. In terms of the frequency of the mean of cell density of C. polykrikoides, the cell density of the HAB found at low (<300 cells/ml), medium (300-1000 cells/ml), and high (>1000 cells/ml) levels were 27.01%, 37.44%, and 35.55%, respectively. Meteorological data for 2002-2008 showed that the mean air temperature, precipitation, wind speed and direction, and sunshine duration were 22.39˚C, 6.54 mm/day, 3.98 m/s (southwesterly), and 1-11.7 h, respectively. Our results suggest that HAB events in the Yeosu area can be triggered and extended by heavy precipitation and massive movement of HAB from the East China Sea. Satellite images data from July to October 2002-2006 showed that the OC4 algorithm generally estimated high chlorophyll-a concentration (2-20 mg/m3) throughout the coastal area, whereas the RCA estimated concentrations at 2-10 mg/m3. The surface velocity of chlorophyll-a movement from sequential satellite images revealed the same patterns in the direction of the Tsushima Warm Current.
Key Words :
HAB, SeaWiFS, Ocean Chlorophyll 4(OC4), Red tide index Chlorophyll Algorithm (RCA), Maximum Cross Correlation (MCC) Method.Received September 30, 2009; Revised December 8, 2009; Accepted December 14, 2009.
†Corresponding Author: Hong Joo Yoon ([email protected])
1. Introduction
Harmful algal blooms (HAB), which occur in the South Sea of Korea mostly because of the dominant causative species C. polykrikoides, are particularly present in summer and fall seasons (Ahn et al., 2006;
Shanmugam et al., 2008). Considerable economic losses due to HAB were estimated at $95 million and
$19 million USD in 1995 and 2003, respectively (NOWPAP, 2005). In the South Sea of Korea, commercial fisheries are one of the most important industries that can be adversely affected by HAB events. The effects from these occurrences may include the buildup of toxins poisonous to humans and fish, resulting in death, oxygen depletion, or the formation of reactive oxygen species (Kim et al., 1999). Monitoring toxin levels and closing selected fisheries are some approaches to reducing the public health risks associated with these human and natural hazards.
Environmental factors such as water temperature, weather conditions (air temperature, cloud cover, sunshine, precipitation and wind) can greatly influence on the initiation and subsequent development of HAB. Water temperatures and cell density of HAB as oceanic data are monitored by the National Fisheries Research and Development Institute (NFRDI). Weather conditions from meteorological data are recorded daily by the Korea Meteorology Administration (KMA). Satellite imagery, which performs very well on a spatial and temporal scale, can cover a wide area of HAB, trace other factors that cause blooming, and help predict the movement of HAB. However, satellite data cannot be used to estimate HAB when there is cloud cover, as there usually is in summer. Nonetheless, the combination of satellite and meteorological data can be used to estimate HAB more accurately. The
purpose of this study was to combine and analyze ocenic, meteorological, and satellite data to better understand the spatial and temporal occurrence of HAB.
2. Study Area, Data and Methods
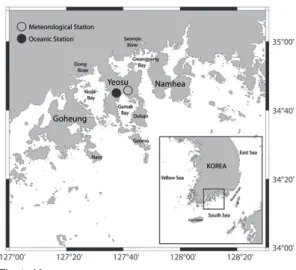
The study area was the Yeosu area, which is located in the center of the South Sea of Korea (Fig.
1). This region is affected by the Seomjin River estuary, which introduces an excess of nutrients following precipitation (Yoon and Kim, 2003; Lee, 2006), and the Tsushima Current, which consists of warm saltwater.
Oceanic data (the cell density of C. polykrikoides and water temperature) from NFRDI for July to September 2002-2008, meteorological data (air temperature, precipitation, wind speed and direction, and sunshine) from the KMA for July to October 2002-2008, and satellite data from SeaWiFS L1A images from the Korean Ocean Research and Development Institute (KORDI) for 2002-2006 were obtained. SeaWiFS data were processed using SeaWiFS Data Analysis System (SeaDAS) version
Fig. 1. Yeosu area.
5.2 software from the National Aeronautics and Space Administration to generate L2 SeaWiFS, which revealed OC4 algorithm and water-leaving radiance (Lw 443) of output binary data in Hierarchical Data Format (HDF) files. Furthermore, a computer program Matlab 2007b was used to process these data and calculate the RCA, which estimated the quantity of HAB in terms of chlorophyll-a concentration (Ahn and Shanmugam, 2006).
With this program, we used gap-filling (single pixel dropout or clouds replaced by an average of the surrounding pixels) and smoothing methods to increase the quality of the OC4 and RCA images.
The Maximum Cross Correlation (MCC) method was used to describe the movement of the HAB
based on sequential SeaWiFS images (OC4). The MCC method is an automated procedure that compares images to calculate the displacement of small regions of patterns. The velocity vector was then calculated by dividing the displacement by the time separation between the two images (Bowen et al., 2002; Crocker et al., 2007).
3. Results and Discussion
1) Oceanic Data
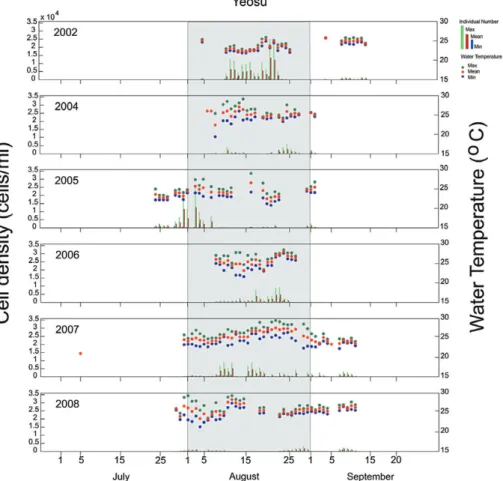
The distribution of C. polykrikoides and water temperature in the Yeosu area were recorded from July to September from 2002-2008 show in Fig. 2.
Fig. 2. Water temperature and cell density of C. polykrikoides, 2002-2008.
The HAB appeared each year, except in 2003 (data were not recorded by NFRDI). The cell density of C.
polykrikoides reached its highest values in 2002 and 2005, followed by a decrease from 2005-2008 (Table 1). Water temperature ranged from 19.4-30.2˚C (warm) during the C. polykrikoides blooming in 2002-2008. The longest duration of bloom was in August, except for 2003 (Fig. 3a). Monthly distributions (July-September) showed that the total
number of days and occurrences were 16, 136, 30 and 4, 16, 7, respectively (Fig. 3b)
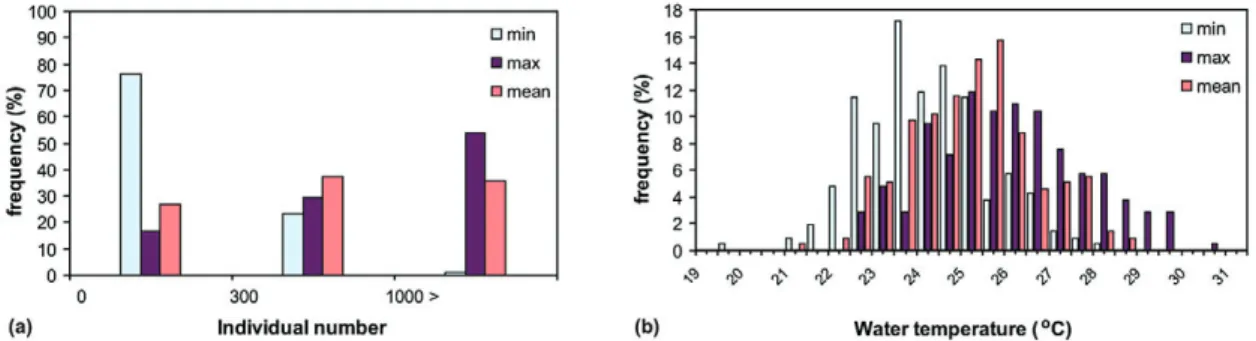
Figure 4a shows frequency of HAB based on the number of cell density of C. polykrikoides (Lee et al., 2002). Cell density was categorized into three levels:
low (<300 cells/mm), middle (300-1000 cells/mm), and high (>1000 cells/mm). Furthermore, the percentage of cell density of HAB from low to high show 27.01%, 37.44%, and 35.55%, respectively.
Water temperature during the HAB occurrence ranged from 19.4-30.2˚C, whereas the mean water temperature was 20.6-28.5˚C (Fig. 4b). According to Kim et al. (2004), water temperature has the greatest influence on the growth rate of C. polykrikoides, which is able to grow at 15-30˚C (optimum temperature = 21-26˚C and salinity = 20-36 psu).
2) Meteorological Data
The meteorological data on air temperature,
Table 1. Range of cell density of C. polykrikoides and watertemperature based on Fig. 2
Years Cell density (cells/ml)Water temperature (˚C)
min max min max
2002 20 25000 21.3 25.9
2003 No Data
2004 10 5800 19.4 29.1
2005 1 25000 20.8 29
2006 10 9200 21.6 28.5
2007 2 8970 22.3 30.2
2008 10 3200 21.3 29.3
Years Cell density (cells/ml) Water temperature (˚C)
min max min max
Fig. 4. (a) Frequency (%) of the cell density of C. polykrikoides and (b) water temperature of HAB occurrences in 2002-2008.
Fig. 3. Variations in C. polykrikoides blooms, 2002-2008: (a) duration and occurrence of HAB and (b) monthly distributions of total HAB.
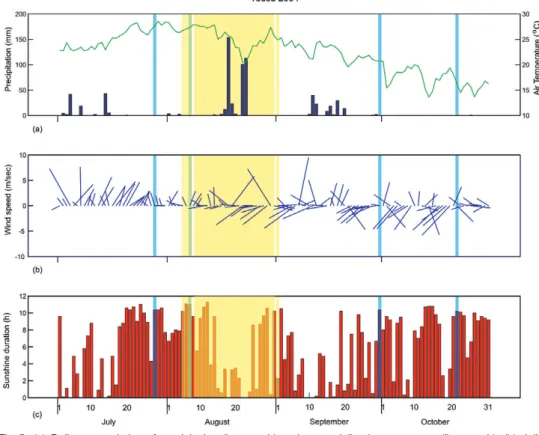
precipitation, wind, and sunshine were obtained from the KMA for July to October 2002-2008. Figure 5 shows data for July to October 2004.
The air temperature ranged from 19.6-28.5˚C in the summer (July-September 2004) and began to decrease in the fall (first week in October). Rainy conditions were prevalent in July to September, with high precipitation in August 2004 (101-153.5 mm;
Fig. 5a). Figure 5 also depicts HAB occurrence, which is represented in yellow. HAB occurred twice in August and once in September 2004. The mean air temperature, wind speed and direction, and sunshine duration the HAB occurrence on 5-7 August 2004 (3 days) were 27.3˚C, 2.95 m/s (northwesterly), and 10.2-11.1 h, respectively. In addition, the oceanic data from NFRDI showed that the water temperature and
cell density were 19.4-25.4˚C and 20-500 cells/ml, respectively. The mean air temperature, wind speed and direction, and sunshine duration the blooming from 9-31 August 2004 (23 days) were 20.47-27.8˚C, 4.8 m/s (southwesterly), and 0.4-11.3 h, respectively.
The oceanic data from NFRDI showed that the water temperature and cell density on these particular days were 22.7-29.1˚C and 10-5800 cells/ml, respectively.
The blooming observed on 1 September 2004 continued the second blooming seen in August. This second blooming had heavy precipitation on 18, 22, and 23 August with daily accumulations of 153.5, 101, and 113 mm, respectively (Fig. 5a), which probably induced an extension in the bloom period.
These conditions possibly occurred because heavy precipitation brought some nutrients from terrestrial
Fig. 5. (a) Daily accumulation of precipitation (bar graph) and mean daily air temperature (line graph), (b) daily mean wind speed and direction, and (c) accumulated sunshine recorded in 2004. The region in yellow denotes the occurrence of HAB based on oceanic data. The region in light blue represents satellite image data based on Korean Ocean Research and Development Institute data.
runoff into the estuary while the warm water (coastal) temperatures promoted breeding and blooming of C.
polykrikoides. In the Yeosu coastal area, anthropogenic activities in nearby cities such as Suncheon and Gwangyang can input nutrients into the Seomjin River estuary after a heavy rain event (Lee, 2006). These also that causes the cell density of HAB showed middle and close to high density (Fig.
4a). Moreover, HAB occurred 2-4 days after heavy precipitation, which indicates that precipitation can trigger blooming (Yoon and Kim, 2003). This phenomenon was also observed in 2002, 2005, 2007, and 2008 (data not shown). Figure 5b shows the daily wind speed and direction. Figure 5c shows sunshine duration with low (due to rain or cloud cover) and
high (sunny) values. The mean air temperature and daily accumulation of precipitation from July to October 2002-2008 are shown in Fig. 6. Figure 6a shows the annual air temperature range of 21.6- 23.3˚C (mean = 22.39˚C). Furthermore, the total daily accumulation of precipitation reached a maximum in 2003 and a minimum in 2008 (mean = 804.5 mm;
6.54 mm/day).
The histogram in Fig. 7a shows a dominant southwesterly wind from July to October 2002-2008.
A positive skewness denotes a mode of 2.29 m/s less than the mean wind speed (3.98 m/s; Fig. 7b), which indicates a calm wind dominant in these area.
According to Yoon and Kim (2003), a calm wind (2- 4 m/s) is favorable for HAB. The southwesterly wind
Fig. 6. (a) Variation in mean air temperatures and (b) daily accumulation of precipitation from July to October, 2002-2008.
Fig. 7. Histogram of (a) wind direction and (b) wind speed from July to October 2002-2008.
blows along the coast of the South Sea of Korea following C. polykrikoides bloom formation and propagation to the east that is driven along by a northeastward shore current (Lee, 2008).
3) Satellite Data
Satellite data for the OC4 and RCA images are shown in Figs. 8 and 9. Spatial and temporal variations of HAB occurrence detected through remote sensing are shown in Fig. 8 for July to October 2004 and in Fig. 9 for August 2002-2008.
The OC4 algorithm estimated high chlorophyll-a concentrations (2-20 mg/m
3) in all coastal areas from July to October 2004, whereas the RCA estimated lower concentrations (2-10 mg/m
3). The high concentrations in coastal areas as estimated by the OC4 algorithm had a large error in chlorophyll-a retrieval due to the lack of chlorophyll-a in water, but with suspended sediment and other dissolved organic material (case-2 waters). We know that case-2 waters occur in coastal regions with large runoff and high densities of human activities such as fisheries, recreation and shipping. Therefore, in case-2 waters, other substances that not only coverage the chlorophyll-a but also suspended sediment, organic particles and colored dissolved materials.
Furthermore, the OC4 algorithm has provided false information on HAB occurrences, whereas the RCA has been in accordance with HAB estimations (Ahn and Shanmugam, 2006). The difference in estimating HAB with OC4 and the RCA is in the use of the band- ratio algorithm, which is based on an empirical function of the ratio of blue to green remote sensing reflectance, in the OC4 algorithm (Shanmugam et al., 2008).
The RCA estimated several HAB occurrences in various bays from July to October 2004 (Fig. 8).
Figure 9 shows a dominant HAB occurrence in the Dolsan and Geomo area in August 2002-2008.
Satellite images did not provide information for the
Yeoja and Gwangyang bays because of cloud cover in these areas. HAB occurrences in the Dolsan and Geomo area in 2003 as estimated by the RCA coincided with the in- situ data from Lee (2006). The HAB event that occurred in the offshore area was probably caused by the input of nutrients and C.
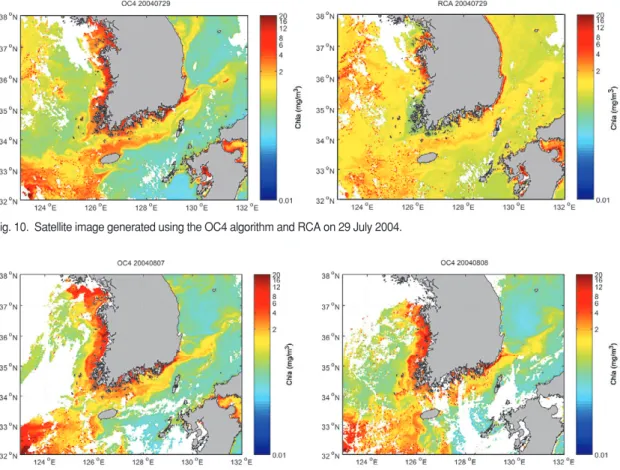
polykrikoides from the South China Sea by the Jeju and Tsushima Warm Currents. Figure 10 shows massive transport of HAB and chlorophyll-a from the East China Sea. Some studies have suggested that water from the Yangtze River may contribute to the outbreak of C. polykrikoides (Yang et al., 2000; Lee and Lee, 2006). The beginning of the first bloom on 5-7 August 2004 (Fig. 2) in the Yeosu area may have been triggered by the intrusion of C. polykrikoides from off the shore of the East China Sea brought by the Jeju and Tsushima Warm Currents. These phenomena were shown by both OC4 and RCA images on 29 July 2004 (Fig. 10). In addition, the wind had a south-southwesterly direction (meteorological data in Fig. 5b) that also contributed to the transport of C. polykrikoides cells in the water surface from off the shore of the Yeosu area.
Therefore, HAB can occur when environmental conditions such as water temperature, wind speed, and sunshine are favorable.
Figures 11 and 12 show sequence images and surface velocities of chlorophyll-a movement using the MCC method in sequential satellite OC4 images.
We obtained good-quality results of surface velocity
in the East Sea area, although the image from 8
August 2004 was affected by cloud cover over the
South Sea of Korea (Fig. 11). The MCC method is
limited by cloud cover and does not accurately
determine velocity vectors close to the shore where
local topography, tide, upwelling, and other small-
scale processes can have large influences on surface
flow. In addition, MCC methods have a slight error in
regard to geolocation, such that coastal shorelines
may be offset in sequential images (shifting). The MCC method is best used to detect coastal displacement and calculate terrestrial surface velocities (Crocker et al., 2007).
Nonetheless, we obtained significant results for chlorophyll-a movement in the East Sea. Eddy currents in this region showed a cyclonic (cold-core eddy) with a surface velocity in an anti-clockwise
Fig. 8. Spatio-temporal SeaWiFS satellite images generated using the OC4algorithm (left) and the RCA (right) for July to October 2004.
Fig. 9. Spatio-temporal SeaWiFS satellite images generated using the OC4 algorithm (left) and RCA (right) for August 2002-2006.
direction. These eddies form as an effect from the front located between the East Korea Warm Current
and the North Korea Cold Current (Mitchell et al., 2005). We also discovered a plume in the Gijang area (sub-region A). A high chlorophyll-a concentration in this region also revealed upwelling due to a southwesterly wind that strongly influenced the Tsushima Warm Current (Lee et al., 2003).
According Ahn et al., (2005) The process of such mesoscale anticylonic eddy features during summer season might have produced interior upwelling that could have shoaled and steeped the nutricline, enhancing phytoplankton population by advection or diffusion of nutrients in this area. Chlorophyll-a movement in the Yeosu area also followed the Tsushima Warm Current and southwesterly wind (Fig. 12).
Fig. 10. Satellite image generated using the OC4 algorithm and RCA on 29 July 2004.
Fig. 11. Satellite image generated using the OC4 algorithm on 7 August 2004 at 03:47:04 GMT and on 8 August 2004 at 04:27:17 GMT.
Fig. 12. OC4 image computed from SeaWiFS ocean color data on 7 August 2004 at 03:47:04 GMT (MCC vectors were derived from this image) and on 8 August 2004 at 04:27:17 GMT.