표준강수증발산지수를 활용한 미래 가뭄특성의 시계열 변화전망
Projection of Temporal Trends on Drought Characteristics using the Standardized Precipitation Evapotranspiration Index (SPEI) in South Korea
남원호
*,†・ Michael J. Hayes
**・ Donald A. Wilhite
***・ Mark D. Svoboda
****Nam, Won-Ho ・ Michael J. Hayes ・ Donald A. Wilhite ・ Mark D. Svoboda
Abstract
Recent droughts in South Korea have had large economic and environmental impacts across the country. Changes in rainfall and hydrologic patterns due to climate change can potentially increase the occurrence of extreme droughts and affect the future availability of water resources. Therefore, it is necessary to evaluate drought vulnerability for water resources planning and management, and identify the appropriate mitigation actions to conduct a drought risk analysis in the context of climate change. The objective of this study is changes in the temporal trends of drought characteristics in South Korea to examine drought impacts under climate change. First, the changes of drought occurrence were analyzed by applying the Standardized Precipitation Evapotranspiration Index (SPEI) for meteorological data on 54 meteorological stations, and were analyzed for the past 30 years (1981-2010), and Representative Concentration Pathways (RCP) climate change scenarios (2011-2100). Second, the changes on the temporal trends of drought characteristics were performed using run theory, which was used to compare drought duration, severity, and magnitude to allow for quantitative evaluations under past and future climate conditions. These results show the high influence of climate change on drought phenomenon, and will contribute to water resources management and drought countermeasures to climate change.
Keywords:climate change; drought intensity; drought severity; RCP scenarios; run theory; standardized precipitation evapotranspiration index (SPEI)
*
Post-doctoral Research Associate, National Drought Mitigation Center (NDMC), School of Natural Resources, University of Nebraska-Lincoln, Lincoln, NE, USA
**
Professor/Director, National Drought Mitigation Center (NDMC) and School of Natural Resources, University of Nebraska-Lincoln, Lincoln, NE, USA
***
Professor, School of Natural Resources, University of Nebraska- Lincoln, Lincoln, NE, USA
****
Climatologist/NDMC Program Area Leader, National Drought Mitigation Center (NDMC), University of Nebraska-Lincoln, Lincoln, NE, USA
† Corresponding author
Tel.: +1-402-416-8859 Fax: +1-402-472-2946 E-mail: [email protected]
Received: October 8, 2014 Revised: November 27, 2014 Accepted: November 27, 2014
Ⅰ. 서 론
기후변화로 인한 전 세계적인 온난화 현상으로 인하여 우 리나라는 최근 전국적으로 심한 가뭄이 발생하여 사회적, 경 제적, 환경적 피해가 대형화되어 가는 추세이며 (Nam et al., 2014b; Sohn et al., 2014), 이상기후현상의 증가 및 기후변화 에 의해 가뭄에 대한 취약성은 증가될 가능성이 있다 (IPCC, 2013). 미래 한반도 기후변화 전망에 따르면 현재 추세로 저감
없이 온실가스가 배출되는 경우, 21세기 후반에 기온은 6.0 ℃ 상승하고, 강수량은 20.4 % 증가할 것으로 예측하였으며 (Rim and Kim, 2014), 강수량 증가가 예상되는 동시에 강수 강도의 증가 및 연 강수일수의 감소로 인해 강도 높은 우기 사 이의 건기가 길어지고, 기온 상승으로 인한 대기 중 수분 요구 량 증가에 따라 증발산량 또한 증가할 것으로 전망하였다 (KMA, 2010; Kim et al., 2013a). 따라서 효과적인 가뭄의 예 측 및 대책을 위해서는 가뭄의 진행상황이나 강도를 정의할 수 있는 객관적인 기준을 이용하여 과거 가뭄의 양상을 파악 하고 (Wilhite et al., 2000; Svoboda et al., 2002; Hayes et al., 2004; Nam et al., 2012b), 미래 기후변화 시나리오를 반영함 으로서 장기적인 가뭄전망을 통해 기후변화에 대응하여 가뭄 관리 방안을 수립하는 것이 필요하다 (Park et al., 2013; Wilhite et al., 2014).
가뭄의 정도를 정량화하기 위하여 개발된 다양한 가뭄지 수는 대상과 평가방법에 따라 가뭄을 표현하는 특성이 다르 며, 각각의 다른 입력변수를 이용하여 가뭄의 심도와 기간을 분석하고 있다. 가뭄의 평가를 위해 일반적으로 사용하는 가 뭄지수는 기상학적 가뭄지수인 표준강수지수 (Standardized Precipitation Index, SPI; McKee et al., 1993)와 강수량 및 유 효토양수분량에 근거하여 가뭄을 판단하는 파머가뭄심도지 수 (Palmer Drought Severity Index, PDSI; Palmer, 1965)를
대표적으로 사용하고 있다. 1960년대 미국에서 개발된 PDSI 는 기상학적 인자인 강수량과 기온을 이용하여 가뭄을 정량 적으로 평가할 수 있는 가뭄지수로서 전 세계 많은 지역에서 가뭄을 모니터링하기 위한 도구로 활용되고 있다 (Hayes et al., 2011). PDSI는 온도 변수를 포함하여 증발산량의 영향을 고려하지만 토양의 수분보유함량 (available water capacity) 등 여러 변수 값을 필요로 하고, 경험적인 상수가 지역 특성을 반영하지 못하며 (Alley, 1984), 시간의 척도가 고정되어 있 기 때문에 다양한 시간 척도의 가뭄 영향 분석이 불가능하다 (Guttman, 1998; Kang and Moon, 2014). 이러한 단점을 극 복하고자 강수량만을 입력 자료로 사용하고 정규화 과정을 통해 적용 지역에 대한 표준화된 값을 제공함으로써 시공간 적인 비교가 가능한 SPI가 개발되었다 (McKee et al., 1993).
하지만 SPI는 강수 이외의 기온과 관련된 변수를 고려하지 않 기 때문에 증발산량의 영향을 해석하지 못하는 단점이 있다 (Kim et al., 2013a).
국외의 경우 미국 국립가뭄경감센터 (National Drought Mitigation Center, NDMC)에서는 SPI, SPEI, PDSI 등의 다 양한 가뭄지수를 활용함으로써 가뭄심도의 정량적 평가를 위 한 모니터링 시스템을 구축하여 가뭄의 진행에 따른 단계별 대응체계를 수립하고 가뭄대응정책 수립을 위한 주요 의사결 정 정보로 활용하고 있다 (Hayes et al., 1999; 2004; Wilhite et al., 2007; Nam et al., 2014a). 국내의 경우 주로 기상학적 가뭄지수를 활용하여 군집분석을 이용한 가뭄의 공간적 분석 (Yoo et al., 2010; 2013), 시계열 가뭄특성 분석 (Nam et al., 2008; Kwak et al., 2013; So et al., 2014), 가뭄우심도를 이용 한 시공간적 가뭄특성 분석 (Lee et al., 2012b), 가뭄지수의 표준화 연구 및 가뭄판단기준 연구 (Bae et al., 2013a; 2013b;
Kim and Moon, 2014) 등의 연구가 진행되었다. 또한 수문학 적 가뭄지수인 SWSI 가뭄지수 (Surface Water Supply Index;
Shafer and Dezman, 1982)를 보완한 MSWSI (Modified SWSI; Kwon et al., 2006), 수자원 가용능력을 고려한 WADI (Water Availability Drought Index; Park et al., 2011) 가뭄지 수가 개발되었다. 미래 가뭄 전망에 관한 연구는 초기에는 기 후변화 시나리오의 강수 및 기온을 이용한 극한지수 변화전 망 (Jeung et al., 2013; Rim and Kim, 2014) 및 미래 장기유출 분석을 통한 유역의 가뭄평가 연구 (Yoon et al., 2014) 등이 진행되었으며, 이후 기후변화에 따른 미래 가뭄사상의 주기 성 및 경향성, 발생빈도 등의 통계학적 특성을 분석하는 연구 (Choi et al., 2010; Lee et al., 2012a)가 진행되었다.
농업가뭄의 경우 강수량과 증발산량을 동시에 고려한 가 뭄지수를 활용한 전망이 필요하며 (Nam and Choi, 2014), 최 근에는 SPI와 PDSI의 단점을 보완하여 강수 및 기온의 변동
성이 포함된 가뭄지수인 표준강수증발산지수 (Standardized Precipitation Evapotranspiration Index, SPEI)가 개발되었 다 (Vicente-Serrano et al., 2010; Begueria et al., 2014). SPEI 는 가뭄지수산정을 위한 강수 및 증발산량의 계산 시간 척도 를 1개월부터 3, 6, 9, 12, 24개월 등과 같이 다양하게 설정함 으로써 시간 척도별로 단기가뭄 및 장기가뭄을 동시에 평가 할 수 있는 장점이 있다 (Hayes et al., 2011; Kim et al., 2012a).
또한, 기후온난화에 의한 가뭄심도 영향 분석에 적합한 가뭄 지수로서 (Begueria et al., 2014), 현재 전 지구를 대상으로 가 뭄모니터링 시스템을 제공하고 있다 (http://sac.csic.es/spei).
국내의 경우 Kim et al. (2012a; 2013a)에 의해서 과거 및 미래 기후변화에 대한 가뭄심도의 변화에 대해서 적용된바 있지 만, 미래 기후변화에 따른 가뭄특성에 대한 변화 연구는 부족 한 실정이다. 따라서 본 연구에서는 과거 기상관측자료 및 대 표농도경로 (Representative Concentration Pathways, RCP) 기후변화 시나리오로부터 모의된 기상자료를 활용하여 전국 의 54개 기상관측소에 대한 6개월 시간 척도의 SPEI를 적용 하였으며, 과거 및 미래 가뭄사상의 지속기간 (duration), 가 뭄심도 (severity), 가뭄규모 (magnitude)를 비교하여 미래의 기후변화에 의한 가뭄발생 및 가뭄특성변화를 전망하였다.
Ⅱ. 재료 및 방법
1. 표준강수증발산지수 (Standardized Precipitation Evapotranspiration Index, SPEI)
SPEI (Vicente-Serrano et al., 2010)는 강수량과 증발산 량의 차가 유출 및 수분 저장 (지하수 및 토양수분)의 합과 같 아지는 물수지를 개념적으로 고려하고 있으며, 증발산량 (potential evapotranspiration)은 식 (1)과 같이 Thornthwaite 방법 (Thornthwaite, 1948)을 사용하였다.
(1)는 증발산량 (mm), 는 월평균기온 (℃), 는 열지수 (heat index), 는 위도 (latitude)와 월 (month)의 함수로 산 정하는 계수,
은 월단위이다.각각 다른 시간척도 (time scales)에 따라 식 (2)와 같이 강 수량과 증발산량의 차인 의 누적 값의 시계열 자료로부터 적정확률분포로 선정된 Log-logistic 분포를 이용하여 매개 변수를 추정한 후, 표준정규분포로 전환하여 가뭄지수를 산 정한다 (Vicente-Serrano et al., 2010).
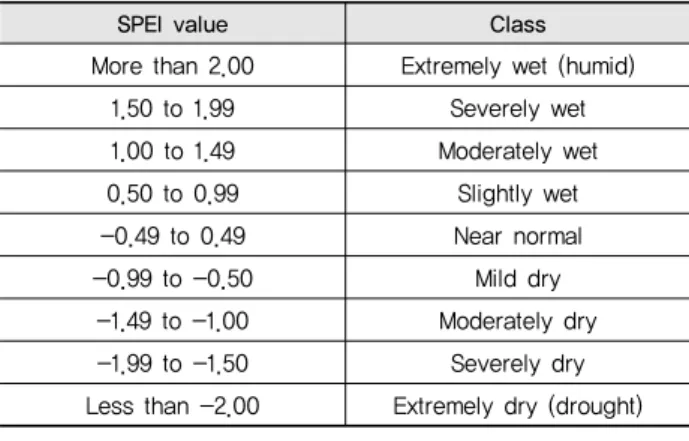
Table 1 Classification of Standardized Precipitation Evapotrans- piration Index (SPEI)
SPEI value Class
More than 2.00 Extremely wet (humid)
1.50 to 1.99 Severely wet
1.00 to 1.49 Moderately wet
0.50 to 0.99 Slightly wet
-0.49 to 0.49 Near normal
-0.99 to -0.50 Mild dry
-1.49 to -1.00 Moderately dry
-1.99 to -1.50 Severely dry
Less than -2.00 Extremely dry (drought)
Table 2 Definition of drought characteristics using run theory
Categories Definition
Duration Time period between the initiation and termination of a drought
Severity Deficit volume under the threshold level (mild drought) Magnitude or
Intensity
Ratio of the drought deficit volume and the drought duration
(2)SPEI는 가뭄 심도를 정의하기 위하여 Table 1에 도시한바 와 같이 SPI와 동일한 가뭄분류체계를 사용하였다. 가뭄분류 의 기준으로 9단계의 가뭄수준으로 등급을 구분하였으며 값 이 높을수록 습윤 상태, 값이 낮을수록 가뭄 상태가 심한 것을 의미한다. 일반적으로 농업가뭄 모니터링을 위해서는 3∼6 개월의 시간 척도를 사용하는 것을 권고하고 있기 때문에 (Svoboda et al., 2002), 본 연구에서는 6개월의 시간 척도를 사용하였으며, 각 기상관측소 위치별로 일 자료를 월 자료로 전환하여 SPEI 가뭄지수를 산정하였다.
2. 가뭄특성인자의 정의
일반적으로 가뭄에 대한 연구를 수행할 경우, 우선 다양한 가뭄지표를 활용하여 가뭄현상을 정량화하고, 가뭄기준으로 부터 가뭄의 지속기간, 심도, 발생간격 등을 정의한 후 시계열 분석하여 가뭄특성을 평가한다 (Byun and Wilhite, 1999).
Yevjevich (1967)은 절단수준 (truncation level)을 선정하고 가뭄사상 (event)을 정의할 수 있는 임계수준 방법 (threshold level method) 또는 연속이론 (runs theory)을 개발하였으며, 가뭄의 시작과 끝을 명확하게 구분할 수 있기 때문에 가뭄의 지속기간, 심도, 간격 등 가뭄의 특성을 산정하는데 유용하다 (Sung and Chung, 2014; Yoo and et al., 2014).
연속이론은 개념적인 적용의 간편함으로 인하여 수문기상 학적 시계열에 적용할 수 있다 (Nam et al., 2012a; Kwak et al., 2013). 본 연구에서는 SPEI 가뭄지수를 연속적인 수문기상학 적 시계열로 간주하여 연속이론을 적용하고 가뭄사상 및 가뭄 의 지속기간 (duration)과 심도 (severity), 규모 (magnitude or intensity)를 Table 2와 같이 정의하였다. 가뭄사상은 가뭄지 수가 특정 평균수준 (혹은 절단수준) 이하의 값이 지속적으로
발현될 때 나타난다. 가뭄의 시작은 SPEI 값이 절단수준 (SPEI = -1) 이하로 감소하는 시점, 가뭄의 종료는 강우에 의해 충분한 수분이 공급되어 절단수준 이상이 되는 시점으로 정의 하였으며, 가뭄사상의 지속기간은 절단수준인 이하로 떨어지 는 연속기간 (run-length), 가뭄의 지속기간 동안 절단수준 이 하로 내려간 누적 값 (rum-sum)을 가뭄의 심도로 정의하였다.
가뭄의 규모는 가뭄의 심도를 기간으로 나눈 값을 사용하였다. 즉, 하나의 가뭄사상은 시작과 끝으로 확정되는 지속기간을 가지며, 지속기간에 대한 가뭄 심도 및 규모 값을 갖게 된다.
3. 연구대상지역 및 미래 기후변화 시나리오
기후변화에 따른 남한지역 가뭄사상의 특성 및 시계열 분석 을 위하여 IPCC (Intergovernmental Panel on Climate Change) 5차 평가보고서 (Fifth Assessment Report, AR5)에서 제시한 대표농도경로 (Representative Concentration Pathways, RCP) 전망을 통하여 대기 중 온실가스 농도를 추정한 RCP 4.5, RCP 8.5 기후변화 시나리오를 적용하였다. 기상청 (Korea Meteorological Administration, KMA)에서 제공하고 있는 남한 상세 기후변화 시나리오는 지역기후모델 (HadGEM3-RA) 을 통해 생산된 한반도 기후변화 시나리오를 바탕으로 통계 학적 상세화 과정 (Kim et al., 2012b)을 통해 생산되며, PRIDE 모델 (PRISM based Downscaling Estimation Model) 에 적용하여 1 km 해상도의 관측격자 자료를 생산한다 (Kim et al., 2013b). 연구대상지역은 도서지역을 제외한 전국 54개 기상관측소의 과거 기상관측자료 및 미래 RCP 기후변화 시 나리오 자료의 평균기온, 강수량 자료를 사용하였으며, 분석 기간을 과거 기준기간 (observed, 1981-2010년) 및 미래의 경 우 전기 (2025s, 2011-2030년), 중기 (2055s, 2031-2070년), 후기 (2085s, 2071-2100년)로 분류하였다.
Ⅲ. 적용 및 고찰
1. SPEI를 이용한 과거가뭄사상의 적용
SPEI의 적용성을 검증하기 위하여 1981년부터 2010년까
지 30년간의 월 기상자료를 사용하여 전국 주요 6개 기상관측 소 (MS. A: 대관령, MS. B: 수원, MS. C: 전주, MS. D: 보은, MS. E: 장흥, MS. F: 밀양)의 시간 척도 6개월의 SPEI 값을 산 정하였다. 과거 우리나라의 주요 가뭄사상은 1988년, 1994- 1995년 (남부지방 중심), 2000-2001년 (중부지방 중심), 2008-2009년 (남부지방 중심)에 발생하였으며 (Kim et al., 2012a; Lee et al., 2012a; Nam et al., 2012a; Kim et al., 2013a), SPEI 가뭄지수 값과 비교함으로써 대표적인 과거 가 뭄사상과의 일치성을 검토하였다.
Fig. 1에 도시한 바와 같이 선정된 북부 (A, B), 중부 (C, D), 남부 (E, F)지역의 기상관측소의 과거 시계열 값의 변화를 살 펴보면, SPEI의 가뭄심도 -1.5 이하의 심한가뭄 (severely drought)이 과거 주요 가뭄사상 기간에 발생하였으며, 특히 2000-2001년에는 가뭄심도 –2.0 이하의 극심한 가뭄 (ex- tremely drought)이 전 지역에서 나타났다. Kim et al. (2012a) 연구에서도 유사한 결과를 도출하였으며, 따라서 SPEI 가뭄 지수는 남한지역의 가뭄사상 분석에 적합한 것으로 판단된 다. 또한 본 연구에서 도출된 미래기간의 가뭄전망 변화 결과 를 신뢰할 수 있을 것으로 사료된다.
2. RCP 기후변화 시나리오를 이용한 SPEI 가뭄지수의 변화전망
Fig. 2는 미래 RCP 4.5와 RCP 8.5 기후변화 시나리오에 대 한 전국 54개 기상관측소의 평균 최대기온 및 최소기온, 강수 량의 월별 시계열 값을 도시한 것이다. 평균 최대기온의 경우 미래기간 전기, 중기, 후기의 예측 값은 RCP 4.5에서 각각 19.03 ℃ (기준기간 18.10 ℃ 대비 5.1 % 증가), 19.99 ℃ (10.5
% 증가), 20.55 ℃ (13.6 % 증가), RCP 8.5에서는 18.91 ℃ (4.5 % 증가), 20.61 ℃ (13.9 % 증가), 22.58 ℃ (24.8 % 증가) 으로 분석되었다. 평균 최소기온의 경우 RCP 4.5에서 각각 8.43 ℃ (기준기간 7.57 ℃ 대비 11.3 % 증가), 9.62 ℃ (27.1
% 증가), 10.08 ℃ (33.2 % 증가), RCP 8.5에서는 8.43 ℃ (11.3 % 증가), 10.06 ℃ (32.9 % 증가), 11.84 ℃ (56.4 % 증 가)으로 분석되었다. 기온은 RCP 4.5 보다 RCP 8.5에서 증가 률이 더 크고 미래 후기로 갈수록 증가할 것으로 예측되었으 며, 특히 최소기온의 경우 증가율이 크게 나타났다. 강수량의 경우 미래 후기의 경우 RCP 4.5에서 1376 mm (기준기간 1330 mm 대비 3.4 % 증가), RCP 8.5에서 1487 mm (11.7 % 증가)으로 분석되었다.
Fig. 3과 4은 미래 RCP 기후변화 시나리오를 사용하여 시간 척도 6개월을 기준으로 산정한 전국 주요 6개 기상관측소의 SPEI의 월별 시계열 값을 도시한 것이다. RCP 4.5의 경우 미래 전기 말 (2031-2035년) 기간과 후기 말 (2092-2094년) 기간에
극심한 가뭄이 발생할 것으로 전망되었으며, RCP 8.5의 경우 중기 (2053년) 기간과 후기 기간 전반 걸쳐 극심한 가뭄 사상이 발생할 것으로 전망되었다. 특히, RCP 8.5의 미래 후기 기간에 는 심도가 큰 가뭄 발생의 빈도가 증가할 것으로 전망되었다.
3. RCP 기후변화 시나리오를 이용한 미래 가뭄특성인자의 변화전망
과거 및 미래 가뭄 사상의 정량적 비교를 위하여 가뭄 사상 의 개수, 가뭄기간, 가뭄지수의 최솟값, 가뭄심도, 가뭄크기 를 산정하였다. Fig. 5는 과거 30년간 (1981-2010년) 전국 54 개 기상관측소별로 산정한 SPEI의 가뭄지수로부터 가뭄 사 상의 개수 및 가뭄특성인자의 시계열 변화를 도시한 것이다. 과거 30년간의 전체 가뭄 사상은 892개로 나타났으며, 1994- 1995년, 2000-2001년, 2008-2009년에 높은 가뭄 심도와 가 뭄 크기가 산정되었다. 가뭄지수의 최솟값은 2000-2001년에 발생하였으며, 가뭄 심도의 최솟값은 1994-1995년에 발생하 였다. 892개 가뭄 사상 가운데 극심한 가뭄 (extremely drought) 이하의 가뭄 사상은 약 16% 해당하는 143개로 분류되었으며, 극심한 가뭄사상으로 분류된 가뭄사상의 평균 가뭄지속기간 은 10.19개월, 가뭄지수의 최솟값 및 가뭄심도, 가뭄크기의 평균값은 각각 -2.27, -13.46, -1.39으로 산정되었다.
Fig. 6과 Fig. 7은 미래 RCP 4.5, RCP 8.5 기후변화 시나리 오를 활용하여 미래 90년간 (2011-2100년) 전국 54개 기상관 측소별로 산정한 SPEI의 가뭄지수로부터 가뭄 사상의 개수 및 가뭄특성인자의 시계열 변화를 도시한 것이다. RCP 4.5의 경우 전체 가뭄 사상은 2479개로 나타났으며, 2034-2035년, 2065-2066년, 2091-2095년에 높은 가뭄 심도와 가뭄 크기가 산정되었다. 극심한 가뭄 이하의 가뭄 사상은 약 17 % 해당하 는 432개로 분류되었으며, 극심한 가뭄사상으로 분류된 가뭄 사상의 평균 가뭄지속기간은 10.51개월, 가뭄지수의 최솟값 및 가뭄심도, 가뭄크기의 평균값은 각각 -2.32, -14.67, -1.43 으로 산정되었다. RCP 8.5의 경우 전체 가뭄 사상은 2562개 로 나타났으며, 미래 중기, 후기 전반에 걸쳐 극심한 가뭄 발 생의 빈도가 RCP 4.5에 비교하여 상대적으로 높게 나타났다.
극심한 가뭄 이하의 가뭄 사상은 약 16% 해당하는 411개로 분류되었으며, 극심한 가뭄사상으로 분류된 가뭄사상의 평 균 가뭄지속기간은 11.75개월, 가뭄지수의 최솟값 및 가뭄심 도, 가뭄크기의 평균값은 각각 -2.28, -15.87, -1.39으로 산정 되었다. 과거 기간과 비교하여 미래의 RCP 4.5, RCP 8.5 기후 변화 시나리오의 경우 극심한 가뭄사상의 평균 가뭄지속기간 은 증가하였으며, RCP 4.5 보다 RCP 8.5에서 높은 증가율을 보였다. 가뭄심도의 경우 RCP 4.5에서 최솟값을 나타냈으며, 가뭄크기의 경우 RCP 8.5에서 최솟값을 나타냈다.
Fig. 1 Time series of 6-month SPEI using historical data (1981-2010) for six meteorological stations. Also shown are the observed SPEI values (black lines). The gray colored vertical bars indicated years of drought from historical records.
Fig. 2 Time series of meteorological data ((a) maximum temperature, (b) minimum temperature, (c) precipitation) under climate change
using RCP 4.5 and 8.5 scenarios (2011-2100) for 54 meteorological stations.
Fig. 3 Temporal trends of 6-month SPEI under climate change using RCP 4.5 scenarios (2011-2100) for six meteorological stations
Fig. 4 Temporal trends of 6-month SPEI under climate change using RCP 8.5 scenarios (2011-2100) for six meteorological stations
Fig. 5 Time series of drought characteristics ((a) duration, (b) peak, (c) severity, (d) magnitude) based on 6-month SPEI using historical data (1981-2010) for 54 meteorological stations. The gray colored points indicated 892 drought events.
Ⅳ. 결 론
본 연구에서는 남한지역의 미래 가뭄사상을 정량적으로 분석하기 위하여 전국의 54개 기상관측소를 대상으로 과거 기상자료 및 미래 기후변화 시나리오를 활용하여 6개월 시간 척도 SPEI 가뭄지수의 시계열을 산정하였다. 또한 연속이론 을 적용하여 가뭄사상을 정의하고 가뭄의 지속기간 및 가뭄 심도, 가뭄크기 등 가뭄특성인자의 변화를 전망하였다. 과거 30년간 (1981-2010년)의 극심한 가뭄사상으로 분류된 가뭄 사상의 평균 지속기간은 10.19개월, 가뭄지수의 최솟값 및 가 뭄심도, 가뭄크기의 평균값은 각각 -2.27, -13.46, -1.39으로 산정되었다. 미래 RCP 4.5, RCP 8.5 기후변화 시나리오를 활 용하여 미래 90년간 (2011-2100년)의 극심한 가뭄사상을 전 망하였다. RCP 4.5의 경우 평균 가뭄지속기간은 10.51개월, 가뭄지수의 최솟값 및 가뭄심도, 가뭄크기의 평균값은 각각 -2.32, -14.67, -1.43으로 산정되었으며, RCP 8.5의 경우 평균 가뭄지속기간은 11.75개월, 가뭄지수의 최솟값 및 가뭄심도, 가뭄크기의 평균값은 각각 -2.28, -15.87, -1.39으로 산정되었 다. 과거 기간과 비교하여 미래의 RCP 4.5, RCP 8.5 기후변화
Fig. 6 Time series of drought characteristics ((a) duration, (b) peak, (c) severity, (d) magnitude) based on 6-month SPEI under climate change using RCP 4.5 scenarios (2011-2100) for 54 meteorological stations. The gray colored points indicated 2479 drought events.
Fig. 7 Time series of drought characteristics ((a) duration, (b) peak, (c) severity, (d) magnitude) based on 6-month SPEI under climate change using RCP 8.5 scenarios (2011- 2100) for 54 meteorological stations. The gray colored points indicated 2562 drought events.
시나리오의 경우 극심한 가뭄사상의 평균 가뭄지속기간은 증 가하였으며, RCP 4.5 보다 RCP 8.5에서 높은 증가율을 보였 다. RCP 8.5의 경우 미래 중기, 후기 전반에 걸쳐 극심한 가뭄 발생의 빈도가 RCP 4.5에 비교하여 상대적으로 높게 나타났 다. 금회 산정된 SPEI 가뭄지수는 강수량과 기온의 비교적 간 편한 기상자료를 활용하여 가뭄특성인자를 분석함으로써 가 뭄해석에 있어 활용성이 높다고 판단되며, 본 연구의 결과는 향후 미래 기후변화에 따른 정량적인 가뭄사상의 시계열 변 화 및 가뭄의 대응을 위한 주요한 기초자료로 활용될 수 있을 것으로 사료된다.
사 사
이 논문은 2013년도 정부 (교육부)의 재원으로 한국연구 재단의 지원을 받아 수행된 기초연구사업임 (2013R1A6A3 A03019009).
REFERENCES