eISSN 2288-3959
여자 청소년 및 젊은 여성의 비타민 D 결핍과 빈혈과의 연관성 분석 *
장하은, 박성희, 박 경†
영남대학교 식품영양학과
Association between vitamin D deficiency and anemia among Korean adolescent girls and young women *
Haeun Jang, Seonghee Park and Kyong Park†
Department of Food and Nutrition, Yeungnam University, Gyeongsan, Gyeongbuk 38541, Korea
ABSTRACT
Purpose: Although vitamin D deficiency is common among Korean adolescent girls and young women, few studies have explored the potential health effects of vitamin D deficiency in this vulnerable population. This study examined the association between vitamin D deficiency and anemia in Korean adolescent girls and young women. Methods: The data from the Korea National Health and Nutrition Examination Survey 2008 ~ 2014 were used. A total of 3,643 girls and adult women aged 12 to 29 who provided all the information (including serum 25-hydroxy vitamin D, hemoglobin, and/or serum ferritin) needed for the analysis were included in the analysis. Demographic, lifestyle, and health data were obtained through survey questionnaires. Anemia and iron deficiency anemia were defined according to the World Health Organization cut-offs.
Multivariable logistic regression, and restricted cubic spline regression were used in the analysis. Results: In fully adjusted logistic regression models, the vitamin D deficiency was significantly associated with higher prevalences of anemia (odds ratio (OR): 1.61, 95% confidence interval (CI): 1.04 ~ 2.49) and iron deficiency anemia (OR: 1.43, 95% CI: 1.01 ~ 2.03). In a cubic spline regression model, we observed a dose-response relationship between serum 25(OH)D concentration and anemia, and this linear relationship was also clearly observed between serum 25(OH)D concentration and iron deficiency anemia.
Conclusion: Vitamin D deficiency may be associated with a higher prevalence of iron deficiency anemia and anemia in adolescent girls and young women. Alternatively, vitamin D deficiency may be a concurrent event for patients with anemia, which we cannot distinguish in this cross-sectional study. Further studies are needed to verify the causality in this population of low vitamin D levels.
KEY WORDS: vitamin D, anemia, iron-deficiency anemia, adolescents, women
Received: August 30, 2019 / Revised: November 26, 2019 / Accepted: December 10, 2019
* This research was supported by the Basic Science Research Program through the National Research Foundation of Korea (NRF) funded by the Ministry of Science, ICT & Future Planning (grant number: NRF-2017R1A1A3A04069759). The founding sponsor had no role in the design of the study; in the collection, analyses, or interpretation of data; in the writing of the manuscript, and in the decision to publish the results.
†To whom correspondence should be addressed.
tel: +82-053-810-2879, e-mail: [email protected]
© 2019 The Korean Nutrition Society
This is an Open Access article distributed under the terms of the Creative Commons Attribution Non-Commercial License (http://creative- commons. org/licenses/by-nc/3.0/) which permits unrestricted non-commercial use, distribution, and reproduction in any medium, provided the original work is properly cited.
서 론
우리나라는 최근 비타민 D 결핍으로 인한 환자수와 진 료비가 꾸준히 증가하는 추세를 보이고 있으며 [1], 그 중 10 ~ 20대 여성의 비타민 D 결핍률이 다른 연령대에 비해 현저하게 높은 것으로 보고되었다 [2]. 비타민 D 결핍은 근골격 건강 및 심혈관 질환을 포함한 수많은 만성질환 위 험을 높이며, 특히 젊은 여성들의 비타민 D 결핍은 노년기
의 골 관련 질환 발생 위험을 증가시키는 등 심각한 결과 로 이어질 수 있다 [3,4].
최근 비타민 D 결핍은 빈혈을 유발시킬 수 있다는 선행 연구가 보고되고 있다. 체내 비타민 D는 철 조절호르몬인 헵시딘 (hepcidin)에 영향을 주고, 이러한 작용으로 혈청 철분 농도가 감소하여 빈혈을 유발할 수 있다는 메커니즘 이 제시되었다 [5]. 특히, 아동 및 청소년기는 성장으로 인 해 철 요구량이 증가되어 상대적인 철 부족 상태가 나타날
수 있으며 [6] 젊은 여성은 월경으로 인해 철 손실이 크고 남성에 비해 빈혈 유병률이 더 높다고 알려져 있다 [6,7].
따라서 철 부족 및 철 손실이 상대적으로 큰 여자 청소년 및 젊은 여성의 비타민 D 부족은 빈혈 발생 위험에 더 크 게 노출될 수 있다.
지금까지 일부 국내외 선행연구를 통해서 체내 비타민 D 농도에 영향을 미칠 수 있는 요인들이 제시되어 왔으나 [8-15], 대부분 국외 인구를 대상으로 진행되었거나, 폐경기 여성 및 노인 인구에 국한되어 연구가 수행되었다 [8-15].
특히, 체내 비타민 D 수준이 매우 낮다고 알려진 국내 여 자 청소년 및 젊은 여성을 대상으로 한 연구는 제한적인 실정이다 [16].
따라서 본 연구는 여자 청소년 및 젊은 여성들을 대상으 로 체내 비타민 D의 결핍에 따른 빈혈과의 연관성을 분석 하여 빈혈의 예방 및 관리에 기초자료를 제공하고자 한다.
연구방법
분석자료 및 대상
본 연구는 국민건강영양조사 (Korea National Health and Nutrition Examination Survey, KNHANES) 데이터를 이용 하여 분석하였다. KNHANES는 1998년부터 시작된 전국 규모의 건강 및 영양조사로, 우리나라 국민의 건강관련 의 식 및 행태, 건강수준, 식품 및 영양 섭취 실태를 파악하기 위해 수행되고 있는 대규모 횡단 연구이다. 이는 검진 조사, 건강설문조사, 영양조사로 구성되어 있으며, 제1기 (1998), 제2기 (2001), 제3기 (2005), 제4기 (2007 ~ 2009), 제5기 (2010 ~ 2012), 제6기 (2013 ~ 2015), 제7기 (2016 ~
2017)까지 조사가 실시되었다. 본 연구는 주요 노출 인자 인 혈청 25(OH)D 농도 정보가 수집된 2008 ~ 2014년의 조 사자료를 이용하여 분석을 실시하였다.
KNHANES 2008 ~ 2014에 참여한 대상자 총 61,379명 중 다음에 해당하는 경우에는 분석에서 제외하였다. 남성 인 경우 (n = 27,859), 만 12 ~ 29세 (여자 청소년 및 20대 여성)에 해당하지 않는 경우 (n = 27,577), 혈청 25(OH)D 값이 결측인 경우 (n = 1,468), 헤모글로빈 (hemoglobin)의 값이 결측인 경우 (n = 40), 분석을 위한 시계열 가중치 변 수가 결측인 경우 (n = 610), 빈혈에 영향을 미칠 수 있는 기저 질환자의 경우 (암, 심혈관계질환, 당뇨병, 간질환, 신장질환) (n = 29), 조사 당시 임신 또는 수유 중인 대상자 (n = 153)를 제외하여 총 3,643명이 주요 분석에 포함되었다.
본 연구의 자료는 모든 대상자들에게 서면 동의 후 수집 되었고, 질병관리본부 윤리위원회의 심의를 통과하여 진 행되었다 (승인번호: 2008-04EXP-01-C, 2009-01CON-03-
2C, 2010-02CON-21-C, 2011-02CON-06-C, 2012-01EXP- 01-2C, 2013-07CON-03-4C, 2014-12EXP-03-5C).
인구 통계학 및 생활 습관 자료
건강 설문조사는 대상자들의 만 나이, 가구소득수준, 흡 연 상태, 음주 습관, 신체활동 등에 관련된 정보로, 조사 항목에 따라 자기기입식 설문지를 이용하거나 면접 방식 으로 수집되었다. 가구소득수준은 가구균등화소득에 근거 하여 4분위로 나누어 하, 중하, 중상, 상으로 분류하였다.
흡연 상태는 현재 흡연 유무를 기준으로 비흡연자, 흡연자 로 구분하였고, 음주 여부는 지난 1년 동안의 음주 섭취량 을 기준으로 비음주자, 음주자로 구분하였다. 식이보충제 의 경우, KNHANES 2008 ~ 2009년 설문지 문항 중 ‘비타 민 또는 무기질제 복용여부’에 대한 응답과 KNHANES 2010 ~ 2014년 설문지 문항 중 ‘최근 1년 동안 2주 이상 식이보충제 복용여부’에 대한 응답을 이용하여 복용자와 비복용자로 분류하였다. 신체활동은 2008 ~ 2012년의 경 우 걷기/중등도/격렬한 신체활동 일수 및 시간에 대한 자 료를 이용하여 주당 신체활동 시간을 산출하고, 운동 강도 에 따른 가중치를 곱해 계산하였다. 2013 ~ 2014년의 경 우, 고강도/중강도 신체활동이 일과 여가로 다시 세분화되 어 조사되었으므로, 각각의 평균값에 가중치를 곱하여 계 산하였다. 산출된 대사당량 (metabolic equivalents, METs) 을 주당 신체활동수준 (METs-hour/week)으로 계산한 후, 20 METs-h/week 미만을 저 (low), 20 ~ 39 METs-h/week 를 중 (mid), 40 METs-h/week 이상을 고 (high)로 분류하 여 제시하였다. 대상자의 스트레스 인지 정도는 거의 느끼 지 않는다, 조금 느끼는 편이다, 많이 느끼는 편이다로 구 분하였다. 수면시간은 하루 평균 수면 시간을 측정 후, 연 령에 따른 권장 수면 시간을 참고하여 적절함과 부적절함 으로 구분하여 분석에 이용하였다 [17].
신체계측 및 혈액지표 자료
대상자의 신장, 체중 및 체질량지수 (body mass index, BMI)와 같은 검진조사는 훈련된 조사원에 의해 표준화된 지침에 따라 이루어졌다. BMI는 체중 (kg)/신장 (m2)으로 산출하였다. 젊은 성인 여성의 경우 세계보건기구 (World Health Organization, WHO) 아시아-태평양 지역의 기준을 이용하여 [18] BMI가 25 kg/m2 이상, 여자 청소년의 경우 소아 청소년 성장 도표를 이용하여 [19] 연령별 BMI가 95 백분위수 이상일 경우 비만으로 정의하였다. 헤모글로빈 및 혈청 25(OH)D 수준 측정 등을 위한 혈액검사를 목적으로 만 10세 이상을 대상으로 채혈이 실시되었다. KNHANES 참 여에 동의한 사람 중 채혈에 동의한 사람에 한하여 진행되
Vitamin D sufficiency (≥ 20 ng/mL)
Vitamin D deficiency (< 20 ng/mL)
p value
n 560 3,083
Age group1) ***
Adolescent girls 297 (53.0) 1,282 (41.6) Young women 263 (47.0) 1,801 (58.4)
Residential area NS
Urban 260 (46.4) 1,534 (49.8)
Rural 300 (53.6) 1,549 (50.2)
Household income2) NS
Low 69 (12.5) 318 (10.4)
Mid ~ low 153 (27.7) 761 (24.9)
Mid ~ high 158 (28.6) 964 (31.6)
High 173 (31.3) 1,012 (33.1)
Obesity3) 54 (9.64) 368 (11.9) NS
Values are n (%)
1) The range of age were 12 ~ 18 years for adolescents and 19
~ 29 years for young women.
2) Household income was calculated based on equivalised income, and divided into quartiles.
3) Obesity was defined as body mass index percentiles of ≥ 95th in adolescent girls and body mass index of ≥ 25 kg/m2 in young women.
4) Physical activity was calculated as metabolic equivalents (METs-h/week) and categorized as follows: low < 20, mid ≥ 20 to
< 40, and high ≥ 40.
5) Adequate levels of sleep duration were defined according to the National Sleep Foundation criteria as follows: 9 ~ 11 hours in 12
~ 13 years of adolescents, 8 ~ 10 hours in 14 ~ 17 years of adolescents, and 7 ~ 9 hours in 18 ~ 29 years of young women.
Statistical significance is defined as *p < 0.05, **p < 0.01, ***p <
0.001, and NS stands for not significant.
Table 1. Demographic and lifestyle characteristics of participants according to the serum 25-hydroxy vitamin D (25(OH)D) concentration
었으며, 참여자의 공복 시간과 채혈 금지 대상 여부를 확 인한 후 시행되었다. 주로 사용하지 않는 팔을 우선으로 하였고, 혈관이나 팔에 문제가 없는지 확인 후 이상이 없 을 경우에 채취하였다. 이렇게 채취된 혈액은 당일 임상검 사기관으로 운송되어 24시간 이내에 분석을 실시하도록 하였다.
혈청 25(OH)D와 헤모글로빈 농도 측정의 경우 2008년 2월 15일까지는 서울의과학연구소에서 이루어졌고, 2008년 2월 20일 이후부터 네오딘의학연구소에서 수행되었다. 혈 청 25(OH)D 농도는 방사면역측정법 (Radioimmunoassay) 을 통해 측정되었다. 헤모글로빈은 서울의과학연구소에서 는 ADVIA 120 (Siemens, USA)로, 네오딘의학연구소에서 는 XE-2100D (Sysmex, Japan)을 이용하여 측정되었다. 혈 청 페리틴은 2008 ~ 2012년도 조사년도에서만 분석되었고, 서울의과학연구소에서는 ADVIA Centaur (Siemens, USA)로, 네오딘의학연구소에서는 1470 WIZARD gamma-Counter (PerkinElmer, Finland)으로 측정되었다.
비타민 D 결핍과 빈혈 정의
미국국립의학연구소 (Institute of Medicine)의 기준을 참 고하여 혈청 25(OH)D 농도가 20 ng/mL 미만일 경우 비타민 D 결핍군으로, 20 ng/mL 이상일 경우 비타민 D 충분군으로 구분하였다 [20]. WHO 기준에 따라 페리틴 값이 15 ng/mL 미만일 경우 철 결핍성 빈혈로 정의하였고 [21], 헤모글로 빈 농도가 12 g/dL 미만일 경우 빈혈로 정의하였다 [22].
통계분석
본 연구는 KNHANES의 연도별 통합 분석을 위해 복합 표본설계방법을 이용하였고, 1차 추출 단위 (primary sampl- ing unit), 층화 변수 (strata), 가중치 (weight) 등을 모두 고 려하여 기술적 통계처리를 하였다. 빈혈 유무에 따른 일반적 특징을 나타내는 변수는 범주형 변수로서, 빈도와 백분율로 제시하고 그룹간 분포 차이는 카이 제곱 검정 (chi-square test)을 이용하였다. 혈청 비타민 D의 충분군 및 결핍군과 빈혈 사이의 연관성을 분석하기 위해 다중 로지스틱 회귀 분석을 통해 교차비 (odds ratio, OR)와 95% 신뢰구간 (confidence interval, 95% CI)을 산출하였다. 분석과정에서 잠재적 교란인자 (confounding factor)는 다음과 같이 고려 하였다. Outcome인 빈혈의 위험요인과 exposure인 혈청 25(OH)D 농도와의 연관성을 제시한 선행문헌 [23-27] 및 exposure와 유의적인 상관성을 보인 요인들 (Table 1)을 검토하였다. 잠재적 교란인자 외 주요 공변량도 단계적으 로 보정하는 통계 모델은 다음과 같다. Model 1: 보정하지 않은 모델; Model 2: 나이와 비만 여부를 보정한 모델; 그
리고 Model 3: Model 2에 포함된 공변량과 함께 현재 흡 연 여부, 음주 여부, 가구소득수준 그리고 신체활동 수준 을 보정한 모델을 이용하였다. Table 2의 model 3에 포함 된 공변량을 보정한 스플라인 회귀분석 (restricted cubic spline regression)을 통해 혈청 25(OH)D 농도와 빈혈 및 철 결핍성 빈혈 간의 비선형적 관계를 분석하였다. 혈청 비타민 D 수준과 빈혈 사이의 연관성을 변경시킬 수 있는 효과변경인자 (effect modifier)는 발견되지 않았다. 본 연 구의 자료 통계 처리는 SAS (Statistical Analysis System version 9.4, SAS Institute, Cary, NC, USA)를 이용하였고, 통계적 유의성은 p < 0.05를 기준으로 검정하였다.
결 과
비타민 D 결핍 여부에 따른 대상자의 일반적 특성 비타민 D 충분군과 결핍군으로 분류된 대상자들의 일반 적인 특성은 Table 1에 제시하였다. 총 분석 대상자는 3,643명이고, 비타민 D 충분군은 560명, 결핍군은 3,083명
Vitamin D sufficiency (≥ 20 ng/mL)
Vitamin D deficiency (< 20 ng/mL)
p value
Physical activity4) **
Low 275 (49.6) 1,710 (56.1)
Mid 124 (22.3) 670 (22.0)
High 156 (28.1) 670 (22.0)
Current smokers 23 (4.84) 195 (6.78) NS
Alcohol drinkers 274 (49.7) 1,811 (59.9) ***
Stress status **
Not stressful 76 (13.7) 290 (9.51)
Mildly stressful 308 (55.5) 1,677 (55.0) Very or extremely stressful 171 (30.8) 1,084 (35.5) Sleep duration, appropriate5) 262 (47.3) 1,487 (48.9) NS Dietary supplement use 157 (28.6) 801 (26.2) NS Values are n (%)
1) The range of age were 12 ~ 18 years for adolescents and 19
~ 29 years for young women.
2) Household income was calculated based on equivalised income, and divided into quartiles.
3) Obesity was defined as body mass index percentiles of ≥ 95th in adolescent girls and body mass index of ≥ 25 kg/m2 in young women.
4) Physical activity was calculated as metabolic equivalents (METs-h/week) and categorized as follows: low < 20, mid ≥ 20 to
< 40, and high ≥ 40.
5) Adequate levels of sleep duration were defined according to the National Sleep Foundation criteria as follows: 9 ~ 11 hours in 12
~ 13 years of adolescents, 8 ~ 10 hours in 14 ~ 17 years of adolescents, and 7 ~ 9 hours in 18 ~ 29 years of young women.
Statistical significance is defined as *p < 0.05, **p < 0.01, ***p <
0.001, and NS stands for not significant.
Table 1. Demographic and lifestyle characteristics of participants according to the serum 25-hydroxy vitamin D (25(OH)D) concentration (continued)
(A) (B)
Fig. 1. Odds ratios (95% confidence intervals) for the non-linear relationship between serum 25-hydroxy vitamin D (25(OH)D) concentration and prevalence of (A) anemia and (B) iron deficiency anemia in adolescent girls and young women, evaluated with restricted cubic splines. The model was adjusted for age (continuous), obesity status (obese and non-obese), smoking status (smokers and non-smokers), alcohol consumption (drinkers and non-drinkers), household income (low, mid ~ low, mid ~ high, and high), and physical activity (low, mid, and high). Solid lines, OR; dashed lines, 95% CI.
Vitamin D sufficiency (≥ 20 ng/mL)
Vitamin D deficiency (< 20 ng/mL)
p value
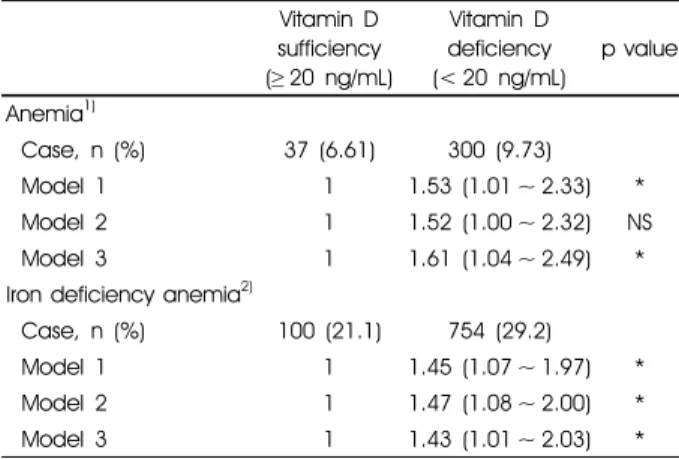
Anemia1)
Case, n (%) 37 (6.61) 300 (9.73)
Model 1 1 1.53 (1.01 ~ 2.33) *
Model 2 1 1.52 (1.00 ~ 2.32) NS
Model 3 1 1.61 (1.04 ~ 2.49) *
Iron deficiency anemia2)
Case, n (%) 100 (21.1) 754 (29.2)
Model 1 1 1.45 (1.07 ~ 1.97) *
Model 2 1 1.47 (1.08 ~ 2.00) *
Model 3 1 1.43 (1.01 ~ 2.03) *
1) Anemia was defined according to the World Health Organization criteria as follows: Hemoglobin < 12 g/dL.
2) Iron deficiency anemia was defined as ferritin < 15 ng/mL.
Ferritin variable was only available from Korea National Health and Nutrition Examination Survey 2008 ~ 2012, and missing data was n = 576.
Model 1: Unadjusted
Model 2: Adjustment for age (continuous) and obesity status (obese and non-obese)
Model 3: Model 2 plus additional adjustments for smoking status (smokers and non-smokers), alcohol consumption (drinkers and non-drinkers), household income (low, mid ~ low, mid ~ high, and high), and physical activity (low, mid, and high)
Statistical significance is defined as *p < 0.05, **p < 0.01, ***p <
0.001, and NS stands for not significant.
Table 2. Odds ratio and 95% confidence intervals of anemia and iron deficiency anemia according to the serum 25-hydroxy vitamin D (25(OH)D) concentration
으로 분류하였다. 충분군과 비교하여, 결핍군에서는 젊은 여성, 음주 섭취, 스트레스 정도가 유의적으로 높았다. 반
면, 신체활동 수준이 높은 대상자는 유의적으로 낮았다.
그 외, 거주 지역, 가구소득 수준, 비만 여부, 현재 흡연 여 부, 적정 수면 여부, 식이보충제 복용 여부는 그룹 간 유의 적인 차이를 보이지 않았다.
비타민 D 결핍과 빈혈 및 철 결핍성 빈혈 유병 비타민 D 충분군과 결핍군에 따른 빈혈 및 철 결핍성 빈혈과의 연관성을 분석한 결과는 Table 2에 제시하였다.
비타민 D 결핍군은 충분군보다 빈혈의 유병률이 높았고, 이는 model 2를 제외한 모든 통계모델에서 유의적이었다 (model 1: [OR: 1.53, 95% CI: 1.01 ~ 2.33], model 2: [OR:
1.52, 95% CI: 1.00 ~ 2.32], model 3: [OR: 1.61, 95% CI:
1.04 ~ 2.49]). 한편, 철 결핍성 빈혈의 경우 비타민 D 결핍 군이 충분군에 비해 모든 통계모델에서 유의적으로 유병 률이 더 높았다 (model 1: [OR: 1.45, 95% CI: 1.07 ~ 1.97], model 2: [OR: 1.47, 95% CI: 1.08 ~ 2.00], model 3: [OR:
1.43, 95% CI: 1.01 ~ 2.03]).
혈청 25(OH)D 농도와 빈혈 및 철 결핍성 빈혈과의 비선 형성 연관성을 분석한 스플라인 곡선은 Fig. 1에 제시하였다.
공변량을 보정한 결과, 빈혈 및 철 결핍성 빈혈 모두 혈청 25(OH)D 농도가 증가함에 따라 유병률이 용량-반응 관계의 형태로 감소하는 선형 관계를 보였다 (p for nonlinearity
> 0.05).
고 찰
본 연구는 제4기 ~ 제6기 (2008 ~ 2014년) KNHANES 자 료를 이용하여 한국의 12 ~ 29세 여자 청소년 및 젊은 여성 을 대상으로 혈청 25(OH)D 수준과 빈혈 및 철 결핍성 빈 혈의 연관성을 규명하고자 하였다. 그 결과, 체내 비타민 D 가 결핍일 경우 철 결핍성 빈혈 및 빈혈의 유병률이 높았 고, 이는 혈청 25(OH)D 수준과 용량-반응 관계를 보였다.
젊은 여성의 혈청 25(OH)D 농도가 여자 청소년보다 더 낮은 경향을 보이는 것은 영국 국민을 대상으로 한 영양조 사 분석 결과와 일치하는 방향을 보였다. 해당 연구에 따 르면 혈청 25(OH)D 농도가 25 nmol/L 미만인 비율이 10 대에 비해 19 ~ 24세 여성에게서 더 높은 것으로 나타났다 [28]. 이에 대한 정확한 메커니즘은 알려진 바 없으나 자외 선 노출 시간이나 자외선 차단제 사용, 또는 식이 요인의 차이로 추정된다.
한편, 신체활동 수준이 높은 대상자들의 혈청 25(OH)D 농도가 신체활동이 낮은 대상자들보다 상대적으로 높은 경향을 보이는 것은 미국 청소년 [29], 사우디아라비아의 젊은 성인 [30], 한국 성인 여성 [31]을 대상으로 시행된 기존 선행연구와 일치하는 결과였다. 신체활동은 골밀도 를 증가시키고, 칼슘 배설의 감소와 흡수의 효율을 높일 수 있다 [32]. 이는 결과적으로, 혈중 칼슘 농도가 증가함 으로써 혈청 25(OH)D 수준이 잔류 되는 효과가 있는 것 으로 추측된다 [32].
본 연구에서는 비타민 D 결핍 상태인 대상자들에게서 높은 빈혈 유병률을 보였다. 인도의 어린이를 대상으로 진 행된 선행연구에서도 비타민 D 결핍 그룹에서 빈혈의 위 험이 1.58배 높은 결과를 보였고 [33], 미국의 어린이 및 청소년에서도 비타민 D 결핍 상태와 빈혈 위험 간의 유의 한 양의 연관성을 제시하였다 [34]. 또한, 관찰 연구들을 종합한 메타 분석의 결과에서도 비타민 D 결핍 그룹에서 빈혈의 위험이 2.25배 높았다 [35]. 비타민 D는 적혈구 전 구체를 직접적으로 조절한다고 알려져 있으며, 이러한 비 타민 D의 수용체는 체내 신장 및 뼈 골수를 포함한 여러 기관에서 발견되고 있다 [36,37]. 특히 정상적인 골수 내의 비타민 D 수준은 혈장에 비해 약 500배 정도 높다고 밝혀 진 바 있다 [38]. 만약 체내 비타민 D가 부족할 경우, 골수 내 미세 환경의 면역 세포를 자극하여 적혈구 생성에 관여하는 에리트로포이에틴을 억제하는 사이토카인을 생산하여 조혈 기능에 문제를 일으킴으로써 빈혈을 유발할 수 있다 [39].
비타민 D 결핍군은 철 결핍성 빈혈의 유병률도 높은 것 으로 관찰되었다. 선행 연구에 따르면 폐경 전 여성을 대상 으로 분석한 경우에도 혈청 25(OH)D 수준이 가장 낮은 그룹 에서 철 결핍성 빈혈 유병률이 1.53배 더 높은 수준을 보 였다 [40]. 뿐만 아니라 젊은 여성 중 철 결핍성 빈혈 환자를 대상으로 한 임상시험연구에서는 비타민 D 결핍인 여성 에서 철분 공급량이 낮아지며, 이는 철 결핍의 유병률을 높 일 수 있다고 설명하였다 [41]. 체내 비타민 D가 결핍 상태 일 경우 철 조절 호르몬인 헵시딘의 농도는 증가한다 [5].
헵시딘은 간에서 생성되며, 페로포틴 (ferroportin)과 결합 하여 체내 주요 세포에서 혈장으로 철이 이동되는 것을 억 제하는 기능을 한다 [42]. 페로포틴은 헵시딘의 수용체로서, 이 둘이 서로 결합할 경우 내포 작용이 발생하게 된다 [42].
따라서 체내 비타민 D가 부족하여 헵시딘 농도가 증가할 경우, 헵시딘이 페로포틴 수용체와 더욱 결합하게 됨에 따라 결합체가 세포 내로 들어오게 되면서 철을 혈청 내로 이동 시킬 수 없게 되어 철 결핍성 빈혈이 발생할 수 있다 [42].
본 연구는 다음과 같은 몇 가지 제한점을 가지고 있다.
첫째, 혈청 25(OH)D 농도에 영향을 미칠 수 있는 햇빛 노 출 시간, 자외선 차단제 사용 유무, 계절 등 측정되지 않은 변수나 우리가 알지 못하는 잠재적인 교란인자의 영향이 있을 수 있다. 햇빛 노출 정도는 비타민 D 합성에 영향을 미치는 중요한 변수임에도 불구하고 본 분석에 포함되지 못하였다. 둘째, KNHANES 자료는 단면 연구로, 대상자 의 혈청 25(OH)D 농도와 빈혈 유병 여부에 대한 정보는 동일한 시점에 수집되어 인과관계를 명확히 할 수 없었다.
따라서 빈혈 환자의 야외활동 감소로 인해 비타민 D 결핍 이 발생할 수도 있다는 역 인과성의 가능성도 배제할 수
없다. 셋째, 본 연구에 포함된 식이보충제 정보에는 정확 한 비타민 D 함량 정보가 부재하여 그 섭취량을 산출하지 못하였다. 또한 빈혈에 영향을 미칠 수 있는 식이요인을 보정하지 못한 제한점이 있다. 그러나 이러한 제한점에도 불구하고 본 연구는 KNHANES의 7개년도 자료를 통합한 결과로, 기존 국내 연구들의 확장 연구로서 그 근거를 누 적할 수 있는 연구라는 점에서 의미가 있다. 또한, 국내 청 소년 및 젊은 여성의 비타민 D 수준과 빈혈과의 연관성을 분석함으로써 빈혈의 예방 및 관리에 기초자료를 제공할 수 있을 것으로 기대한다.
결론적으로 본 연구를 통해 우리나라 청소년 및 젊은 성 인 여성의 비타민 D 수준과 빈혈 및 철 결핍성 빈혈 유병 률 간의 유의미한 음의 연관성을 확인할 수 있었다. 또한 이러한 연관성은 유의미한 용량-반응 관계를 보였다. 이와 같은 결과를 종합해 볼 때, 10 ~ 20대 여자 청소년 및 젊은 여성들의 빈혈 및 철 결핍성 빈혈을 예방하기 위하여 적정 수준의 체내 비타민 D 농도 유지가 필요할 것으로 사료된 다. 후속 연구에서는 혈청 25(OH)D와 빈혈 간의 명확한 인과 관계를 조사하기 위해 관련 인자들을 적절하게 고려 한 대규모 전향적인 코호트 연구 혹은 임상연구가 수행되 어야 할 것이다.
요 약
본 연구는 2008 ~ 2014년까지 수행된 국민건강영양조사 자료를 활용하였다. 본 분석 대상자는 12 ~ 29세 여자 청 소년 및 젊은 여성이며, 이들을 대상으로 비타민 D 결핍 여부에 따른 빈혈 및 철 결핍성 빈혈과의 연관성 분석을 실시하였다. 그 결과, 교란인자를 보정한 다중 로지스틱 회귀분석 모델에서 비타민 D 결핍군이 충분군보다 빈혈 및 철 결핍성 빈혈의 유병률이 유의적으로 높았다. 또한 혈청 25(OH)D 농도가 증가함에 따라 빈혈 및 철 결핍성 빈혈의 유병률이 낮아지는 선형 관계가 나타났다. 본 연구 의 결과는 청소년 및 젊은 여성에서 문제가 되고 있는 비 타민 D 결핍과 빈혈에 대한 예방 및 관리에 기초자료를 제공할 수 있다고 기대된다. 추후 전향적인 코호트 연구 및 임상시험 연구 설계를 이용한 후속 연구를 수행하여 비 타민 D와 빈혈 사이의 명확한 인과관계를 확인할 필요가 있다고 사료된다.
ORCID
장하은: https://orcid.org/0000-0003-1787-8402 박성희: https://orcid.org/0000-0002-7184-4943
박 경: https://orcid.org/0000-0002-4681-1584
References
1. Health Insurance Review and Assessment Service (KR).
Vitamin D deficiency could be developed frequently during winter season because of short-term sun exposure Gangwon-do Province Health Insurance Review and Assessment service [Internet]. Wonju: Health Insurance Review and Assessment Service; 2016 [cited 2018 Oct 6]. Available from: http://www.
hira.or.kr/bbsDummy.do;INTERSESSIONID=3NFJrlIBy8E0D 7WQHBMWFTcaDeX2vFfF9m84bsakSGvY27jlblYB!540393 515!678406627?pgmid=HIRAA020041000100&brdScnBltNo=
4&brdBltNo=9074&pageIndex=1#none.
2. Jung IK. Prevalence of vitamin D deficiency in Korea: results from KNHANES 2010 to 2011. J Nutr Health 2013; 46(6):
540-551.
3. Stagi S, Cavalli L, Iurato C, Seminara S, Brandi ML, de Martino M. Bone metabolism in children and adolescents: main characteristics of the determinants of peak bone mass. Clin Cases Miner Bone Metab 2013; 10(3): 172-179.
4. Weaver CM, Gordon CM, Janz KF, Kalkwarf HJ, Lappe JM, Lewis R, et al. The National Osteoporosis Foundation's position statement on peak bone mass development and lifestyle factors:
a systematic review and implementation recommendations.
Osteoporos Int 2016; 27(4): 1281-1386.
5. Carvalho C, Isakova T, Collerone G, Olbina G, Wolf M, Westerman M, et al. Hepcidin and disordered mineral metabolism in chronic kidney disease. Clin Nephrol 2011; 76(2): 90-98.
6. Van Assendelft O, Bakes-Martin RC, Bern C, Bowman BA, Clark LD, Grummer-Strawn L, et al. Recommendations to prevent and control iron deficiency in the United States [Internet]. Atlanta (GA): Centers for Disease Control and Prevention; 1998 [cited 2018 Aug 20]. Available from: https://stacks.cdc.gov/view/
cdc/5659.
7. Lee JO, Lee JH, Ahn S, Kim JW, Chang H, Kim YJ, et al.
Prevalence and risk factors for iron deficiency anemia in the Korean population: results of the fifth Korea National Health and Nutrition Examination Survey. J Korean Med Sci 2014;
29(2): 224-229.
8. Palaniswamy S, Hyppönen E, Williams DM, Jokelainen J, Lowry E, Keinänen-Kiukaanniemi S, et al. Potential determinants of vitamin D in Finnish adults: a cross-sectional study from the Northern Finland birth cohort 1966. BMJ Open 2017; 7(3):
e013161.
9. Shirazi L, Almquist M, Malm J, Wirfält E, Manjer J. Determinants of serum levels of vitamin D: a study of life-style, menopausal status, dietary intake, serum calcium, and PTH. BMC Womens Health 2013; 13: 33.
10. Touvier M, Deschasaux M, Montourcy M, Sutton A, Charnaux N, Kesse-Guyot E, et al. Determinants of vitamin D status in Caucasian adults: influence of sun exposure, dietary intake, sociodemographic, lifestyle, anthropometric, and genetic factors.
J Invest Dermatol 2015; 135(2): 378-388.
11. van Dam RM, Snijder MB, Dekker JM, Stehouwer CD, Bouter LM, Heine RJ, et al. Potentially modifiable determinants of
vitamin D status in an older population in the Netherlands: the Hoorn Study. Am J Clin Nutr 2007; 85(3): 755-761.
12. Rassouli A, Milanian I, Moslemi-Zadeh M. Determination of serum 25-hydroxyvitamin D(3) levels in early postmenopausal Iranian women: relationship with bone mineral density. Bone 2001; 29(5): 428-430.
13. Yoon JS, Song MK. Vitamin D intake, outdoor activity time and serum 25-OH vitamin D concentrations of Korean postme- nopausal women by season and by age. Korean J Community Nutr 2015; 20(2): 120-128.
14. Holick MF, Siris ES, Binkley N, Beard MK, Khan A, Katzer JT, et al. Prevalence of Vitamin D inadequacy among postmeno- pausal North American women receiving osteoporosis therapy.
J Clin Endocrinol Metab 2005; 90(6): 3215-3224.
15. Liu BA, Gordon M, Labranche JM, Murray TM, Vieth R, Shear NH. Seasonal prevalence of vitamin D deficiency in institu- tionalized older adults. J Am Geriatr Soc 1997; 45(5): 598-603.
16. Lee JA, Hwang JS, Hwang IT, Kim DH, Seo JH, Lim JS. Low vitamin D levels are associated with both iron deficiency and anemia in children and adolescents. Pediatr Hematol Oncol 2015; 32(2): 99-108.
17. National Sleep Foundation (US). National sleep foundation recommends new sleep times [Internet]. Washington, D.C.:
National Sleep Foundation; 2015 [cited 2019 Jun 18]. Available from: https://sleepfoundation.org/press-release/national-sleep- foundation-recommends-new-sleep-times/page/0/1.
18. World Health Organization. The Asia-Pacific perspective:
redefining obesity and its treatment. Sydney: Health Communi- cations Australia; 2000.
19. Kim JH, Yun S, Hwang SS, Shim JO, Chae HW, Lee YJ, et al. The 2017 Korean National Growth Charts for children and adolescents: development, improvement, and prospects. Korean J Pediatr 2018; 61(5): 135-149.
20. Institute of Medicine (US) Committee to Review Dietary Reference Intakes for Vitamin D and Calcium. Dietary reference intakes for calcium and vitamin D. Washington, D.C: National Academies Press; 2010.
21. World Health Organization. Serum ferritin concentrations for the assessment of iron status and iron deficiency in populations [Internet]. Geneva: World Health Organization; 2011 [cited 2019 Jan 10]. Available from: http://www.who.int/iris/handle/10665/
85843.
22. World Health Organization. Nutritional anaemias: tools for effective prevention and control [Internet]. World Health Organization; 2017 [cited 2018 Sep 28]. Available from:
https://www.who.int/nutrition/publications/micronutrients/anae mias-tools-prevention-control/en/.
23. Munasinghe LL, Ekwaru JP, Mastroeni MF, Mastroeni SS, Veugelers PJ. The association of serum 25-hydroxyvitamin D concentrations with elevated serum ferritin levels in normal weight, overweight and obese Canadians. PLoS One 2019;
14(3): e0213260.
24. Larose TL, Chen Y, Camargo CA Jr, Langhammer A, Romundstad P, Mai XM. Factors associated with vitamin D deficiency in a Norwegian population: the HUNT Study. J Epidemiol Community Health 2014; 68(2): 165-170.
25. Pereira-Santos M, Costa PR, Assis AM, Santos CA, Santos DB.
Obesity and vitamin D deficiency: a systematic review and meta-analysis. Obes Rev 2015; 16(4): 341-349.
26. Huang YF, Tok TS, Lu CL, Ko HC, Chen MY, Chen SC.
Relationship between being overweight and iron deficiency in adolescents. Pediatr Neonatol 2015; 56(6): 386-392.
27. Naude CE, Carey PD, Laubscher R, Fein G, Senekal M.
Vitamin D and calcium status in South African adolescents with alcohol use disorders. Nutrients 2012; 4(8): 1076-1094.
28. Prentice A. Vitamin D deficiency: a global perspective. Nutr Rev 2008; 66(10 Suppl 2): S153-S164.
29. Dong Y, Pollock N, Stallmann-Jorgensen IS, Gutin B, Lan L, Chen TC, et al. Low 25-hydroxyvitamin D levels in adolescents:
race, season, adiposity, physical activity, and fitness. Pediatrics 2010; 125(6): 1104-1111.
30. BinSaeed AA, Torchyan AA, AlOmair BN, AlQadhib NS, AlSuwayeh FM, Monshi FM, et al. Determinants of vitamin D deficiency among undergraduate medical students in Saudi Arabia. Eur J Clin Nutr 2015; 69(10): 1151-1155.
31. Choi EY. 25(OH)D status and demographic and lifestyle determinants of 25(OH)D among Korean adults. Asia Pac J Clin Nutr 2012; 21(4): 526-535.
32. Specker BL. Evidence for an interaction between calcium intake and physical activity on changes in bone mineral density. J Bone Miner Res 1996; 11(10): 1539-1544.
33. Chowdhury R, Taneja S, Bhandari N, Strand TA, Bhan MK.
Vitamin D deficiency and mild to moderate anemia in young North Indian children: a secondary data analysis. Nutrition 2019; 57: 63-68.
34. Atkinson MA, Melamed ML, Kumar J, Roy CN, Miller ER 3rd, Furth SL, et al. Vitamin D, race, and risk for anemia in children. J Pediatr 2014; 164(1): 153-158.e1.
35. Liu T, Zhong S, Liu L, Liu S, Li X, Zhou T, et al. Vitamin D deficiency and the risk of anemia: a meta-analysis of observational studies. Ren Fail 2015; 37(6): 929-934.
36. Reichel H, Koeffler HP, Norman AW. The role of the vitamin D endocrine system in health and disease. N Engl J Med 1989;
320(15): 980-991.
37. Norman AW. Minireview: vitamin D receptor: new assignments for an already busy receptor. Endocrinology 2006; 147(12):
5542-5548.
38. Blazsek I, Farabos C, Quittet P, Labat ML, Bringuier AF, Triana BK, et al. Bone marrow stromal cell defects and 1 alpha,25-dihydroxyvitamin D3 deficiency underlying human myeloid leukemias. Cancer Detect Prev 1996; 20(1): 31-42.
39. Icardi A, Paoletti E, De Nicola L, Mazzaferro S, Russo R, Cozzolino M. Renal anaemia and EPO hyporesponsiveness associated with vitamin D deficiency: the potential role of inflammation. Nephrol Dial Transplant 2013; 28(7): 1672-1679.
40. Shin JY, Shim JY. Low vitamin D levels increase anemia risk in Korean women. Clin Chim Acta 2013; 421: 177-180.
41. Blanco-Rojo R, Pérez-Granados AM, Toxqui L, Zazo P, de la Piedra C, Vaquero MP. Relationship between vitamin D deficiency, bone remodelling and iron status in iron-deficient young women consuming an iron-fortified food. Eur J Nutr 2013; 52(2): 695-703.
42. Ganz T. Systemic iron homeostasis. Physiol Rev 2013; 93(4):
1721-1741.