Vol. 13, No. 9 pp. 3815-3821, 2012
Analytical and experimental study on the quality improvement of 2 cavity injection-molded LCD frame
Jae-Hwan Son
1, Eun-Sil Jang
1, Chang-Woo Han
2, Jae-Yong Son
3and Young-Moon Lee
4*1Daegu Mechatronics & Materials Institute
2Division of Automobiles, Yeungnam College of Science & Technology
3Department of Agricultural Engineering, National Academy of Agricultural Science
4School of Mechanical Engineering, Kyungpook National University
2 캐비티 LCD 사출품의 품질향상에 관한 해석 및 실험적 연구
손재환
1, 장은실
1, 한창우
2, 손재용
3, 이영문
4*1대구기계부품연구원, 2영남이공대학 자동차과, 3국립농업과학원 농업공학부, 4경북대학교 기계공학부
Abstract The LCD frame is an important part which supports the BLU of medium/large sized TFT-LCD. To produce it efficiently, it is necessary to achieve the molding process improvement from 1 cavity to 2 cavity system. Because 2 cavity mold is compact and its hot-runner zone is broadened, it is difficult to control the temperature on the mold. In this study, injection molding analysis on the frame in 2 cavity process with FEA(Finite Element Analysis) software is carried out to estimate its quality. The calculated injection molding pressures and maximum deflection in 1 and 2 cavity processes are 41.13 MPa and 1.62 ㎜, 40.49 MPa and 1.66 ㎜ respectively. The measured maximum flexure load and surface roughness of the left and right frame of 2 cavities are 209 N and 0.08 ㎛, 193 N and 0.10 ㎛ while those in 1 cavity are 140 N and 0.13 ㎛. Thermal image shows that the maximum standard deviation of the temperature on left and right side of 2 cavity mold is 1.23 ℃ The simulation and measurement results show that the quality of the frame in 2 cavity injection molding process as a whole is not worse than that of 1 cavity system. But maximum flexure loads of the frame in 2 cavity process are far greater than that in 1 cavity process.
요 약 LCD 프레임은 중․대형 TFT-LCD BLU의 기본형상을 유지시켜주는 중요한 부분이다. 중․대형 LCD 프레임을
효율적으로 생산하기 위해 1 캐비티에서 2 캐비티 사출 공정으로의 개선이 필요하다. 2 캐비티 금형 구조는 콤팩트하
게 되었고 핫 런너 존이 증가되었기 때문에 사출온도를 조절하기 어렵게 되었다. 본 연구에서는 2 캐비티 사출성형공
정으로 생산된 프레임에 대한 품질을 평가하기 위해서 유한요소해석 프로그램을 사용하여 사출해석을 수행하였다. 1
캐비티와 2 캐비티 공정에서 계산된 사출압력과 최대 변형량은 각각 41.13 MPa과 1.62 ㎜, 40.49 MPa과 1.66 ㎜이 다. 1 캐비티 프레임의 측정된 최대 굽힘 하중, 표면거칠기가 140 N, 0.13 ㎛, 인데 비하여 2 캐비티 중 좌, 우 프레 임의 측정값들은 209 N, 0.08 ㎛와 193 N, 0.10 ㎛이다. 열화상은 2 캐비티 금형 중 좌․우 금형 온도의 최대 표준 편
차값은 1.23 ℃임을 나타내고 있다. 시뮬레이션과 측정은 전체적으로 2 캐비티 사출공정의 프레임 품질이 1 캐비티
품질보다 나쁘지 않다는 것을 보여주고 있다. 그러나 2 캐비티 공정에서 프레임의 최대 굽힘 하중값은 1 캐비티 공정
의 하중값보다 매우 증가되었다.
Key Words : Injection mold, injection molding analysis, warpage, 2 cavity process, LCD frame
*Corresponding Author : Young-Moon Lee Tel: +82-53-950-5574 email: [email protected]
Received June 20, 2012 Revised July 24, 2012 Accepted September 6, 2012
1. Introduction
Injection molding analysis is necessary to improve the injection molding method of 1 cavity with the existing 450 ton to produce the LCD frame. The molding quality can be estimated with numerical simulation program for injection molding analysis. It was researched on the cause and fundamental preventive method of warpage in injection molding process[1-3]. And the study on preventive method of warpage with the optimization method as genetic algorithm and Taguchi experimental method has been carried out[4-8]. The slower cooling speed in the part is, the more excessive its volumetric shrinkage becomes in injection molding process. Which makes the whole shape distorted, it is called by warpage which determines dimensional accuracy in injection molding. Warpage is mainly caused by the difference of residual stress in the molded product due to inhomogeneity in speeds of molding flows and cooling[9-11]. In this study, injection molding analysis using FEA software was performed to estimate injection quality in 2 cavity process. Standard deviations of the temperature on the mold, maximum flexure load, and dimensional accuracy were obtained. The simulation and measurement results show that the quality of the frame in 2 cavity injection molding process was not worse than that in 1 cavity process.
2. Finite element analysis
2.1 Mold of LCD Frame
Fig.1 shows the LCD frame and 2 cavity mold in injection molding process.
(a) (b)
Two medium/large sized frames can be made using the mold of 1,200×800 ㎜ at the same time.
2.2 Finite element model
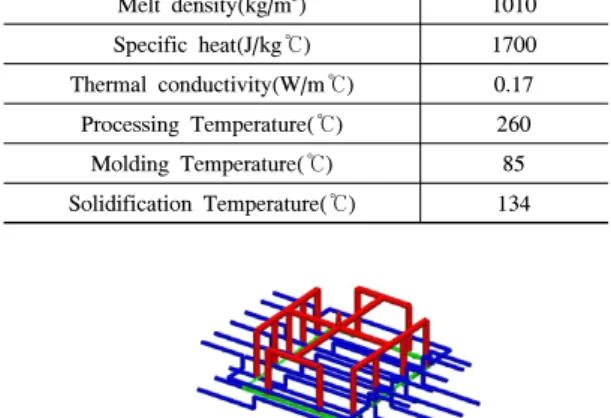
Table 1 shows the physical properties of the frame in injection molding process used as the input conditions of the finite element(FE) analysis on it. FE meshes of the frame in 1 and 2 cavity processes are shown in Fig. 1 and 2. The number of total elements used in each figure are 849,547 and 1,699,987, respectively.
[Table 1] The physical properties of the frame Melt density(kg/m3) 1010 Specific heat(J/kg℃) 1700 Thermal conductivity(W/m℃) 0.17 Processing Temperature(℃) 260 Molding Temperature(℃) 85 Solidification Temperature(℃) 134
[Fig. 2] The frame in 1 cavity process
[Fig. 3] The frame in 2 cavity process
2.3 Results of analysis
Through FE analysis, injection quality has been estimated in filling process where plastic resin is filed in the mold, compensate pressure process that is performed to adjust contraction percentage for cooling, and cooling process where the cooling water is flowed around the mold.
2.3.1 The analysis on filling process
Fig. 4 and 5 show injection pressures of each resin after completing filling. Maximum injection pressures of 1 and 2 cavity processes were calculated to be 41.13 and 40.49 MPa respectively.
[Fig. 4] Pressure distribution in 1 cavity process
[Fig. 5] Pressure distribution in 2 cavity process
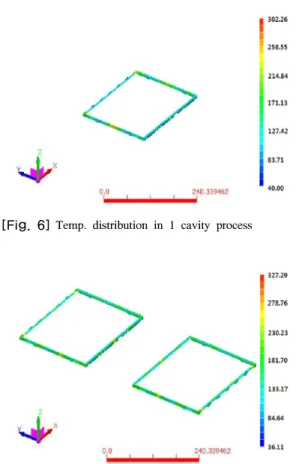
In Fig. 6 and 7, temperature distributions after completing filling in 1 and 2 cavity processes are shown to be ranged in 40.0~302.3 and 36.1~327.3 ℃ respectively. It is not considered that there is any section where its temperature rapidly increases or drops so that its thickness becomes uneven.
[Fig. 6] Temp. distribution in 1 cavity process
[Fig. 7] Temp. distribution in 2 cavity process
2.3.2 The analysis on compensating pressure process
Fig. 8 and 9 show volumetric shrinkages of the frame in molding process. It was found out that the shrinkages in 1 and 2 cavity processes were ranged in -0.15~9.70 and 0.21~9.83 % and higher in thicker section.
[Fig. 8] Volumetric shrinkage in 1 cavity process
[Fig. 9] Volumetric shrinkage in 2 cavity process
2.3.3 The analysis on cooling process Fig. 10 and 11 show that the mold temperatures of 1 and 2 cavity cooling processes are ranged in 40.0~55.8 and 36.1~109.1℃ respectively. It is known that their governing temperatures are 45,3 and 92.1 ℃.
[Fig. 10] mold temperature in 1 cavity process
[Fig. 11] mold temperature in 2 cavity process
2.3.4 The analysis on warpage
As the temperature of the product in the mold
due to its contraction occur. Fig. 12 and 13 show total warpages of the frame in injection molding process. The warpages in 1 and 2 cavity processes were calculated to be 1.62 and 1.66 ㎜ respectively.
[Fig. 12] Warpage in 1 cavity process
[Fig. 13] Warpage in 2 cavity process
3. Evaluation of optimizing injection molding process
3.1 Measuring the temperature on the mold To measure the temperature deviation on the left and right side of the 2 cavity mold, thermal image measuring equipment (ThermaCAMTM P25) is used(Fig. 14). The thermal image camera was installed vertically. Setting up the molding temperature of 90℃ at room temperature of 20℃ and the measuring area of mold core as in Fig. 15, the temperature on the mold has been measured at 4 and 5 spots in the left[upper] and right[lower] side of 2 cavities. The standard deviation of the temperature in left and right side are 1.23 and 0.89 ℃ respectively. There are far less than 4℃, which should be the limit of the
average temperature on the left and right side of the 2 cavity mold are 91.8 and 93.3 ℃ respectively. It was known that the maximum difference between measured and calculated governing temperature is 1.2 ℃.
[Fig. 14] Thermal image measuring equipment
[Fig. 15] Measured result of the temperature
[Table 2] Measured results of the temperature on the mold Left
[upper]
side
Spot #1 #2 #3 #4 - Standard dev.
Results(℃) 90.3 91.9 91.6 93.3 - 1.23
Right [lower]
side
Spot #1 #2 #3 #4 #5 Standard dev.
Results(℃) 94.4 92.9 93.9 92.1 93.3 0.89
3.2 Results of test and measurement Fig. 16 shows the test results of maximum flexure load to the LCD frame. Maximum flexure load were measured to be 140 N in 1 cavity process and 209 and 193 N in left and right side of 2 cavity process respectively.
[Fig. 16] Maximum flexure load of the frame
[Fig. 17] Surface roughness of the frame
In Fig. 17, the average of surface roughness of left and right frame in 2 cavities are 0.08 and 0.10 ㎛ respectively while that in 1 cavity is 0.13 ㎛.
4. Conclusions
In this study, it is known following conclusions.
(1) Quality improvements of the products in 2 cavity injection molding process of the LCD frame have been sought using finite element analysis.
(2) Optimization of injection molding process has been carried out and verified through measuring the standard deviation of the temperature on the mold, the maximum flexure load and the dimensional accuracy.
(3) It is calculated that the maximum injection pressure in 2 cavity process is near that in 1 cavity process. The percentages of volumetric contraction and maximum
deformation show that the quality of products in 2 cavity process is good.
(4) The measured maximum standard deviation of the temperature on the mold in 2 cavity process is 1.23 ℃.
And It was known that the measured temperatures are near the calculated governing one.
(5) It is measured that the maximum flexure loads and average surface roughnesses in 2 cavity process are superior than those in 1 cavity process.
(6) The simulation and measurement results show that the quality of the LCD frame in 2 cavity injection molding process as a whole was not worse than that in 1 cavity process. But maximum flexure loads of the frame in 2 cavity process are far greater than that in 1 cavity process.
References
[1] Jacques, M.S., "An Analysis of Thermal Warpage in Injection Molded Flat parts Due to Unbalanced Cooling", Polymer Eng. and Science, Vol.22, No.4, pp.
241-247, 1982.
[2] Lam, Y.C. and Seow, L.W., "Optimzing flow in plastic injection molding", Journal of Materials processing Technology, Vol.72, pp. 333-341, 1997.
[3] Lee, Y.U., "A Study on the Battery Case Injection Molding by CAE Analysis," J. of the korean Academic-Industrial Cooperation Society, Vol.12, No.1, pp. 55-61, 2011.
[4] Min, B.H., "A study on quality monitoring of injection-molded parts", Journal of Materials Processing Technology, Vol.136, pp. 1-6, 2003.
[5] Park, J.C. and Kim, B.H., "Automated Molding Design Methodology to Optimize Multiple Defects in Injection Molded Parts," Jnt'I J. of the korean Society of Precision Engineering, Vol.1, No.1, pp. 133-145, 2000.
[6] Choi, W.J., Sin, H.C., and Kwak, S.W., "Optimization of Processing Conditions in injection Molding Using Genetic Algorithm", The Korean Society of Mechanical Engineers(A), Vol.24, No.10, pp. 2543-2551, 2000.
[7] Shen, C.Y., Yu, X.R., Li, Q., and Li, H.M., "Gate Location Optimization in Injection Molding By Using Modified Hill-Climbing Algorithm", Polymer-Plastics Technology and Engineering, Vol.43, No.3, pp.
649-659, 2004.
[8] Erzurumlu, T. and Ozcelik, B., "Minimization of warpage and sink index in injection-molded thermo plastic parts using Taguchi optimization method", Materials and Design, Vol.27, pp. 853-861, 2006.
[9] T. Kwon and etc trans., “Moldflow Design Guide", MunUnDang, pp.121-151, 2001.
[10] Son, J.H., Kim. Y.S., and Han. C.W., "A Quality Stability Estimation of Shock-absorber Tube for Automatic Drawer," J. of the korean Academic-Industrial Cooperation Society, Vol.12, No.7, pp. 2919-2924, 2011.
[11] Malloy, R.A., "Plastic Part Design for injection Molding: An Introduction", Hanser/Gardner Publishers, Inc., Cincinnati, pp.75-84, 1994.
Jae-Hwan Son
[Regular member]• Feb. 2009 : Kyungpook National Univ., Dept. of Mechanical Engineering, Ph.D.
• Nov. 2001 ~ current : Daegu Mechatronics & Materials Institute, Mechatronics Center, Team Manager
<Research Interests>
Mechanical design, Precise machining system, Total engineering solutions
Eun-Sil Jang
[Regular member]• Feb. 2012 : Kyungpook National Univ., Dept. of Mechanical Engineering, Complete of Ph.D.
• May. 2008 ~ current : Daegu Mechatronics & Materials Institute, Mechatronics Center, Senior Researcher
<Research Interests>
Manufacturing system, Design and analysis of mechanic, Engineering solution
Chang-Woo Han
[Regular member]• Aug. 2010 : Kyungpook National Univ., Dept. of Mechanical Engineering, Ph.D.
• Sep. 2001 ~ current : Division of Automobiles, Yeungnam College of Science & Technology
<Research Interests>
Mechanical engineering, Automotive control system, Stability analysis and diagnosis, Sensor and its applications, Hybrid car and EV
Jae-Yong Son
[Regular member]• Aug. 2004 : Kyungpook National Univ., Dept. of Bio-Industrial Machinery Engineering, Ph.D.
• 1992 ~ current : National Academy of Agricultural Science, Dept. of Agricultural Engineering, Senior Researcher
<Research Interests>
Mechanical Engineering, Mechatronics, Washing &
Sterilizing research
Young-Moon Lee
[Regular member]• Aug. 1988 : Pusan National Univ., Dept. of Mechanical Engineering, Ph.D.
• Apr. 1976 ~ current : Kyungpook National University, School of Mechanical Engineering, Professor
<Research Interests>
Mechanics of metal cutting and grinding, Tool wear and tool fracture