A Study on the Reduction of Waiting Time and
Moving Distance through Optimal Allocation of
Service Space in a Health Examination Center
Suk-Tae Kim1*, Sung-Jin Oh2
1Dept. of Interior Architecture, Inje University
2Dept. of Interior Design, Kyungnam College of Information & Technology
건강검진센터의 공간서비스 적정할당을 통한 대기시간 및
이동거리 단축에 관한 연구
김석태1*, 오성진2
1인제대학교 공과대학 실내건축학과, 2경남정보대학교 인테리어디자인과
Abstract Recently, health examination centers have been changing from auxiliary medical facilities to key and independent medical facilities. However, it is not easy to improve medical facilities, including health examination centers, due to the variable characteristics of the relationship between humans and space. Therefore, this study was done to develop a pedestrian-based discrete event simulation analysis program to examine the problems and develop methods for improvement. The program was developed to analyze five evaluation indices and the density of examinees. The problems were derived by analyzing the required time, capacity, and queue size for each examination through simulations. We reduced the examination time and moving distance, increased the capacity, and distributed the queues by adjusting the medical services and relocating the examination rooms. The results were then quantitatively verified by simulations.
요 약 최근 건강검진센터는 병원의 보조시설에서 핵심적이고 독립적인 의료시설로 위상이 높아지고 있다. 그러나 검진 센터를 비롯한 의료시설들은 공간 및 인간간의 관계가 주체가 되는 가변적 특성으로 인하여 개선이 쉽지 않다. 이에 검진센터의 문제점과 및 개선방법을 발견하기 위하여 보행자 기반 이산사건시뮬레이션 분석프로그램을 개발하고자 하 였다. 프로그램은 5가지 평가지표와 수검자 밀도를 분석할 수 있도록 구축하였으며, 시뮬레이션을 통해 소요시간, 수용 능력, 검사항목별 대기열 규모를 분석하여 문제점을 도출하였다. 제안된 평가방법을 통해 검사시간이 길어지는 가장 큰 원인은 대기열의 증가와 집중에 의한 장시간 대기자의 발생으로 밝혀졌다. 적정한 서비스 재배분으로 대기열을 분산 시켜 검사시간을 크게 단축시킬 수 있었으며 조정안의 검증 결과, 수검인원 18% 증가, 1인당 수검시간 15% 단축, 이동 거리 5.5% 단축의 효과를 정량적으로 계산해 낼 수 있었다. 또한 히트맵 분석과 병행한 공간 재배치 계획으로 복도의 교차부에 집중되었던 과밀현상을 해소할 수 있었으며, 이는 통행자와 대기자간의 혼잡을 줄이는 긍정적 효과를 가져올 것이다. 본 연구는 분석프로그램을 구축하기 위한 기초적 성격을 가진 알고리즘 중심의 검토연구이지만, 이러한 복잡계 시뮬레이션 분석방법론은 운영 중인 시스템을 중단시키지 않으면서도 저비용의 최적 대안을 도출하는 도구로서 충분한 활용가치를 가질 수 있을 것으로 기대하고 있다.
Keywords : DES, Medical Facility, ABM, Health Examination Center, Spatial Configuration This work was supported by the National Research Foundation of Korea Grant funded by the Korean Government (NRF-2017S1A5B8066096)
*Corresponding Author : Suk-Tae Kim(Inje Univ.) email: [email protected]
Received October 2, 2019 Revised December 2, 2019 Accepted December 6, 2019 Published December 31, 2019
1. Introduction
As the concept of medical care has shifted from treatment to proactive management, the health examination center has become an important function of medical care. Unlike other hospital functions, such as the outpatient department, the health examination center has a consistent structure that performs fixed procedures for predetermined examination courses. In addition, since the examination fees are somewhat generalized with fewer variables, and are less influenced by medical technology, the facility is highly influenced by the environment with respect to various qualitative service factors[1].
Therefore, improving services in the spatial and environmental aspects can be an effective way to improve the quality of health examination centers.
Unlike general service facilities, medical facilities are often perceived as unpleasant places where people visit or stay in negative situations.
Therefore, improving spatial awareness and reducing the examination time are very important. Since the proper allocation and arrangement of services through the efficient use of limited space can reduce the moving distance and waiting time of the examinees, research on the relationship between space and users is very important.
The health and medical treatment sector has faced pressure over the past half-century to provide quality services despite rising costs, low returns, and various regulations. Under these circumstances, discrete event simulation has received the spotlight as an effective decision-making tool to improve patient satisfaction by improving the flow of patients and minimizing management costs by the optimal allocation of limited medical resources. In addition, as more sophisticated discrete event simulation software packages have become available to analyze more complex situations, decision-makers now have the
opportunity to quickly determine and configure an integrated system for complex situations.[2]
Therefore, this study derived the spatial efficiency and problems corresponding to the standard examination program by applying discrete event simulation to an examination center and explored ways to improve the examination service by adjusting the facilities and supplementing the services (manpower).
2. Medical service & simulation analysis
2.1 Optimizing resource allocation for rational
medical facility operations
In hospitals, numerous functions including the various medical departments, and designated spaces with special purposes such as the treatment room, surgery department, delivery department, examination center, and emergency center, and the administration and support management department are organically related to the single purpose of treatment and prevention. Because each examination and treatment room of a hospital is highly purpose-oriented and interactive, complex traffic lines are formed according to the various purposes of the visitors.
Moreover, a medical institution is a pure service system that assumes the participation of humans such as doctors, nurses, and patients.
However, the design, control, or improvement is not easy due to the variable nature of human participation. Furthermore, medical examinations depend on a variety of subjective factors, and vary according to the services and processes that are supported for the patients. This variability leads to longer waiting times and lower throughput.[3]
Recently, various complex system simulations such as system dynamics and discrete event simulation have been developed as methods to analyze computerized complex systems and are
being applied in various fields including the economy, city, military, environment, medical care, industry, and traffic.
Discrete event simulation (DES) started to receive the spotlight as an analytical method to analyze the inherent complexity of medical systems and has proven to be an effective tool for improving medical processes.[4]
In particular, discrete event simulation has a significant effect on Total Quality Management (TQM) or Continuous Quality Improvement (CQI) technologies. For example, various studies have been performed to improve the service quality of emergency rooms which are temporarily visited by thousands of patients.[5]
2.2 Agent-based model and discrete event
simulation
Simulations allow us to discover new methods and procedures by examining data flows and errors without interrupting the operation of the actual system. Moreover, new conceptual simulation models are constantly being developed as we can explore solutions through simulating various problems.[6]
Furthermore, the simulation technique can discover and search intuitive patterns of crowd behavior that cannot be explained by a simple aggregation of individual movements, and can be applied to solve issues that are otherwise difficult to predict with experience and common sense.[7]
System dynamics and discrete event simulation are typical computer simulation analysis technologies for analyzing complex systems, and the essential difference is that the former is deterministic while the latter is stochastic. System dynamics are mainly used for qualitative assessment and approach causal relationships by structuring diagrams in order to gain insight on the interrelationships of different systems at a higher strategic level.[8]
On the other hand, discrete event simulation is
a method of modeling system operation with a discrete sequence of time. Each event occurs at a specific moment and the changes are monitored in the required system. As discrete event simulation assumes that no changes occur between consecutive events, we can jump directly from one event to the next event according to time.[6]
This study applied the pedestrian-based simulation as the discrete event simulation.
Unlike network-based simulations, where the agents move along a series of single tracks similar to a factory conveyor, the pedestrian-based simulation assumes a more flexible scenario, such as driveways with a certain area. Therefore, the autonomy of the agents such as overtaking or avoiding can play a more significant role.
3. Simulation Environment
Configuration
3.1 Setting the required rooms and
examination procedure
Although there are various examination programs and different operating methods depending on the examination center, many examination centers abandon systematic examination procedures for the purpose of accommodating as many examinees as possible.
However, since non-systematic examination procedures can create discomfort for examinees and lead to distorted examination results, systematization and compliance of standard examination procedures are essential.
In order to systemize the examination program, we need to determine the examination items, examination time by each item, and the examination order. This study set the items of the National Basic Examination, which accounts for the largest portion of the examination programs in Korea, as the standard examination
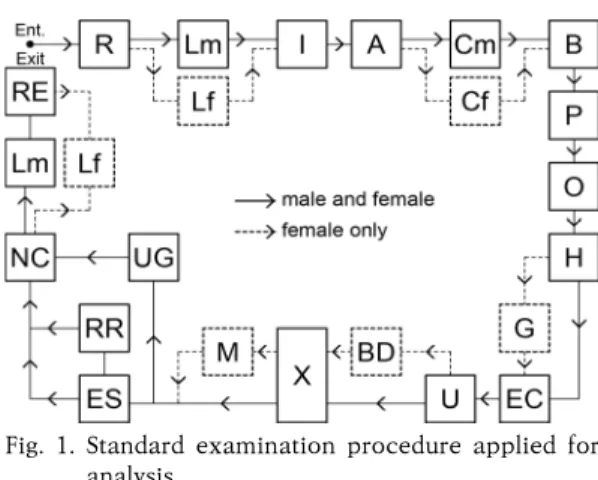
test items. The examination procedure was based on the examination order as designated by the Korean Association of Health Promotion and the study by Song Seung-eon[9] to develop a workflow as shown in Fig. 1 below.
Fig. 1. Standard examination procedure applied for analysis
Although there are only a few studies on examination time, this study set the number of services and the examination time as shown in Table 1 by combining the research of Jeong Ji-hee[10]
and Han Seung-woo[1], information from the Internet, and field surveys of examination centers.
Code Serv Description Min Max
R 3 Reception 2.0 3.0
Lm 20 Locker room (male) 5.0 10.0
Lf 20 Locker room (female) 8.0 14 I 3 Medical examination by Interview 2.0 3.0 A 1 Anthropometric Measurement 2.0 3.0 Cm 1 Collection of urine (male) 1.0 1.5 Cf 1 Collection of urine (female) 2.0 3.0
B 1 Blood Gathering 1.0 1.5
P 1 Pulmonary Function Test 2.5 3.5
O 1 Ophthalmology 3.0 5.0
H 1 Hearing Test 2.0 3.0
G 1 Gynecology 3.0 7.0
EC 1 Electrocardiogram 2.4 4.0
U 3 Ultrasound 8.0 12.0
BD 1 Bone Density 3.0 5.0
X 1 X-ray 2.0 3.0
M 1 Mammography 4.0 6.0
ES 2 Endoscope 5.0 10.0
RR 1 Recovery Room 25.0 35.0
UG 1 Upper Gastrointestinography 8.0 12.0 NC 1 Nutrition Consultation 2.0 3.0
RE 2 Result explanation 2.0 3.0
Table 1. The number of services and required time by each examination
The standard examination programs for women and men consist of different items which lead to different examination paths. Therefore, this study divides the examination route by gender, and the gender ratio of the examinees was set to 54.128% for men and 45.872% for women based on the National Health Insurance Service’s 2015 National Health Screening Statistical Yearbook.
Since all of the examinees are administered examinations on an empty stomach, they visit the center early in the morning and finish the examinations later that morning. Therefore, pure examination work, excluding the preparation and analysis work of the examination center, should be completed within 5 hours (18,000 seconds) from 7 am to 1 pm, which can be considered as the effective examination time.
As the endoscopy and upper gastrointestinal examination series are optional, this study assumed that 80% of the examinees received gastroscopy and the remaining 20% received the upper gastrointestinal series. This study also configured that 1 out of 4 examinees selected conscious sedation endoscopy, which requires an additional 30 minutes of examination time because these examinees must be admitted to the recovery room.
In addition, we configured that the examinees visited the examination center at intervals of 1~2 minutes after the start of the examination work.
3.2 Setting the example space and
evaluation indices
The example space that was set as the space to be analyzed is the Y examination center in Seoul, Korea. The area of the facility is 1421.2㎡
including the administrative office, and the public area including the lobby and hallway is 464㎡.
This facility has a separate area for the examination center, in which all of the basic
examination items, except for some examination items of the selective health examinations with a low frequency of administration, can be performed on one floor within the center. The structural characteristics of the space is a ring-shaped structure where the examinees start from the reception area (lobby) and receive examinations following the corridor and return to the opposite side of the lobby.
Evaluation indices related to service time and moving distance are required to identify the service performance (limits) and problems of the space and to derive improvement plans. This study used 5 indices for the evaluation including the examination time per person (eT), the number of waiting people (q), the time required for examination work (tT), capacity (p), and moving distance (d).
The examination time per person (eT) was calculated by recording the time whenever an agent occurred in the simulation space as a variable and subtracting it from the time when the examination procedure was completed. That is, the lifetime of the agent in the simulation space becomes the examination time, and the sum of all of the examination times divided by the number of examinees becomes the examination time per person (eT).
During the examination process according to the workflow, a queue occurs when the examination room lacks service processing capability. Extracting this queue by each examination item (examination room) becomes the number of waiting people (qE). By plotting this data, we can easily find the cause of the delay in time required for examination work (tT).
The time that is actually required for the examination work is measured from the time when the first examinee (agent) is generated to the time when the last examinee completes the examination. This is defined as the time required for examination work (tT), and the center can accommodate more people by saving this time.
Therefore, the number of examinees who complete the examination within 18,000 seconds (effective examination time) becomes the effective capacity (p), which can be used as an index to measure the capacity of the space. All of the indices above were calculated by building analysis simulations on the Anylogic[12] platform.
4. Simulation analysis
4.1 Plan-org analysis
The analysis was performed by configuring 2 cases: Plan-org (currently operating plan and services) and Plan-imp (the final plan that adjusted the actual layout based on the relationship between the adjusted number of services and the examination items).
Assuming that Plan-org accommodates 100 examinees, the time required for examination work (tT) was 31,433.4 seconds, and the average examination time per person was 3 hours 47 minutes 50 seconds (13,670.44 seconds). The reason for the longer examination time is attributed to the extended waiting time that is caused when too many people wait for a specific examination, which significantly affects the total required time. The length of the moving line according to the layout of examination rooms also has an influence on the total required time.
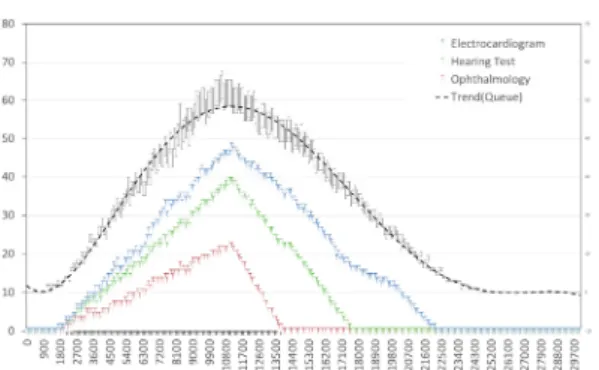
As a result of plotting a graph of the number of examinees waiting by examination item to identify the cause of the increase in examination time as shown in Fig. 2, long queues occur in the order of the anthropometric measurement (A), ophthalmology (qO), and the pulmonary function test (qP). In terms of anthropometric measurement (A), which is the first examination where a queue occurs, a queue with a maximum of 44 people lasts between 7,800~11,600 seconds (top 10%). In the case of ophthalmology (O), the number of people waiting increases up to 24 people between 17,900~21,300 seconds.
Therefore, the waiting time in this area has been found to be the main reason for the increase in the total examination time. This problem is due to the concentration of pedestrian density in the anthropometric measurement (A), ophthalmology (O), and the pulmonary function test (P) areas, which results in congestions. In terms of applying the standard examination system, we estimate that Plan-org can accommodate up to 50 people within 18,000 seconds.
Fig. 2. Changes in the number of people waiting for each examination (Plan-org)
4.2 Adjusting the number of services and
measuring the improvement
In order to reduce the waiting time, the simulation result after adding 1 additional service of anthropometric measurement (A), which has the largest queue, showed that the time required for examination work (tT) was 30,951.00 seconds.
This reflected an increase of 1.10% compared to the previous 30,611.70 seconds. Moreover, there was also a side effect in which the queue of 40 people waiting for anthropometric measurement (A) led to a queue of 50 people waiting for blood gathering (B), showing no effect of resolving congestions due to the addition of administered services.
As a result of analysis after adding 1 additional service of blood gathering (B), there was almost no reduction effect (30,857.4 seconds, +0.8%), and sequential congestion occurred as the queue of the pulmonary function test (P) increased to
over 60 people again. This results in a further increase of 5.4% to 32,357.7 seconds even after adding a service to the pulmonary function test (P), which is the next procedure.
Finally, adding 1 additional service to ophthalmology (O) resulted in a significant reduction effect of –15.01% to 26,616.6 seconds.
In order to obtain an effective reduction effect in the examination time and the maximum queue, we need to add a total of 4 services (manpower and space), one for each of A, B, P, and O as shown in Table 2.
tT eT
Avg Min Max
Current 30,611.70 13,987.93 4,116.12 22,049.30 A+ 30,951.00 13,114.27 4,487.11 22,061.28 A+B+ 30,857.40 13,228.99 4,919.49 22,179.56 A+B+P+ 32,357.70 14,013.33 4,955.58 23,565.68 A+B+P+O+ 26,616.60 11.422.89 4,649.69 18,124.53 Table 2. Time required for examination work by
adjusting the number of services (tT)
Fig. 3 shows a graph of the distribution of queues for 100 people after adjusting the services, in which the queue of more than 40 people concentrated in anthropometric measurement (A) was distributed similarly to a maximum of 22 people in the hearing test (H), 20 in electrocardiogram (EC), and 19 in ophthalmology (O).
Although Plan-org and Plan-imp show similar results with 97 and 94 people, respectively, as a result of adding up the total number of the people waiting, the number of people waiting for a long time and the total examination time were reduced because of the distribution effect. In addition, there were no queues in ultrasound (U) or endoscope (ES) where waiting lines were expected due to the relatively long service times.
In the case of reducing 1 service between the two, the tT increases significantly. Accordingly, the analysis shows that the optimal number (2 each) of services is already administered.
Fig. 3. Changes in the number of people waiting for each examination (Plan-imp)
In addition, there were no queues in the 3 locations of the medical examinations by interview (I). It is established that moving the medical examination by interview to the lobby (waiting space) and reducing the number of services by 2 does not affect the total examination time. Therefore, we can use the 3 rooms that were originally used for medical examination by interview for other examinations.
As a result, we can conclude that 2 more services (manpower) are needed, as 4 services were added and 2 were reduced.
5. Improved awareness and reduced
movement through spatial relocation
5.1 Examination room relocation
In order to improve procedural awareness and reduce the traffic line of the examination space, the functions of some examination rooms were relocated by exchanging them with each other.
The conditions of relocation are to absorb the increased number of services and to comply with the standard examination procedure as much as possible.
As the 3 locations of the medical examination by interview (I) currently have no queues, they were reduced to one location in the waiting space of the lobby. Since we added 1 additional
service of anthropometric measurement (A) and blood gathering (B), we moved blood gathering (B), which was installed in the same space as anthropometric measurement (A), to the electrocardiogram (EC) room and moved electrocardiogram (EC) to the newly acquired space, which was previously used for medical examination by interview (I). In addition, pulmonary function test (P) and ophthalmology (O) were each assigned to 2 rooms as the number of services increased, and were placed after the hearing test room according to the sequence of the examination procedure. Accordingly, the 3 locations that were previously designated for medical examination by interview were assigned to gynecology (G), electrocardiogram (EC), and ultrasound (U), respectively as shown Fig. 4.
Fig. 4. Examinee moving distance
5.2 Increased capacity and reduced
examination time per person
As shown in the previous analysis results, the 5-hour capacity of Plan-org was an average of 50 people, and the average examination time per person was 2 hours 43 minutes 59 seconds (9,838.98 sec, max: 14,213.69 sec ~ min: 4,920.42 sec). On the other hand, Plan-imp can accommodate 59 people, which is 18% more compared with Plan-org, and the average examination time per person was calculated to be 2 hours and 31 minutes (9,067.17 sec, max:
13,533.28 sec ~ min: 4,624.4 sec).
Ultimately, Plan-imp added 2 services in order to accommodate more people and the examination time per person was reduced by an average of 12 minutes 52 seconds (771.81 sec).
5.3 Reduced moving distance
In order to measure the moving distance, this study used a method from a previous study[13], in which the time required for the agent to source and sink is divided by the velocity. This is a method of storing the source order (ID) and duration of each agent with an ID in the dataset, and then dividing the duration of an agent by a fixed constant and converting it into the moving distance.
Table 3 shows that men move an average of 384.62 meters (max: 408.3m ~ min: 364.2m) while women move an average of 408.45 meters (max:
431.4m ~ min: 367.5m) in order to complete the examination series in the current facility (Plan-org).
Therefore, we can consider that the average traffic line of women’s examination is about 23.83 meters longer than the men’s traffic line.
In terms of Plan-imp, the moving distance of men was reduced by 27.05 meters (7.03%) to 357.57m (max: 377.40m ~ min: 339m) and the moving distance of women was reduced by 24.9 meters (6.78%) to 383.22m (max: 403.8m ~ min:
342.6m).
Plan-Org Plan-Imp variation(A-B) Male
Avg. 384.62 357.57 -27.05 7.03%
Min. 364.20 339.00 -25.2 6.92%
Max. 408.30 377.40 -30.9 7.57%
Female
Avg. 408.45 383.22 -25.23 6.18%
Min. 367.50 342.60 -24.9 6.78%
Max. 431.40 403.80 -27.6 6.40%
Overall
Avg. 391.64 370.23 -21.41 5.47%
Min. 336.00 318.90 -17.1 5.09%
Max. 435.30 418.20 -17.1 3.93%
Table 3. Examinee moving distance
6. Conclusion
This study searched for ways to optimize the services for space using discrete event simulation
and reached the following conclusions.
First, the main reason for the longer examination time is the increase of queues and the greater number of people waiting for a long period due to congestions. Therefore, it is important to distribute the concentrated queues by properly redistributing the services.
Second, the allocation of services and the relocation of space increased the capacity by 18%, reduced the examination time per person by 15%, and reduced the moving distance by 5.5%. However, as this process requires the addition of 2 services (manpower), the choice between cost and profit should be decided by management according to the operating circumstances of the examination center.
Third, spatial relocation resolved the congestions at the intersection of the corridors, which can reduce the inconvenience caused by the mix-up of pedestrians and waiting people.
This study was basic research to build an analysis program, which reviewed the functions and the possibility of the analysis program through each simulation. Although certain emergent behaviors occur in the analysis of a complex system, we recognize that errors may occur in each simulation. Therefore, we plan to perform follow-up studies to improve the reliability of the results through repeated simulations.
References
[1] S. T. Kim and S. C. Hong, “A Study on the Effective Health Examination Center Distribution and Space Coordination using Agent based Model”, Journal of Korea Institute of Healthcare Architecture, Vol24, No.2, pp.15-25. 2018.
DOI:http://dx.doi.org/10.15682/jkiha.2018.24.2.15 [2] S. H. Jacobson, S. N. Hall and J. R. Swisher,
Discrete-event simulation of health care systems. In Patient flow: Reducing delay in healthcare delivery. Springer US. pp.211-252. 2006.
[3] C. Duguay and F. Chetouane, “Modeling and improving emergency department systems using discrete event simulation”, Simulation, Vol.83, No.4,
pp.311-320, 2007.
DOI:http://dx.doi.org/10.1177/0037549707083111 [4] M. M. Günal and M. Pidd, “Discrete event simulation
for performance modelling in health care: a review of the literature”, Journal of Simulation, Vol.4, No.1, pp.42-51, 2010.
DOI:http://dx.doi.org/10.1057/jos.2009.25
[5] C. E. Saunders, P. K. Makens, and L. J. Leblanc.
“Modeling emergency department operations using advanced computer simulation systems”, Annals of Emergency Medicine, Vol.18, No.2, pp.134-140, 1989.
DOI:https://doi.org/10.1016/S0196-0644(89)80101-5 [6] P. Sharma, “Discrete-event simulation”, International
journal of scientific & technology research, Vol.4, No.4, pp.136-140, 2015.
[7] T. Osaragi, “Modeling of pedestrian behavior and its applications to spatial evaluation”, In Proceedings of the Third International Joint Conference on Autonomous Agents and Multiagent Systems, Vol.2, pp. 836-843, 2004. IEEE Computer Society.
[8] S. C. Brailsford, and N. A. Hilton, “A comparison of discrete event simulation and system dynamics for modelling health care systems”. 2001
[9] S. E. Song and S. T. Kim, “A Study on Traffic Line Efficiency of Health Examination Centers Based on Space Syntax : Focused on the Spatial Cognition of the Testee Taking the National Examination Program”, Journal of Institute of Healthcare Architecture, Vol.18, No.4, pp.53-67, 2012.
DOI : http://dx.doi.org/10.15682/jkiha.2012.18.4.053 [10] J. H. Jung, A Study on the Space Plan of a Health
Examination Center Based on Environmental Psychological Behavior, Master’s Thesis of Hanyang University, (2011)
[11] S. W. Han, A Study on the Spatial Composition &
Using Circulation of Health Promotion Center in General Hospital, Master’s Thesis of Hanyang University, (2008)
[12] Anylogic Official Homepage, Available From:
http://www.anylogic.com (accessed Jun 04, 2019) [13] S. T. Kim, “A Study on the Evaluation Method of
Movement Efficiency by Measuring Agent Moving Distance in ABS”, The 14th International Conference on Multimedia Information Technology and Applications, pp.130-131, 2018
Suk-Tae Kim [Life member]
• Feb 2000 : Kookmin Univ.
Dept. of Architecture (M.Arch)
• Aug 2008 : Hanyang Univ.
Dept. of Architecture engineering(Ph.D)
• Jan 1995 ~ Oct 1999 : Division of Planning, SAC International
• Nov 1999 ~ Oct 2001 : School of TED, Kookmin Univ. Contract Professor
• Sep 2001 ~ current : Inje Univ. Dept of Interior Architecture and Design, Professor
<Research Interests>
Environment Planning, Virtual Reality, Spatial Analysis
Sung-Jin Oh [Regular member]
• Feb 2002 : Kookmin Univ., Graduate School of TED, Dept. of Architecture (M.Arch)
• Mar 2002 ~ Aug 2004 : Division of Planning, 260 Architects
• Sep 2004 ~ Feb 2005 : Division of Planning, The Cube Architects
• Feb 2015 : Kookmin Univ., Dept. of Architecture (Ph.D)
• Mar 2005 ~ Current : Kyungnam College of Information & Technology, Dept of Interior Design, Associate Professor
<Research Interests>
Architecture Planning, Design Education Methodology, Complex System