ISSN 0378-6471 (Print)⋅ISSN 2092-9374 (Online)
https://doi.org/10.3341/jkos.2019.60.9.874
Original Article
정상 한국인 소아청소년의 망막신경섬유층 및 황반부 망막신경절세포층 두께
Retinal Nerve Fiber Layer and Macular Retinal Ganglion Cell Layer Thicknesses in Healthy Korean Children
김예지⋅황영훈
Yeji Kim, MD, Young Hoon Hwang, MD, PhD
건양대학교 의과대학 김안과병원 명곡안연구소
Myung-Gok Eye Research Institute, Kim’s Eye Hospital, Konyang University College of Medicine, Seoul, Korea
Purpose: To measure the thicknesses of the circumpapillary retinal nerve fiber layer (RNFL) and macular retinal ganglion cell-in- ner plexiform layer (GCIPL) by optical coherence tomography (OCT) in healthy Korean children and adolescents.
Methods: Circumpapillary RNFL and macular GCIPL thicknesses were measured by OCT in 352 healthy eyes of 352 children and adolescents (child-adolescent group) aged 5–17 years and in 159 healthy eyes of 159 adults (adult group) aged 18-75 years.
The difference in RNFL and GCIPL thicknesses between the groups and the effects of age and refractive errors on the measure- ments were evaluated.
Results: The mean age of the children and adults were 9.7 ± 3.6 and 44.7 ± 15.7 years, respectively. The mean of the average RNFL and GCIPL thicknesses were 103.1 ± 9.2 and 85.7 ± 4.6 µm, respectively, in the children group and 97.8 ± 8.2 and 82.9
± 4.4 µm, respectively, in the adult group. The child-adolescent group had greater RNFL and GCIPL thicknesses compared to the adult group in all areas (p < 0.05) with the exception of the RNFL thickness in the temporal quadrant (p = 0.555). A thinner RNFL and thinner GCIPL were significantly associated with older age and greater myopia (p < 0.001).
Conclusions: The mean RNFL and GCIPL thicknesses measured by OCT in the healthy eyes of children and adolescents were 103.1 and 85.7 µm, respectively. Children and adolescents had a thicker RNFL and GCIPL compared to adults.
J Korean Ophthalmol Soc 2019;60(9):874-880
Keywords: Age, Children, Optical coherence tomography, Retinal ganglion cell, Retinal nerve fiber layer
■Received: 2019. 3. 14. ■ Revised: 2019. 4. 21.
■Accepted: 2019. 8. 16.
■Address reprint requests to Young Hoon Hwang, MD, PhD Kim’s Eye Hospital, #136 Yeongsin-ro, Yeongdeungpo-gu, Seoul 07301, Korea
Tel: 82-2-2639-7777, Fax: 82-2-2633-3976 E-mail: [email protected]
*Conflicts of Interest: The authors have no conflicts to disclose.
ⓒ2019 The Korean Ophthalmological Society
This is an Open Access article distributed under the terms of the Creative Commons Attribution Non-Commercial License (http://creativecommons.org/licenses/by-nc/3.0/) which permits unrestricted non-commercial use, distribution, and reproduction in any medium, provided the original work is properly cited.
녹내장, 허혈시신경병증, 압박시신경병증, 유전시신경병 증 등의 여러 시신경병증을 평가할 때, 빛간섭단층촬영을 이용한 시신경유두주위 망막신경섬유층 및 황반부 망막신
경절세포층의 두께 측정이 중요한 정보를 제공한다. 특히, 소아에서는 검사 이해도 부족이나 협조 제한 때문에 시야 검사, 색각검사, 시력검사 같은 기능검사를 정확하게 시행 하기 어려운 경우가 있어 시신경 관련 구조물들을 정량적 으로 평가하는 것이 더욱 중요하다.1-3 빛간섭단층촬영은 장 비에 내장된 자료를 이용하여 검사 대상이 해당 연령에 비 해서 상대적으로 얼마나 더 두껍거나 얇은 구조를 가지고 있는지 색깔로 표시해주는데, 아직 소아의 검사 자료 참고 치에 관한 자료는 충분하지 않은 상황이다.4-14 특히, 우리나 라 소아의 정상 황반부 망막신경절세포층 두께에 대해서는 아직 자료가 부족하다.13,14 따라서 정상 소아에서 빛간섭단
층촬영으로 측정한 망막신경섬유층 및 황반부 망막신경절 세포층의 두께를 분석하는 것은 소아의 시신경병증을 평가 할 때 중요한 참고 자료가 될 것이다. 이번 연구에서는 빛 간섭단층촬영을 이용하여 정상 한국인 소아 및 청소년의 망막신경섬유층 및 황반부 망막신경절세포층의 두께를 분 석하고자 한다.
대상과 방법
이 연구는 기관윤리위원회(IRB)의 승인을 받은 후향적 자료 분석으로(승인 번호: 2017-10-008), 본원에 시력검사 를 위해 방문한 5세에서 17세의 어린이 및 청소년을 대상 으로 하였다. 검사 대상자들은 세극등현미경검사, 안저검 사, 비접촉성 안압계를 이용한 안압검사, 조절마비 굴절검 사를 받았고, 그 결과 교정시력이 0.7 이상이고, 전안부, 망 막 및 시신경유두에 특별한 이상이 없고, 굴절값이 구면렌 즈도수 ± 6디옵터, 난시도수 3디옵터 이내인 경우만 포함 했다. 검사 결과에서 안압이 21 mmHg 이상이거나, 시신경 유두 함몰비가 0.5 이상인 경우, 시신경테의 감소, 시신경 유두주위 출혈, 시신경유두 주위 망막신경섬유층 결손이 있는 경우, 이전에 안과 수술을 받은 적이 있는 경우는 제 외하였다. 두 눈이 모두 대상인 경우 한 눈의 자료를 무작 위로 골랐다.
빛간섭단층촬영은 Cirrus high-definition optical coherence tomography (Cirrus HD-OCT; Carl Zeiss Meditec, Dublin, CA, USA)를 이용하여 우선 검사자의 턱과 이마를 장비에 위치하고, 시신경유두 주변의 6 × 6-mm2 영역을 스캔하고, 이어서 황반부 주변의 6 × 6-mm2 영역을 스캔하였다. 시신 경유두주위 망막신경섬유층 및 황반부 망막신경절세포-내 망상층 두께는 장비에 내재되어 있는 프로그램이 자동으로 산출하여 전체 평균 및 각 영역의 두께를 표시하게 되는데 본 연구에서는 전체 평균 및 상측, 비측, 하측, 이측 사분면 망막신경섬유층 두께, 전체 평균 및 최소값, 상이측, 상측, 상비측, 하비측, 하측, 하이측 망막신경절세포층 두께를 분 석에 활용하였다. 또한 빛간섭단층촬영 장비가 자동으로 산출하는 시신경테 면적, 시신경유두 면적, 시신경유두 함 몰비, 시신경유두패임 부피도 자료로 활용하였다. 빛간섭단 층촬영 검사 결과, 신호 강도(범위 1-10)가 6 이하이거나, 망막신경섬유층 또는 망막신경절세포-내망상층 경계부 설 정에 오류가 있거나 검사 중 눈 움직임으로 인한 오류가 있 는 경우는 제외하였다.
소아 및 청소년의 정상 망막신경섬유층 및 황반부 망막 신경절세포층 두께 분포뿐만 아니라 나이에 따른 영향을 함께 분석하기 위해 본원에서 검사 받은 18세에서 75세 정
상 성인의 망막신경섬유층 및 황반부 망막신경절세포층 두 께 자료도 함께 분석하였다. 성인의 경우, 세극등현미경검 사, 안저검사, 골드만압평안압계를 이용한 안압검사, 현성 굴절검사를 시행했고, 그 결과 교정시력 0.7 이상, 굴절값 이 구면렌즈도수 ± 6디옵터, 난시도수 3디옵터 이내이고 망막과 시신경유두에 특별한 이상이 없는 경우를 대상으로 하였다. 안압이 21 mmHg 이상이거나, 시신경유두 함몰비 가 0.7 이상, 시신경테의 감소, 시신경유두 주위 출혈, 시신 경유두주위 망막신경섬유층 결손이 있는 경우, 이전에 안 과 수술을 받은 적이 있는 경우는 제외하였다. 나이에 따라 대상을 소아군(17세 이하)과 성인군(18세 이상)으로 나누었 고, 두 군 사이의 나이, 굴절값, 망막신경섬유층 및 황반부 망막신경절세포층 두께 차이를 independent t-test로 비교하였 다. 성별에 따른 빛간섭단층촬영 측정치의 차이를 independent t-test로 비교하였고, 나이, 굴절값, 시신경유두 면적이 망막 신경섬유층 및 황반부 망막신경절세포층 두께에 미치는 영 향을 알아보기 위해서 선형회귀분석을 시행하였다. p값이 0.05 미만인 경우, 유의한 것으로 판단하였고, 통계는 SPSS for Windows/Macintosh, Version 12.0 (IBM Corp., Armonk, NY, USA)을 이용하여 분석했다.
결 과
소아 및 청소년 352명의 352안(소아군), 성인 159명의 159안(성인군)이 포함되었다. 평균 연령은 소아군이 9.7 ± 3.6세(범위, 5-17), 성인군이 44.7 ± 15.7세(범위, 18-75)였고, 여자:남자 성별 비율은 소아군이 204:148, 성인군이 101:58이 었다. 구면대응치로 계산한 평균 굴절값은 소아군 -1.22 ± 1.99디옵터(범위, -6.13 to 3.38), 성인군 -1.29 ± 2.14디옵터 (범위, -6.50 to 2.25)였다. 두 군 사이에 나이(p<0.01) 외에 다른 값들은 유의한 차이를 보이지 않았다(p>0.05, Table 1).
빛간섭단층촬영으로 측정한 평균 시신경테면적, 시신경유 두면적, 시신경유두함몰비, 시신경유두패임부피는 소아군 에서 1.51 ± 0.27 mm2, 2.07 ± 0.39 mm2, 0.47 ± 0.16 mm3, 0.163 ± 0.148 mm3, 성인군에서 1.23 ± 0.23 mm2, 2.16 ± 0.46 mm2, 0.62 ± 0.13 mm3, 0.340 ± 0.231 mm3로 시신경 유두면적(p=0.070)을 제외한 나머지 변수는 유의한 차이를 보였다(p<0.001).
시신경유두주위 망막신경섬유층 두께는 소아군이 평균 103.1 ± 9.2 µm, 성인군이 97.8 ± 8.2 µm로 소아군이 성인 군보다 더 두꺼웠다(p<0.001, Table 2). 사분면 두께를 비교 했을 때, 상측, 비측, 하측은 소아군이 성인군보다 더 두꺼 웠지만(p<0.05), 이측에서는 유의한 차이를 보이지 않았다 (p=0.555). 황반부 망막신경절세포층 두께의 경우, 전체 평
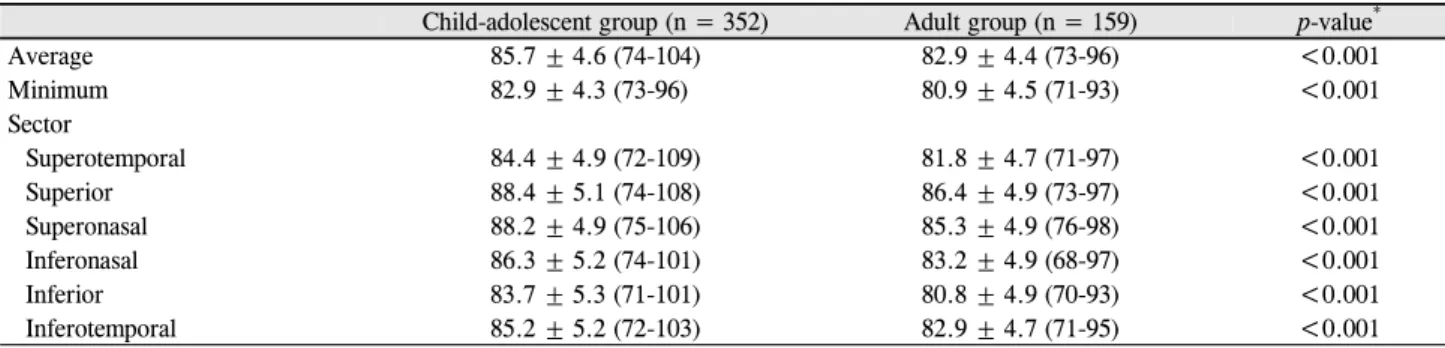
Child-adolescent group (n = 352) Adult group (n = 159) p-value*
Age (years) 9.7 ± 3.6 (5 to 17) 44.7 ± 15.7 (18 to 75) <0.001
Female:male (n) 204:148 101:58 0.244†
Refractive error (diopter) -1.22 ± 1.99 (-6.13 to 3.38) -1.29 ± 2.14 (-6.50 to 2.25) 0.673 Data are presented as mean ± standard deviation (range) unless otherwise indicated.
*Independent t-test; †Fisher’s exact test.
Table 1. Characteristics of subjects
Child-adolescent group (n = 352) Adult group (n = 159) p-value*
Average 103.1 ± 9.2 (85-136) 97.8 ± 8.2 (80-123) <0.001
Quadrant
Superior 132.0 ± 15.6 (95-190) 122.0 ± 14.8 (92-177) <0.001
Nasal 69.3 ± 11.1 (45-113) 66.9 ± 9.9 (45-95) 0.022
Inferior 133.2 ± 17.0 (86-192) 126.0 ± 16.9 (74-176) <0.001
Temporal 77.9 ± 11.9 (49-121) 77.2 ± 11.7 (56-118) 0.555
Data are presented as mean ± standard deviation (range).
*Independent t-test.
Table 2. Distribution of circumpapillary retinal nerve fiber layer thickness (μm) as measured by optical coherence tomography in
child-adolescent and adult groupsChild-adolescent group (n = 352) Adult group (n = 159) p-value*
Average 85.7 ± 4.6 (74-104) 82.9 ± 4.4 (73-96) <0.001
Minimum 82.9 ± 4.3 (73-96) 80.9 ± 4.5 (71-93) <0.001
Sector
Superotemporal 84.4 ± 4.9 (72-109) 81.8 ± 4.7 (71-97) <0.001
Superior 88.4 ± 5.1 (74-108) 86.4 ± 4.9 (73-97) <0.001
Superonasal 88.2 ± 4.9 (75-106) 85.3 ± 4.9 (76-98) <0.001
Inferonasal 86.3 ± 5.2 (74-101) 83.2 ± 4.9 (68-97) <0.001
Inferior 83.7 ± 5.3 (71-101) 80.8 ± 4.9 (70-93) <0.001
Inferotemporal 85.2 ± 5.2 (72-103) 82.9 ± 4.7 (71-95) <0.001
Data are presented as mean ± standard deviation (range).
*Independent t-test.
Table 3. Distribution of macular ganglion cell-inner plexiform layer thickness (μm) as measured by optical coherence tomography in
child-adolescent and adult groups균은 소아군이 85.7 ± 4.6 µm, 성인군이 82.9 ± 4.4 µm로 소 아군이 유의하게 더 두꺼운 양상을 보였다(p<0.001, Table 3).
최소값, 상이측, 상측, 상비측, 하비측, 하측, 하이측 망막신 경절세포층 두께도 모두 소아군이 성인군보다 더 두껍게 나타났다(p<0.001). 모든 빛간섭단층촬영 측정치는 성별에 따라 유의한 차이를 보이지 않았다(p>0.05).
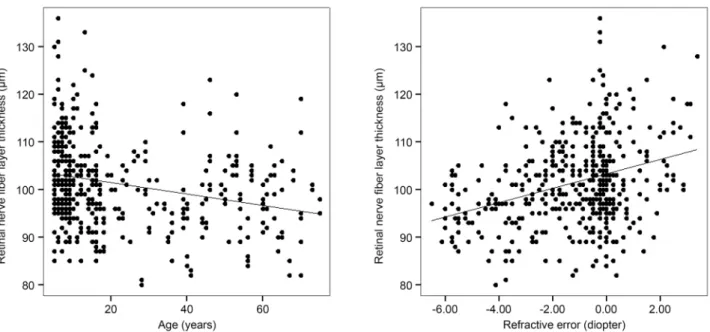
선형회귀분석 결과에 의하면, 전체 망막신경섬유층 두께는 나이가 많을수록(r=-0.243, r2=0.059, p<0.001), 근시가 심할 수록(r=0.332, r2=0.111, p<0.001) 얇았고(Fig. 1), 전체 망막 신경절세포층 두께도 나이가 많을수록(r=-0.238, r2=0.057, p<0.001), 근시가 심할수록(r=0.308, r2=0.095, p<0.001) 더 얇았다(Fig. 2). 나이와 굴절값을 모두 고려한 다변량 선형회 귀분석에서도 전체 망막신경섬유층 두께는 나이(ß=-0.273,
p<0.001), 굴절값(ß=0.356, p<0.001) 모두 관련 있었고(r=0.430, r2=0.185, p<0.001), 전체 망막신경절세포층 두께도 나이 (ß=-0.266, p<0.001)와 굴절값(ß=0.331, p<0.001) 모두 관련 있었다(r=0.406, r2=0.165, p<0.001). 빛간섭단층촬영 측정 치들 사이의 상관관계 분석에서는 망막신경섬유층이 두꺼울 수록 망막신경절세포층이 두껍게 나타났다(r=0.547, r2=0.298, p<0.001). 또한, 시신경유두 면적이 클수록 망막신경섬유층 이 두껍고(r=0.316, r2=0.100, p<0.001), 망막신경절세포층 도 두꺼운 것으로 나타났다(r=0.243, r2=0.059, p<0.001).
소아군만 대상으로 영향 요인을 추가로 분석한 결과, 전 체 망막신경섬유층 두께는 나이(ß=-0.024, p=0.646)와는 유 의한 관계를 보이지 않았고, 굴절값(ß=0.389, p<0.001)은 유의한 관계를 보였다(r=0.397, r2=0.158, p<0.001). 전체 망
Figure 1. Scatter plot presenting the correlation between average retinal nerve fiber layer thickness and age (left) and refractive error
(right). Older age and higher myopia were associated with thinner retinal nerve fiber layer.Figure 2. Scatter plot presenting the correlation between average macular ganglion cell-inner plexiform layer thickness and age (left)
and refractive error (right). Older age and higher myopia were associated with thinner macular ganglion cell-inner plexiform layer.막신경절세포층 두께의 경우, 나이(ß=-0.151, p=0.004)와 굴 절값(ß=0.309, p<0.001) 모두 관련 있었다(r=0.387, r2=0.149, p<0.001). 소아군에서도 망막신경섬유층이 두꺼울수록 망막 신경절세포층이 두껍게 나타났고(r=0.547, r2=0.297, p<0.001), 시신경유두 면적이 클수록 망막신경섬유층이 두껍고(r=0.373, r2=0.139, p<0.001), 망막신경절세포층도 두꺼운 것으로 나 타났다(r=0.254, r2=0.065, p<0.001).
고 찰
본 연구 결과에 의하면 건강한 한국인 소아청소년에서 빛간섭단층촬영으로 측정한 평균 망막신경섬유층 및 망막 신경절세포층 두께는 103.1 µm와 85.7 µm였고, 성인보다 더 두꺼운 분포를 보였다. 망막신경섬유층 및 망막신경절세포 층 두께는 근시가 심할수록, 나이가 많을수록 더 얇았다.
정상 소아청소년의 스텍트럼영역 빛간섭단층촬영을 이 용한 망막신경섬유층에 관해서는 다양한 장비와 인종을 대 상으로 하는 연구 결과들이 보고되었다.4-10 본 연구와 같은 Cirrus HD-OCT (Carl Zeiss Meditec)를 이용한 연구를 보 면, 4세에서 17세(평균 나이 9.6세)의 스페인의 정상 소아 청소년을 대상으로 측정한 평균 망막신경섬유층 두께는 97.4 µm,4 6세에서 13세(평균 나이 9.2세)의 스페인 정상 소아청소년을 대상으로 측정한 평균 망막신경섬유층 두께 는 98.5 µm,5 18세 미만(평균 나이 10.0세)의 인도의 정상 소아청소년을 대상으로 측정한 평균 망막신경섬유층 두께 는 93.5 µm,6 3세에서 18세의(평균 나이 9.5세) 싱가폴 정 상 소아청소년을 대상으로 측정한 평균 망막신경섬유층 두 께는 99.0 µm로7 본 연구 결과에서 나온 103.1 µm에 비해 서 상대적으로 얇은 양상을 보였다.
본 연구에서는 이전 연구들과 비슷한 나이와 굴절값, 그 리고 시신경유두 상태를 대상의 선정 기준으로 했다.4-6 예를 들어, 스페인 정상 소아청소년을 대상으로 한 연구의 경우, 평균 나이 9.2세, 시신경유두 면적 2.05 mm2, 시신경유두함 몰비 0.43으로 본 연구와 비슷했다.5 따라서 이번 연구에서 소아청소년의 망막신경섬유층이 다른 연구결과들보다 더 두꺼운 이유로 선정 기준의 차이나 측정 방법의 차이보다 는 실제로 한국인이 다른 인종보다 망막신경섬유층이 더 두꺼울 가능성을 우선 고려해야 하겠지만, 이는 다른 한국 인 대상을 통한 후속 연구를 통해서 확인이 필요할 것이다.
또한 대상 안 선택 과정에서 다른 연구들보다 상대적으로 망막신경섬유층이 두꺼운 눈이 더 많이 포함되었을 가능성 도 고려해볼 수 있을 것이다. 성인의 경우, 본 연구의 평균 망막신경섬유층 두께 97.8 µm는 정상 한국인을 대상으로 Cirrus HD-OCT (Carl Zeiss Meditec)를 이용하여 측정한 이전 연구들의 측정치인 97.6 µm,15 94.8 µm,16 98.3 µm17와 비슷했고, 다른 다양한 인종의 정상 성인 측정치인 92.9 µm,18 94.0 µm19에 비하면 더 두꺼운 경향을 보였다.
그 외에 6세에서 16세(평균 나이 10.5세) 터키의 정상 소 아청소년을 대상으로 Spectralis OCT (Heidelberg engineer- ing, Heidelberg, Germany)를 이용하여 측정한 평균 망막신 경섬유층 두께는 106.5 µm였고,8 5세에서 15세의 미국의 정상 소아청소년을 대상으로 Spectralis OCT (Heidelberg engineering)로 측정한 평균 망막신경섬유층 두께는 107.6 µm,9 RTVue-100 OCT (Optovue Inc., Fremont, CA, USA) 를 이용하여 4세에서 17세 사이(평균 나이 9.2세) 대만의 정 상 소아청소년을 대상으로 평가한 평균 망막신경섬유층 두 께는 109.4 µm였다.10 망막신경섬유층 두께는 장비마다 측 정치가 다른데, Lee and Hwang20이 같은 눈을 대상으로 여 러 장비를 이용하여 측정한 값을 비교한 연구에 의하면
Spectralis OCT (Heidelberg engineering)와 RTVue-100 OCT (Optovue Inc.)로 측정한 값이 Cirrus HD-OCT (Carl Zeiss Meditec) 측정치에 비해서 약 4.8 µm, 7.2 µm 정도 두꺼운 것으로 나타났다. 따라서 이러한 차이를 고려했을 때, 본 연구 결과에서 나온 평균 망막신경섬유층 두께 103.1 µm는 RTVue-100 OCT, Spectralis OCT (Heidelberg engineering) 로 측정한 연구 결과에 비해서 약간 더 큰 값이라고 유추해 볼 수 있을 것이다.
정상 소아청소년의 황반부 망막신경절세포층 두께에 관 해서는 아직 자료가 부족한데, Cirrus HD-OCT (Carl Zeiss Meditec)를 이용하여 3세부터 17세(평균 나이 9.6세) 정상 터키 소아청소년을 대상으로 시행한 연구 결과, 평균 망막 신경절세포층 두께는 83.4 μm였고, 위쪽 영역이 84.7 μm로 가장 두꺼웠고, 아래쪽 영역이 82.0 μm로 가장 얇았다.11 Cirrus HD-OCT (Carl Zeiss Meditec)를 이용하여 3세부터 18세(평균 나이 9.5세)의 정상 싱가폴 소아청소년을 대상으 로 시행한 연구에서는 평균 망막신경절세포층 두께가 82.6 μm, 위쪽 영역이 83.7 μm, 아래쪽 영역이 81.6 μm로 나타났다.7 국내 연구 중에서는 약시환자와 정상안을 비교한 연구에서 Cirrus HD-OCT (Carl Zeiss Meditec)를 이용하여 5세부터 19세의 한국 소아 중 약시가 없는 정상 소아 30명의 평균 망막신경절세포층 두께가 80.5 μm였고, 상비측 영역이 84.4 μm로 가장 두꺼웠고, 하측 영역이 79.4 μm로 가장 얇 았다.12 본 연구 결과에 의하면 정상 소아청소년의 평균 망 막신경절세포층 두께는 85.7 µm로 예전 연구 결과보다 더 두꺼운 경향을 보였다. 영역별 차이를 봤을 때는 상비측 영 역이 평균 88.2 μm로 가장 두꺼우며, 하측 영역이 83.7 μm 로 가장 얇은 분포를 보였는데 이는 기존의 연구 결과들과 일치하였다. 그 외에도 swept source-OCT (DRI OCT Triton®, Topcon, Japan)를 이용하여 3세부터 17세의 우리나라 소아 청소년을 대상으로 측정한 연구에서는 평균 망막신경절세 포층 두께가 71.5 μm,13 Spectralis OCT (Heidelberg en- gineering)를 이용하여 5세에서 17세의 우리나라 소아청소 년을 대상으로 한 연구에서는 평균 망막신경절세포층 두께 가 약 75 μm였으나14 망막신경절세포층 두께는 장비마다 측정치가 다르고 아직 장비간 측정치 차이에 관해서 자료 가 부족하여 본 연구 결과와 비교하기에는 한계가 있다.
망막신경섬유층과 황반부 망막신경절세포층 두께는 나 이, 인종, 굴절값 등의 영향을 받는 것으로 알려져 있
다.16,17,19,21-27 예를 들면, 망막신경섬유층 두께는 나이가 많
을수록,16,17,19,22,23 근시가 심할수록,24,25 동양인보다 서양인 에서 더 얇은 것으로 알려져 있다.19,21,22 망막신경절세포 두 께도 나이가 많을수록,26,27 근시가 심할수록 얇은 것으로 보 고 되었다.26,27 본 연구에서도 나이가 많을수록, 근시가 심
할수록 망막신경섬유층과 망막신경절세포의 두께가 모두 감소하는 것으로 나타났다. 하지만 이전 연구 결과들과 마
찬가지로16,19 이측 사분면 망막신경섬유층의 경우, 나이에
따른 영향을 상대적으로 적게 받는 것으로 나타났다. 그 이 유로 실제로 이측 망막신경섬유층이 다른 영역에 비해서 나이에 따른 영향을 적게 받을 가능성, 상대적으로 이측의 망막신경섬유층이 다른 영역보다 얇아서 통계적으로 영향 이 적게 나타났을 가능성을 모두 고려해야 할 것이다. 소아 군만 따로 분석했을 때는 전체 대상을 분석했을 때와 달리 나이가 망막신경섬유층과 망막신경절세포층 두께에 미치 는 영향이 유의하지 않거나 상대적으로 적게 나타났다. 이 는 선행 연구들의 결과와 일치하는 것이다.4-11,13,14 그 이유 로 소아기에는 실제로 나이의 영향을 적게 받을 가능성, 소 아군의 나이의 폭이 전체 대상에 비해서 상대적으로 작기 때문에 통계적으로 영향이 적은 것으로 나타났을 가능성을 모두 생각해볼 수 있을 것이다.
예전 연구에 의하면 굴절값, 나이, 인종 외에 안축장 또 한 망막신경섬유층 및 황반부 망막신경절세포층 두께에 영 향을 주는 것으로 알려져 있다.19,24-27 하지만 이번 연구 대 상 중 소아군에서는 안축장의 정보가 부족한 경우가 많아 서 안축장의 영향은 분석하지 않았다. 이에 대해서는 향후 추가 연구가 필요할 것이다. 빛간섭단층촬영은 시신경유두 도 자동으로 분석하여 시신경유두 면적, 시신경테 면적, 시 신경유두 함몰비 등 여러 가지 지표를 제공하는데 이번 연 구에서는 시신경유두 지표 중 시신경유두 면적만 시신경유 두주위 망막신경섬유층과 황반부 망막신경절세포 두께의 영향 요인으로 분석하였다. 그 외의 정상 소아 및 청소년에 서 빛간섭단층촬영으로 측정한 시신경유두 지표와 관련된 내용은 향후 후속 연구를 통하여 분석할 계획이다. 본 연구 는 병원을 방문하여 검사 받은 사람만을 대상으로 하였기 때문에 이 결과가 우리 나라 전체 인구를 대표한다고 보기 에는 무리가 있다. 더군다나 아직 우리나라 소아청소년을 대상으로 한 망막신경섬유층과 황반부 신경절세포 두께에 관한 자료가 부족한 상황이라 이번 연구의 결과를 모든 소 아청소년에게 적용하기는 어려울 것이다. 그럼에도 불구하 고, 본 연구 결과는 소아 및 청소년의 시신경병증을 평가할 때 유용한 참고 자료가 될 것이라 생각한다. 특히, 이전 연 구들의 경우 성인이나 소아를 따로 분석하였기 때문에4-14 성인과 소아를 함께 비교한 연구 결과는 아직 부족한 상황 이다.14 향후 다른 기관을 방문한 대상군을 비롯하여 다양 한 지역사회의 소아청소년을 대상으로 하는 자료가 추가로 필요할 것이다.
요약하면 건강한 한국인 소아 및 청소년에서 빛간섭단층 촬영으로 측정한 시신경유두주위 망막신경섬유층 및 황반
부 망막신경절세포층 두께는 103.1 µm와 85.7 µm였다. 시 신경유두 주변 망막신경섬유층, 황반부 망막신경절세포층 은 나이가 많을수록, 근시가 심할수록 더 얇은 분포를 보였 다.
REFERENCES
1) Gospe SM, Bhatti MT, El-Dairi MA. Emerging applications of op- tical coherence tomography in pediatric optic neuropathies. Semin Pediatr Neurol 2017;24:135-42.
2) Lee H, Proudlock FA, Gottlob I. Pediatric optical coherence to- mography in clinical practice-recent progress. Invest Ophthalmol Vis Sci 2016;57:OCT69-79.
3) Srinivasan S, Addepalli UK, Rao HL, et al. Spectral domain optical coherence tomography in children operated for primary congenital glaucoma. Br J Ophthalmol 2014;98:162-5.
4) Barrio-Barrio J, Noval S, Galdós M, et al. Multicenter Spanish study of spectral-domain optical coherence tomography in normal children. Acta Ophthalmol 2013;91:e56-63.
5) Elía N, Pueyo V, Altemir I, et al. Normal reference ranges of optical coherence tomography parameters in childhood. Br J Ophthalmol 2012;96:665-70.
6) Rao A, Sahoo B, Kumar M, et al. Retinal nerve fiber layer thick- ness in children <18 years by spectral-domain optical coherence tomography. Semin Ophthalmol 2013;28:97-102.
7) Goh JP, Koh V, Chan YH, Ngo C. Macular ganglion cell and retinal nerve fiber layer thickness in children with refractive errors-an op- tical coherence tomography study. J Glaucoma 2017;26:619-25.
8) Turk A, Ceylan OM, Arici C, et al. Evaluation of the nerve fiber layer and macula in the eyes of healthy children using spectral-do- main optical coherence tomography. Am J Ophthalmol 2012;153:
552-9.e1.
9) Yanni SE, Wang J, Cheng CS, et al. Normative reference ranges for the retinal nerve fiber layer, macula, and retinal layer thicknesses in children. Am J Ophthalmol 2013;15:354-60.e1.
10) Tsai DC, Huang N, Hwu JJ, et al. Estimating retinal nerve fiber lay- er thickness in normal schoolchildren with spectral-domain optical coherence tomography. Jpn J Ophthalmol 2012;56:362-70.
11) Totan Y, Gürağaç FB, Güler E. Evaluation of the retinal ganglion cell layer thickness in healthy Turkish children. J Glaucoma 2015;24:e103-8.
12) Park JM, Choi YJ, Kim DH. The analysis of peripapillary RNFL, macula and macular ganglion cell layer thickness in patients with monocular amblyopia using SD-OCT. J Korean Ophthalmol Soc 2016;57:98-105.
13) Lee YP, Ju YS, Choi DG. Ganglion cell-inner plexiform layer thickness by swept-source optical coherence tomography in healthy Korean children: normative data and biometric correlations. Sci Rep 2018;8:10605.
14) Yoo YJ, Hwang JM, Yang HK. Inner macular layer thickness by spectral domain optical coherence tomography in children and adults: a hospital-based study. Br J Ophthalmol 2019 Jan 12. doi:
10.1136/bjophthalmol-2018-312349. [Epub ahead of print].
15) Hong S, Kim SM, Park K, et al. Adjusted color probability codes for peripapillary retinal nerve fiber layer thickness in healthy
= 국문초록 =
정상 한국인 소아청소년의 망막신경섬유층 및 황반부 망막신경절세포층 두께
목적: 빛간섭단층촬영으로 측정한 정상 한국인 소아 및 청소년의 시신경유두주위 망막신경섬유층 및 황반부 망막신경절세포층 두께 를 알아보고자 한다.
대상과 방법: 빛간섭단층촬영을 이용하여 5세에서 17세의 소아 및 청소년(소아군) 352명의 건강한 352안과 18세에서 75세 성인(성인 군) 159명의 건강한 159안의 시신경유두주위 망막신경섬유층 및 황반부 망막신경절세포층의 두께를 측정하였다. 두 군 사이의 망막신 경섬유층 및 망막신경절세포층 두께 차이를 비교하고, 나이 및 굴절값이 두 측정치에 미치는 영향을 분석하였다.
결과: 소아군과 성인군의 평균 나이는 각각 9.7 ± 3.6세, 44.7 ± 15.7세였다. 평균 망막신경섬유층및 망막신경절세포층 두께는 소아군 이 103.1 ± 9.2 µm, 85.7 ± 4.6 µm였고, 성인군이 97.8 ± 8.2 µm, 82.9 ± 4.4 µm였다. 두 군의 망막신경섬유층 및 망막신경절세포층 두께를 비교했을 때, 이측 사분면의 망막신경섬유층 두께(p=0.555)를 제외한 다른 모든 영역에서 소아군이 성인군보다 두꺼운 양상을 보였다(p<0.05). 망막신경섬유층 및 망막신경절세포층은 근시가 심할수록, 나이가 많을수록 더 얇았다(p<0.001).
결론: 건강한 소아 및 청소년에서 빛간섭단층촬영으로 측정한 망막신경섬유층 및 망막신경절세포층 두께는 103.1 µm와 85.7 µm였고, 성인보다 더 두꺼운 분포를 보였다.
<대한안과학회지 2019;60(9):874-880>
김예지 / Yeji Kim
건양대학교 의과대학 김안과병원 명곡안연구소 Myung-Gok Eye Research Institute, Kim’s Eye Hospital, Konyang University
College of Medicine Koreans. BMC Ophthalmol 2014;14:38.
16) Lee JY, Hwang YH, Lee SM, Kim YY. Age and retinal nerve fiber layer thickness measured by spectral domain optical coherence tomography. Korean J Ophthalmol 2012;26:163-8.
17) Kim EJ, Hong S, Kim CY, et al. Attenuated age-related thinning of peripapillary retinal nerve fiber layer in long eyes. Korean J Ophthalmol 2011;25:248-51.
18) Mwanza JC, Durbin MK, Budenz DL; Cirrus OCT Normative Database Study Group. Interocular symmetry in peripapillary reti- nal nerve fiber layer thickness measured with the Cirrus HD-OCT in healthy eyes. Am J Ophthalmol 2011;151:514-21.e1.
19) Knight OJ, Girkin CA, Budenz DL, et al. Effect of race, age, and axial length on optic nerve head parameters and retinal nerve fiber layer thickness measured by Cirrus HD-OCT. Arch Ophthalmol 2012;130:312-8.
20) Lee YG, Hwang YH. A comparison of retinal nerve fiber layer thickness measured using five different optical coherence tomog- raphy devices. J Korean Ophthalmol Soc 2018;59:261-7.
21) Samarawickrama C, Wang JJ, Huynh SC, et al. Ethnic differences in optic nerve head and retinal nerve fibre layer thickness parame- ters in children. Br J Ophthalmol 2010;94:871-6.
22) Girkin CA, McGwin G Jr, Sinai MJ, et al. Variation in optic nerve
and macular structure with age and race with spectral-domain opti- cal coherence tomography. Ophthalmology 2011;118:2403-8.
23) Leung CK, Yu M, Weinreb RN, et al. Retinal nerve fiber layer imaging with spectral-domain optical coherence tomography: a prospective analysis of age-related loss. Ophthalmology 2012;119:
731-7.
24) Hwang YH, Yoo C, Kim YY. Myopic optic disc tilt and the charac- teristics of peripapillary retinal nerve fiber layer thickness meas- ured by spectral-domain optical coherence tomography. J Glaucoma 2012;21:260-5.
25) Kang SH, Hong SW, Im SK, et al. Effect of myopia on the thick- ness of the retinal nerve fiber layer measured by Cirrus HD optical coherence tomography. Invest Ophthalmol Vis Sci 2010;51:4075-83.
26) Mwanza JC, Durbin MK, Budenz DL, et al. Profile and predictors of normal ganglion cell-inner plexiform layer thickness measured with frequency-domain optical coherence tomography. Invest Ophthalmol Vis Sci 2011;52:7872-9.
27) Koh VT, Tham YC, Cheung CY, et al. Determinants of ganglion cell-inner plexiform layer thickness measured by high-definition optical coherence tomography. Invest Ophthalmol Vis Sci 2012;53:
5853-9.