D I A B E T E S & M E T A B O L I S M J O U R N A L
This is an Open Access article distributed under the terms of the Creative Commons Attribution Non-Commercial License (http://creativecommons.org/licenses/by-nc/4.0/) which permits unrestricted non-commercial use, distribution, and reproduction in any medium, provided the original work is properly cited.
Impact of Continuous Care on Health Outcomes and Cost for Type 2 Diabetes Mellitus: Analysis Using
National Health Insurance Cohort Database
Ji Hyun Nam1,*, Changwoo Lee2,*, Nayoung Kim3, Keun Young Park4, Jeonghoon Ha5, Jaemoon Yun6, Dong Wook Shin7, Euichul Shin1
1Department of Preventive Medicine, College of Medicine, The Catholic University of Korea, Seoul,
2School of Public Health, The Catholic University of Korea, Seoul,
3Korea Institute of Child Care and Education, Seoul,
4National Evidence-based Healthcare Collaborating Agency, Seoul,
5 Division of Endocrinology and Metabolism, Department of Internal Medicine, Seoul St. Mary’s Hospital, College of Medicine, The Catholic University of Korea, Seoul,
6Department of Family Medicine, Seoul National University College of Medicine, Seoul,
7Department of Family Medicine, Samsung Medical Center, Sungkyunkwan University School of Medicine, Seoul, Korea
Background: The objective of the study was to determine the impact of continuous care on health outcomes and cost of type 2 di- abetes mellitus (T2DM) in Korea.
Methods: A nationwide retrospective, observational case-control study was conducted. Continuity of treatment was measured using Continuity of Care (COC) score. Information of all patients newly diagnosed with T2DM in 2004 was retrieved from the National Health Insurance database for the period of 2002 to 2013. The study examined 2,373 patients after applying exclusion criteria, such as for patients who died from conditions not related to T2DM. Statistical analyses were performed using frequency distribution, simple analysis (t-test and chi-squared test), and multi-method analysis (simple linear regression, logistic regression, and survival analysis).
Results: The overall COC score was 0.83±0.24. The average incidence of diabetic complications was 0.39 per patient with a high- er COC score, whereas it was 0.49 per patient with a lower COC score. In both survival and logistic analyses, patients who had high COC score were significantly less likely to have diabetic complications (hazard ratio, 0.69; 95% confidence interval, 0.54 to 0.88). The average medical cost was approximately 3,496 United States dollar (USD) per patient for patients with a higher COC score, whereas it was 3,973 USD per patient for patients with a lower COC score during the 2006 to 2013 period, with a difference of around 477 USD, which is statistically significant after adjusting for other factors (β=–0.152).
Conclusion: Continuity of care for diabetes significantly reduced health complications and medical costs from patients with T2DM.
Keywords: Continuity of patient care; Diabetes complications; Diabetes mellitus, type 2
Corresponding author: Euichul Shin https://orcid.org/0000-0002-7953-021X Department of Preventive Medicine, College of Medicine, The Catholic University of Korea, 222 Banpo-daero, Seocho-gu, Seoul 06591, Korea
E-mail: [email protected]
INTRODUCTION
Diabetes is one of the most rapidly growing diseases in the world. The International Diabetes Federation has predicted
that every 10 seconds, three patients are diagnosed with diabe- tes [1], and its prevalence rate around the world was 6.6% in 2010 [2]. It is estimated that 415 million people, aged 20 to 79, would be diagnosed with diabetes in 2015, and approximately https://doi.org/10.4093/dmj.2018.0189
pISSN 2233-6079 · eISSN 2233-6087
5 million people died from it. Moreover, the number of people with diabetes would be expected to be 642 million by 2040 [3].
According to the American Diabetes Association, the direct expenditures on diabetes by the United States government amounted to 91.8 billion United States dollar (USD) in 2002, and 156 billion USD in 2010. It has been estimated that by 2020, 192 billion USD will be spent on diabetes. In 2002, the United States government’s total expenditures on health and medication were 865 billion USD; among others, 160 billion USD, equivalent to 18.5% of its total health expenditures, were used for diabetes. Health expenditures per capita in the United States were 2,560 USD in 2002, and this number will increase by 5-fold to 13,243 USD if the individual is a diabetes patient.
Moreover, if age, sex, and ethnicity are adjusted, the heath ex- penditures per capita will increase by 2.4 times [4].
In addition, a constant increase in medical expenditures due to complications of diabetes, proven in several studies [5-7], is also a public concern. Cost Of Diabetes in Europe-Type 2 (CODE-2) diabetes studies carried out in seven countries in Europe, including over 7,000 participants, have suggested that medical expenditures on complications of diabetes would in- crease 1.7 times for patients who develop microangiopathy, two times for patients with macroangiopathy, and 3.5 times for those who develop both types of complications [7].
Through continuous care, however, it is possible to prevent patients with diabetes from further development of the disease and reduce their medical expenses. Regardless of the type of care or treatment, continuous care of diabetes is important be- cause absence of treatment will eventually lead to hospitaliza- tion or a number of medical complications [8]. According to the Centers for Disease Control and Prevention, patients with diabetes are 1.5 to 1.8 times more likely to be hospitalized from heart disease or stroke than patients who do not have diabetes.
Cases of lower-extremity amputation due to diabetes have in- creased from 73,000 in 2010 to 108,000 in 2014 [9,10].
In the case of chronic diseases such as diabetes or hyperten- sion, because the duration of the illness is so long, there are many cases in which the patient frequently changes medical institutions, which distorts usage behavior of medical services by casting about for a better medical practitioner [11-13]. If a patient visits different medical institutions for the same dis- ease, it reduces continuity of care because patients need to be re-examined, requiring new physical examinations and labora- tory and radiological tests for the same symptoms.
The objective of this study, therefore, was to analyze the ef-
fect of Continuity of Care (COC) on health outcomes and health care costs for patients with type 2 diabetes mellitus (T2DM), using the Korean National Health Insurance data- base.
METHODS
This study uses data from the Korean National Health Insur- ance database gathered between 2002 and 2013. Information about one million people (2% of the whole population) was extracted from the nation’s health insurance claims data, in- cluding socioeconomic status, disability, death, and use of medical care institutions. Data about patients aged 20 years old or over who were newly diagnosed with T2DM in 2004 were collected for the study.
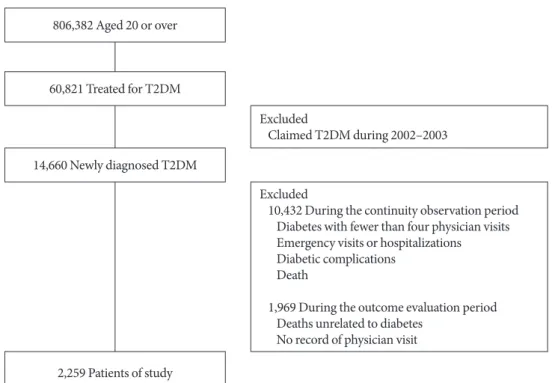
The observation period of the study is 10 years, consisting of two periods, the first one observing whether managing diabe- tes continuously for 2 years after initial diagnosis (continuity observation), and the following one observing the health out- come for 8 years thereafter (outcome evaluation). We excluded patients from the analysis who had fewer than four physician visits [14], had a record of emergency visits or hospital admis- sion during the continuous observation period, had diabetic complications, or died within the first 2 years of initial diagno- sis. In addition, patients who had no record of physician visits or who died for conditions not related to T2DM during the 8-year period were also excluded. In the end, the data from 2,259 patients in total were eligible for analysis (Fig. 1).
Measures and variables
Most Frequent Provider Continuity (MFPC), Modified Conti- nuity Index (MCI), and COC index have been used as mea- sures for continuous care [14-21]. We selected the COC index as the measure for continuity measure in this study. The COC index, developed by Bice and Boxerman [22], has all four char- acteristics for measurement of continuity defined by Shortell [23], which are (1) use of individuals as units of analysis, (2) the comparability of individuals using different numbers of providers, (3) the influence of total number of visits, and (4) referral patterns among providers. Therefore, it considers both the degree of concentration and dispersion of the medical pro- viders visited by patients and is appropriate for measures that do not require an assigned provider as in Korea. It has been ap- plied in a relatively large number of studies [24]. The values of the COC index range from 0 to 1, where 0 is when all physician
visits are distributed to different providers, and 1 is when all physician visits are concentrated at one provider. The calcula- tion formula is as follows.
(ni=# visit of medical provider I; M=# medical provider; N
=total # medical visit)
To evaluate health outcome, the occurrence of diabetic com- plications was measured. Diabetic complications can be cate- gorized by size of blood vessels involved in macro- and micro- vascular origins. Macrovascular complications affect the heart and large blood vessels and are probably the major cause of morbidity and mortality among diabetic patients. These are coronary artery disease, peripheral arterial disease, and stroke.
Complications of microvascular origin include diabetic reti- nopathy, nephropathy, and neuropathy [7,25].
We referred to the study by Park et al. [26] for the medical diagnosis codes of these complications. When the patients with T2DM had either micro- or macrovascular complications or both, we defined them as having diabetic complications.
For health care costs, we calculated total medical costs in- curred for T2DM during the outcome evaluation period. Di- rect, indirect, and intangible costs have been used to calculate medical costs [27], but we selected only direct costs as total
medical costs. Direct costs are defined as all costs directly oc- curred for medical services such as diagnosis, treatment, care, rehabilitation, and terminal care without including non-medi- cal costs such as transportation. We used health insurance claims data and added up all expenses related to T2DM claims.
The computation of medical expenses started at the end of the continuity evaluation period, and ended at the end of the study (December 31, 2013), so the period differs with each patient.
As control variables, we examined patients’ socioeconomic status, characteristics of disease and medical treatment, and features of medical institutions. Patients’ socioeconomic status, such as age, insurance type, and income quintile, were vari- ables that could be changed during the study period, so they were based on the time of the first diagnosis. The characteris- tics of the medical institutions, such as types, ownership, num- ber of beds, and number of physicians, were based on the most visited medical institutions during the continuity observation period. According to previous studies [28-30], the most visited medical institution was defined as the main medical institution during the continuity observation period. However, if there were medical institutions that had identical frequencies of vis- its in the same year, the most recently visited medical institu- tion was defined as the main one.
Fig. 1. Selection process of study subjects. T2DM, type 2 diabetes mellitus.
806,382 Aged 20 or over
60,821 Treated for T2DM
Excluded
Claimed T2DM during 2002–2003
Excluded
10,432 During the continuity observation period Diabetes with fewer than four physician visits Emergency visits or hospitalizations Diabetic complications
Death
1,969 During the outcome evaluation period Deaths unrelated to diabetes
No record of physician visit 14,660 Newly diagnosed T2DM
2,259 Patients of study
Statistical analysis
Multivariate analysis was performed to examine the impact of continuous care on the occurrence of diabetic complications and medical costs. The Cox proportional hazards regression model was fitted to examine the hazard ratios (HRs) between continuous care and health complications of T2DM after ad- justing other factors. In addition, the multivariate logistic anal- ysis was performed to confirm the robustness of the obtained results.
The adjusted confounding factors included patients’ charac- teristics, such as age, gender, health security type, income level, disease characteristics (hypoglycemic agents, Charlson comor- bidity score), and institutional characteristics, such as types of health care providers, ownership, geographical location, num- ber of physicians, and number of beds. Types of health security are categorized into two types: National Health Insurance and Medical Aid. Types of health care providers were categorized into three types: general hospital, hospital, and clinic. Institu- tional ownership was divided into three categories: national/
public, corporate, and private.
Statistical analyses were performed using STATA software version 14.0 (StataCorp LP., College Station, TX, USA). Ethical approval for this study was obtained from the Catholic Medi- cal Center Institutional Review Board (MC15RNSI0043). In- formed consent was waived by the board.
RESULTS
Patient characteristics
Characteristics of the study subjects at the time of their first di- agnosis are shown in Table 1. The portion of males was about 11% higher than of females. The age distribution was skewed toward subjects over 50 years of age. A significant number of respondents were in income level 1 to 2 or 9 to 10, both equally 28.0%. Most patients used clinics (75.9%), medical institutions in the private sector (79.6%), institutions with 0 to 50 beds (75.7%), and with one physician (59.4%). The overall COC score was 0.83±0.24.
Because COC values were skewed (–1.073), we divided con- tinuity scores into two groups, higher and lower, based on the median. Table 1 shows the baseline characteristics of included patients in the high-COC and low-COC groups. Among the patients’ characteristics, sex, age, insurance status, and comor- bidity score were statistically significant variables. In the higher continuity group, the proportion of males aged 60 or younger,
with Medical Aid and a comorbidity score of 1 or above, were high. As for the characteristics of medical institutions, types of medical institution, and number of physicians were the signifi- cant variables. The proportion of general hospital and medical institutions with more than 21 physicians were high in the higher continuity group.
Association between continuity of care and diabetic complications
A little less than half (n=982, 43.5%) of the whole study popu- lation had diabetic complications. The incidence of microvas- cular and macrovascular complications among the study pop- ulation were 875 (38.7%) and 310 (13.7%), respectively. When the COC score was high, 39.2% (513 out of 1,310 participants) of these patients developed health complications. However, when the COC score was low, 49.4% of these patients had complications. Definitely, these are statistically significant (Ta- ble 2).
In the multivariate Cox analysis, the COC was found to be significantly associated with T2DM complications after adjust- ing for other factors, including patient characteristics (sex, age, insurance type, income), disease characteristics (hypoglycemic agent, comorbidity score), and medical institution characteris- tics (type, ownership, region, number of physicians, and num- ber of beds). The risk of having T2DM complications among patients who had higher COC scores was 0.69 times (95% con- fidence interval [CI], 0.539 to 0.878), significantly lower than those who had lower COC scores (Table 3). Patients’ gender, age, income level, and type of hospital at diagnosis were also significantly associated with T2DM complications. The results of the multiple logistic regression of higher-COC patients on diabetic complications showed an odds ratio of 0.55 (95% CI, 0.40 to 076) so that supports the robustness of COC scores as the survival analysis of having no diabetes complications.
The risk of having microvascular and macrovascular com- plications among patients with higher COC scores were 0.66 times (95% CI, 0.509 to 0.856) and 0.92 times (95% CI, 0.582 to 1.467) higher, respectively, than those with lower COC scores.
Relationship between continuity of care and cost of diabetes treatment
The average health care cost for patients with T2DM during the outcome evaluation period was about 3,696 USD. After an- alyzing the relationship between COC score and diabetes
treatment costs from 2006 to 2013, the average medical costs for treating T2DM was around 3,496 USD for patients with a high COC score, whereas it was around 3,973 USD for patients Table 1. Characteristics of patients by groups of COC index
score (%)
Characteristic Level of COC
Total P value
Low High
General characteristics of patients
Gendera 0.003
Male 493 (51.9) 764 (58.3) 1,257 (55.6) Female 456 (48.1) 546 (41.7) 1,002 (44.4)
Age group, yra 0.041
20–39 41 (4.3) 61 (4.7) 102 (4.5) 40–59 383 (40.4) 584 (44.6) 967 (42.8) ≥60 525 (55.3) 665 (50.8) 1,190 (52.7)
Insurance statusa 0.012
NHI 937 (98.7) 1,273 (97.2) 2,210 (97.8) Medical aid 12 (1.3) 37 (2.8) 49 (2.2)
Income levelb 0.522
0–2 292 (26.5) 457 (29.1) 749 (28.0) 3–4 139 (12.6) 173 (11.0) 312 (11.7) 5–6 180 (16.3) 242 (15.4) 422 (15.8) 7–8 194 (17.6) 247 (15.7) 441 (16.5) 9–10 298 (27.0) 451 (28.7) 749 (28.0)
C omorbidity scorea 0.045
0 447 (47.1) 537 (41.0) 984 (43.6) 1 162 (17.1) 267 (20.4) 429 (19.0) 2 224 (23.6) 326 (24.9) 550 (24.3) 3+ 116 (12.2) 180 (13.7) 296 (13.1) Institutionalc characteristic
T ypes of health
care providersa 0.015
G eneral
hospital 134 (14.1) 238 (18.2) 372 (16.5) Hospital 83 (8.7) 90 (6.9) 173 (7.7) Clinic 732 (77.1) 982 (75.0) 1,714 (75.9)
Ownership 0.176
N ational/public 22 (2.3) 27 (2.1) 49 (2.2) Corporate 156 (16.4) 255 (19.5) 411 (18.2) Individual 771 (81.2) 1,028 (78.5) 1,799 (79.6)
No. of beds 0.089
0–50 727 (76.6) 984 (75.1) 1,711 (75.7) 51–100 33 (3.5) 33 (2.5) 66 (2.9) 101–300 25 (2.6) 31 (2.4) 56 (2.5) ≥301 164 (17.3) 262 (20.0) 426 (18.9)
Characteristic Level of COC
Total P value
Low High
No. of physiciansa 0.029
1 564 (59.4) 777 (59.3) 1,341 (59.4) 2–5 192 (20.2) 235 (17.9) 427 (18.9)
6–10 39 (4.1) 42 (3.2) 81 (3.6)
11–20 36 (3.8) 37 (2.8) 73 (3.2) ≥21 118 (12.4) 219 (16.7) 337 (14.9) Total 949 (100.0) 1,310 (100.0) 2,259 (100.0) Values are presented as number (%).
COC, Continuity of Care; NHI, National Health Insurance.
aStatistically significant at α=0.05, bIncome decile in an ascending or- der, cThe most visited medical institution during the continuity obser- vation period.
(Continued to the next)
Table 1. Continued
Table 2. Distribution of diabetic complications and medical costs for different COC levels
Variable COC group
Total P value
Low High
Health complicationsa <0.001
Yes 469 (49.4) 513 (39.2) 982 (43.5) No 480 (50.6) 797 (60.8) 1,277 (56.5) Medical cost, USD 3,973±8,873 3,496±9,474 3,696±9,228 0.077 Total 949 (100.0) 1,310 (100.0) 2,259 (100.0) Values are presented as number (%) or mean±standard deviation.
COC, Continuity of Care; USD, United States dollar.
aStatistically significant at α=0.05.
Table 3. Multivariate Cox survival analysis on risk of diabetic complications for different levels of COC, adjusting for other factorsa
COC HR 95% CI
Low (ref) - -
High 0.688 0.539–0.878
COC, Continuity of Care; HR, hazard ratio; CI, confidence interval.
aOther factors include characteristics of patients (sex, age, health se- curity type, income level, hypoglycemic agent, comorbidity) and medical care institutions (types, ownership, region, number of physi- cians, number of beds).
with a low COC score, an increase of 477 USD, which was not statistically significant (Table 2). However, after adjusting for the other factors, medical costs incurred for patients with T2DM were significantly lower for patients with a high COC score compared to those for patients with a low COC score (Table 4).
DISCUSSION
The effects of continuity of treatment for T2DM on diabetic complications and health care costs were assessed using the National Health Insurance cohort database (2002 to 2013).
Continuity of care was evaluated based on managing diabetes continuously for 2 years after initial diagnosis during the con- tinuity observation period and the diabetes-related complica- tions for the 8 years of follow-up thereafter during the outcome evaluation period. The COC index was used to evaluate con- tinuous care. The total costs of diabetes treatment were mea- sured based on the outcome evaluation period (8 years). The results of this study demonstrated that high COC significantly reduced the risk of diabetes-related complications (HR, 0.69) and medical costs (3,496 USD vs. 3,973 USD) compared with low-COC patients with T2DM.
Patients with T2DM are at significant risk for a number of complications, such as retinopathy, renal disease, and heart disease [31]. The prevalence of retinopathy is related to the du- ration of diabetes and is regarded as the most substantial cause of blindness among adults aged 20 to 74 years [32]. The rate of cardiovascular disease is relatively high among patients with T2DM, resulting in an increased mortality rate compared with the general population [33-35]. These complications related to diabetes, however, can be reduced by continuity of care, be-
cause it may lead to escalating the likelihood of cancer screen- ing [36] and to increasing follow-up appointments [37]. In fact, continuity of care with a primary care provider is associat- ed with better glucose control among patients with T2DM, with a fairly high probability of detecting minor conditions at earlier stages to reduce the incidence of diabetes complications and incur fewer hospital admissions [18,38]. This study also reports the positive effect of continuity of care for people with diabetes, as do previous studies. Patients who received high COC score are significantly less likely to have diabetic compli- cations. Furthermore, patients with high COC scores have higher chances of survival. The COC score in the study was 0.83±0.24. In other studies, it was 0.84±0.17 for 3 years [15] or ranged from 0.64 to 0.66, using only diabetes-related visits be- tween 2001 and 2006 [18].
Another issue is economic burdens on the health care sys- tem as well as on patients. Direct medical costs (91.8 billion USD in 2002) in the United States comprise 25.3% for diabetes care, and 26.8% for chronic complications attributable to dia- betes [4]. The age-gender weighted average of lifetime medical costs for diabetic patients in the United States is 85,200 USD, of which 53% is due to treating diabetic complications, based on data from 2009 to 2010 from the National Health and Nu- trition Examination Survey [8]. Continuity of care, however, leads to decreasing medical costs from patients with diabetes.
In other words, there is a general reduction in health care costs as continuity of care improves [15,39,40]. Moreover, patients who do not fulfill continuity of care are more likely to spend more in medical costs than those who carry out continuity of care [41]. In this study, the average medical cost is approxi- mately 3,496 USD per patient for patients with a higher COC score, whereas it is 3,973 USD per patient for patients with a lower COC score. So the study finds results consistent with those of previous studies. Diabetics with higher COC scores had significantly lower medical expenses than those with lower COC scores after adjusting for other factors (β=–0.152).
This study is meaningful in the sense that it uses national claims-based data to verify the relationship between COC and medical costs and health outcomes for diabetes patients. How- ever, the use of secondary data in the analysis created a few limitations. First, this research considered only available vari- ables in the claims database, such as patients’ socioeconomic status, characteristics of disease, and medical institution, that could affect diabetes patients’ health outcome. It did not con- sider commonly addressed socio-behavioral characteristics in Table 4. Results of multiple linear regression for medical cost
of treating type 2 diabetes mellitus and COC, adjusting for other factorsa
COCb Medical care cost
Coefficient SE
Low (ref) - -
High –0.152 0.053
COC, Continuity of Care; SE, standard error.
aOther factors include characteristics of patients (sex, age, health se- curity type, income level, hypoglycemic agent, comorbidity) and medical care institutions (types, ownership, region, number of physi- cians, number of beds), bStatistically significant at α=0.05.
most studies of chronic conditions. For example, Kim et al.
[42] explained that a patient’s occupation, education, and fam- ily history can affect continuity of care. Ji [43] also stated that factors such as drinking and smoking habits, obesity, stress level, and average sleep hours can affect a patient’s ability to control glycemic hemoglobin. However, these factors were not considered in this research. Severity of diabetes was not prop- erly considered; this research instead applied the Charlson co- morbidity score to consider the patient’s overall health condi- tion. In the study by Cho et al. [30], the prescription of hypo- glycemic agents (types and number) and comorbidity index together were used to consider the severity of the disease. In this study, prescriptions of hypoglycemic agents and comor- bidity score were also considered to adjust for the severity of diabetes.
Second, out of all direct costs, this research only considered medical cost to calculate the cost of diabetes. It fails to recog- nize that diabetes is a chronic disease that lasts for a long peri- od of time. To manage this disease, a significant portion of the cost could be taken up by direct nonmedical costs, such as time, and transportation cost, and indirect cost such as de- crease of income incurred by productivity loss and death. Even if direct medical costs had been calculated, it only considered the covered benefit costs of medical care services.
This study demonstrated, by using the National Health In- surance cohort database, that continuity of care has significant impacts on complications and medical costs of patients with T2DM. Despite the limitations of the study variables and de- sign due to the nature of the NHI cohort data, there would be no difficulty in generalizing the results. Last, this study will be valuable for clinicians in understanding the concept and utility of care continuity.
CONFLICTS OF INTEREST
No potential conflict of interest relevant to this article was re- ported.
AUTHOR CONTRIBUTIONS
Conception or design: C.L., E.S.
Acquisition, analysis, or interpretation of data: J.H.N., C.L., D.W.S., E.S.
Drafting the work or revising: J.H.N., N.K., K.Y.P., J.H., J.Y., E.S.
Final approval of the manuscript: C.L., D.W.S., E.S.
ORCID
Ji Hyun Nam https://orcid.org/0000-0002-5003-8328 Changwoo Lee https://orcid.org/0000-0002-9616-1858 Euichul Shin https://orcid.org/0000-0002-7953-021X
ACKNOWLEDGMENTS
None
REFERENCES
1. International Diabetes Federation. IDF diabetes atlas. 5th ed.
Brussels: International Diabetes Federation; 2011.
2. International Diabetes Federation. IDF diabetes atlas. 4th ed.
Brussels: International Diabetes Federation; 2009.
3. Ogurtsova K, da Rocha Fernandes JD, Huang Y, Linnenkamp U, Guariguata L, Cho NH, Cavan D, Shaw JE, Makaroff LE.
IDF diabetes atlas: global estimates for the prevalence of diabe- tes for 2015 and 2040. Diabetes Res Clin Pract 2017;128:40-50.
4. Hogan P, Dall T, Nikolov P; American Diabetes Association.
Economic costs of diabetes in the US in 2002. Diabetes Care 2003;26:917-32.
5. Brandle M, Zhou H, Smith BR, Marriott D, Burke R, Tabaei BP, Brown MB, Herman WH. The direct medical cost of type 2 di- abetes. Diabetes Care 2003;26:2300-4.
6. Clarke P, Gray A, Legood R, Briggs A, Holman R. The impact of diabetes-related complications on healthcare costs: results from the United Kingdom Prospective Diabetes Study (UKP- DS Study No. 65). Diabet Med 2003;20:442-50.
7. Williams R, Van Gaal L, Lucioni C; CODE-2 Advisory Board.
Assessing the impact of complications on the costs of type II diabetes. Diabetologia 2002;45:S13-7.
8. Zhuo X, Zhang P, Hoerger TJ. Lifetime direct medical costs of treating type 2 diabetes and diabetic complications. Am J Prev Med 2013;45:253-61.
9. Centers for Disease Control and Prevention: National diabetes statistics report, 2014. Available from: https://www.cdc.gov/di- abetes/pdfs/data/2014-report-estimates-of-diabetes-and-its- burden-in-the-united-states.pdf (cited 2019 Aug 30).
10. Centers for Disease Control and Prevention: National diabetes statistics report, 2017. Available from: https://www.cdc.gov/di- abetes/pdfs/data/statistics/national-diabetes-statistics-report.
pdf (cited 2019 Aug 30).
11. Kim SA. The selection of the medical institutions by severity of disease [dissertation]. Seoul: Yonsei University; 2011.
12. Kim JY. The selection of the medical institutions by motivation of medical service utilization. J Digit Converg 2015;13:217-30.
13. Park EJ, Jeon JA, Kim DE, Song ES, Choi SJ, Shim BR. Health- care service utilization among Korean patients with chronic disease: focusing on hypertension and type 2 diabetes mellitus.
Sejong: Korea Institute for Health and Social Affairs; 2016.
14. Lin W, Huang IC, Wang SL, Yang MC, Yaung CL. Continuity of diabetes care is associated with avoidable hospitalizations:
evidence from Taiwan’s National Health Insurance scheme. Int J Qual Health Care 2010;22:3-8.
15. Worrall G, Knight J. Continuity of care is good for elderly peo- ple with diabetes: retrospective cohort study of mortality and hospitalization. Can Fam Physician 2011;57:e16-20.
16. Hanafi NS, Abdullah A, Lee PY, Liew SM, Chia YC, Khoo EM.
Personal continuity of care in a university-based primary care practice: impact on blood pressure control. PLoS One 2015;10:
e0134030.
17. Tsai HY, Chou YJ, Pu C. Continuity of care trajectories and emergency room use among patients with diabetes. Int J Public Health 2015;60:505-13.
18. Chen CC, Chen SH. Better continuity of care reduces costs for diabetic patients. Am J Manag Care 2011;17:420-7.
19. Tom JO, Tseng CW, Davis J, Solomon C, Zhou C, Mangione- Smith R. Missed well-child care visits, low continuity of care, and risk of ambulatory care-sensitive hospitalizations in young children. Arch Pediatr Adolesc Med 2010;164:1052-8.
20. Litaker D, Ritter C, Ober S, Aron D. Continuity of care and cardiovascular risk factor management: does care by a single clinician add to informational continuity provided by electron- ic medical records? Am J Manag Care 2005;11:689-96.
21. Younge R, Jani B, Rosenthal D, Lin SX. Does continuity of care have an effect on diabetes quality measures in a teaching prac- tice in an urban underserved community? J Health Care Poor Underserved 2012;23:1558-65.
22. Bice TW, Boxerman SB. A quantitative measure of continuity of care. Med Care 1977;15:347-9.
23. Shortell SM. Continuity of medical care: conceptualization and measurement. Med Care 1976;14:377-91.
24. Saultz JW. Defining and measuring interpersonal continuity of care. Ann Fam Med 2003;1:134-43.
25. Fowler MJ. Microvascular and macrovascular complications of diabetes. Clin Diabetes 2008;26:77-82.
26. Park CM, Jang SM, Jang SH, Lee HJ. Healthcare cost and out- come affected by continuity of care (hypertension and diabe- tes). Seoul: Health Insurance Review and Assessment Service;
2011.
27. Hodgson TA, Meiners MR. Cost-of-illness methodology: a guide to current practices and procedures. Milbank Mem Fund Q Health Soc 1982;60:429-62.
28. Hong JS, Kim JY. Study on continuity of primary care for Kore- an elderly. Seoul: Health Insurance Review and Assessment Service; 2007.
29. Chen CC, Tseng CH, Cheng SH. Continuity of care, medica- tion adherence, and health care outcomes among patients with newly diagnosed type 2 diabetes: a longitudinal analysis. Med Care 2013;51:231-7.
30. Cho KH, Lee SG, Jun B, Jung BY, Kim JH, Park EC. Effects of continuity of care on hospital admission in patients with type 2 diabetes: analysis of nationwide insurance data. BMC Health Serv Res 2015;15:107.
31. Mainous AG 3rd, Koopman RJ, Gill JM, Baker R, Pearson WS.
Relationship between continuity of care and diabetes control:
evidence from the third National Health and Nutrition Exami- nation Survey. Am J Public Health 2004;94:66-70.
32. American Diabetes Association. Standards of medical care for patients with diabetes mellitus. Diabetes Care 2003;26:S33-50.
33. Vijan S, Stevens DL, Herman WH, Funnell MM, Standiford CJ. Screening, prevention, counseling, and treatment for the complications of type II diabetes mellitus. Putting evidence into practice. J Gen Intern Med 1997;12:567-80.
34. Krolewski AS, Czyzyk A, Janeczko D, Kopczynski J. Mortality from cardiovascular diseases among diabetics. Diabetologia 1977;13:345-50.
35. Panzram G. Mortality and survival in type 2 (non-insulin-de- pendent) diabetes mellitus. Diabetologia 1987;30:123-31.
36. O’Malley AS, Mandelblatt J, Gold K, Cagney KA, Kerner J.
Continuity of care and the use of breast and cervical cancer screening services in a multiethnic community. Arch Intern Med 1997;157:1462-70.
37. Sweeney KG, Gray DP. Patients who do not receive continuity of care from their general practitioner: are they a vulnerable group? Br J Gen Pract 1995;45:133-5.
38. Parchman ML, Pugh JA, Noel PH, Larme AC. Continuity of care, self-management behaviors, and glucose control in pa- tients with type 2 diabetes. Med Care 2002;40:137-44.
39. Raddish M, Horn SD, Sharkey PD. Continuity of care: is it cost effective? Am J Manag Care 1999;5:727-34.
40. Weiss LJ, Blustein J. Faithful patients: the effect of long-term physician-patient relationships on the costs and use of health care by older Americans. Am J Public Health 1996;86:1742-7.
41. Kim J, Kim H, Kim H, Min KW, Park SW, Park IB, Park JH, Baik SH, Son HS, Ahn CW, Oh JY, Lee S, Lee J, Chung CH, Choi KM, Choi I, Kim DJ. Current status of the continuity of ambulatory diabetes care and its impact on health outcomes and medical cost in Korea using National Health Insurance
Database. J Korean Diabetes Assoc 2006;30:377-87.
42. Kim YM, Chang DM, Kim SS, Park IS, Kang SH. A study on factors of management of diabetes mellitus using data mining.
J Korea Acad Ind Coop Soc 2009;10:1100-8.
43. Ji EJ. Factors associated with hemoglobin a1c among patient aged 40 years over with diabetes mellitus: 2012 Korea Health and Nutrition Examination Survey. J Korean Acad Fundam Nurs 2015;22:433-41.