Changes of Central Obesity is the Major Determinant of Influences of Weight Reduction on Bone Mineral Density
Sang-Mo Hong, You-Hern Ahn, Woong-Hwan Choi
Department of Internal Medicine, Hanyang University College of Medicine, Seoul, Korea
Objectives: Obesity and osteoporosis have been increasing for decades but their relationship to bone mineral density (BMD) and fat mass has not been defined. The aim of this study was to investigate how changes in body composition affect BMD after a weight reduction.
Materials and Methods: We reviewed 48 middle-aged obese women who had participated in our diet program and succeeded in reducing their weight. Body composition was measured by the dual-energy X-ray absorptiometry method, and metabolic syndrome was defined as described in the ATP-III guidelines.
All differences between baseline and 12 weeks later were expressed as [{12th week data–baseline data}/baseline data×100].
Results: The mean age of the participants was 38.29±10.89 years, and the mean follow-up time was 85 days. The mean body mass index was 31.50±5.19 kg/m2. Basal BMD decreased with age and increased with weight and appendicular lean mass. In a regression analysis, appendicular lean mass was positively correlated with leg BMD (R2=0.235, B=0.015, P<0.001) and age (B=-0.002, P=0.046), and appendicular lean mass (B=0.019, P=0.049) was the main determinant of total BMD (R2=0.272). After weight reduction, the total body BMD change ratio (R2=0.281) was negatively related to the change of fat mass, trunk fat mass (B=-0.042, P=0.087) and waist circumference (B=-0.108, P=0.014)
Conclusions: Our findings suggest that BMD is determined by muscle mass, and that changes in central obesity may also affect BMD.
Key Words: Bone mineral density, Body composition, Central obesity, Obesity
Received: August 26, 2010 Revised: December 10, 2010 Accepted: December 29, 2010
Corresponding Author: Woong-Hwan Choi, Internal Medicine, Hanyang University, College of Medicine, 17 Heangdang- dong, Seongdong-ku, Seoul 133-792, Korea
Tel: +82-2-2290-8327, Fax: +82-2-2298-9183 E-mail: [email protected]
The prevalence of obesity and osteoporosis has increased over the past decades. It is widely believed that obesity has a protective effect on osteoporosis.
Many epidemiological studies have shown that elevated body weight and body mass index (BMI) lead to increased peak bone mass.1-4
The body mass index is widely used to diagnose
obesity because of its convenience but it does not distinguish fat mass from lean mass, while obesity is a condition of excess fat mass. Therefore understanding the roles of fat and lean (muscle) mass in bone is needed to define exactly the relationship between obesity and osteoporosis.
Lean body mass is positively correlated with bone mineral density (BMD).5-7 This is explained by mechanical stress due to high body weight and local strain resulting from muscle contraction.5,8,9 In a recent study, of all the physical activities and functional capacities evaluated, handgrip strength was the most
closely associated with BMD in all the analyzed bone sites.10 In ambulatory individuals with chronic stroke paralysis, leg bone mineral density is known to decrease with decreasing lean mass.9
Many studies have also found a correlation between BMD and fat mass, but the overall results are incon- sistent.11-13 Adipose tissues produce leptin, and also estrogen by aromatization of androgens. Leptin in particular is known to stimulate periosteal bone forma- tion through its direct anabolic effects on osteoblasts, and through central effects, including stimulation of the GH-IGF-1 axis and suppression of neuropeptide Y, a powerful inhibitor of bone formation.14 Fat mass is classified by location into visceral and subcutaneous.
These two types of fat mass are known to have different effects. Visceral fat mass induces insulin resistance, metabolic syndrome, leptin resistance and inflammation.15 Its effect on bone is therefore thought to differ from that of subcutaneous fat. However, lean and fat masses are reciprocally related. Thus, physical exercise increases lean body mass and BMD, but decreases body fat mass. Therefore defining the effect of body composition on bone by means of cross- sectional studies alone is inadequate and instead needs a more dynamic approach.
One of the deleterious consequences of weight loss can be accelerated bone loss and susceptibility to fractures and osteoporosis. In this situation, leans body mass and fat mass decrease to various extents and these changes result in related alterations of BMD. However there have been few studies of the effects of changes of lean body mass and fat mass on BMD after weight reduction. Hence the aims of our investigation were to clarify the relation of BMD to body composition (lean mass, fat mass, central obesity and peripheral lean mass) and anthropometry, and to examine the effects of body compositional changes on BMD after weight reduction.
MATERIALS AND METHODS
1. Study design and population
We analyzed the data from subjects who participated in a randomized, double blind, active-controlled study evaluating the safeness and efficacy of sibutramine sulfate compared with sibutramine hydrochloride monohydrate in obese patients. We selected forty-eight female subjects who achieved weight reduction. Inclusion criteria for the study were that BMI was over 30 kg/m2, or 27~30 kg/m2 with either hypertension (but SBP≤145 mmHg, DBP≤
95 mmHg) dyslipidemia (total cholesterol 236≥mg/dL or triglyceride≥150 mg/dL) or diabetes (but fasting serum glucose≤140 mg/dL). And subjects’ ages were limited to eighteen to sixty-five. All subjects accepted a low calorie diet (20~25 kcal/kg/day) and were also instructed to exercise as prior to the study. Exclusion criteria were defined as illness or use of medication causing obesity. The study data were obtained from the second and fifth visits (12 weeks to the second visit).
The study protocol was approved by the ethical com- mittee of Hanyang University Hospital, and informed consent was obtained from all participants.
2. Measurement of anthropometric and biochemical parameters
Height and body weight were measured in light clothes.
Body mass index (BMI) was calculated as weight divided by height squared (kg/m2). Waist circumference was measured midway between the lower costal margin (bottom of lower rib) and the iliac crest (top of pelvic bone) while the subject was standing without clothing.
Blood pressure was recorded as the mean of two measurements after subjects had relaxed for at least 10 min in a sitting position. Blood samples were collected by venipuncture in the early morning (7 AM) after a 12 hr. fast. Serum samples for assay of lipids and glucose were collected in sterile vacuum tubes and centrifuged for 20 min at 4oC. Serum glucose was measured by the
Baseline 12 weeks later
P value
Mean±SD Mean±SD
Age (years) 38.8±10.8 - -
Follow-up duration (years) 85.5±5.56 - -
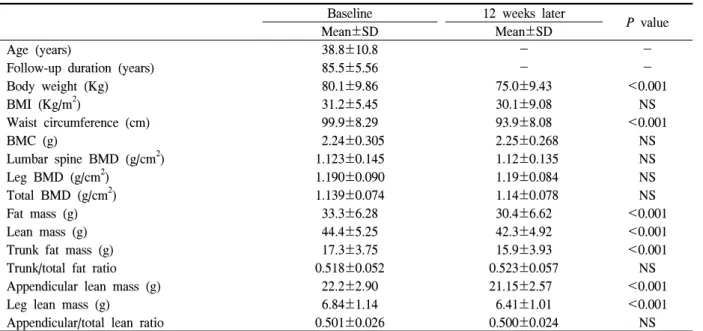
Body weight (Kg) 80.1±9.86 75.0±9.43 <0.001
BMI (Kg/m2) 31.2±5.45 30.1±9.08 NS
Waist circumference (cm) 99.9±8.29 93.9±8.08 <0.001
BMC (g) 2.24±0.305 2.25±0.268 NS
Lumbar spine BMD (g/cm2) 1.123±0.145 1.12±0.135 NS
Leg BMD (g/cm2) 1.190±0.090 1.19±0.084 NS
Total BMD (g/cm2) 1.139±0.074 1.14±0.078 NS
Fat mass (g) 33.3±6.28 30.4±6.62 <0.001
Lean mass (g) 44.4±5.25 42.3±4.92 <0.001
Trunk fat mass (g) 17.3±3.75 15.9±3.93 <0.001
Trunk/total fat ratio 0.518±0.052 0.523±0.057 NS
Appendicular lean mass (g) 22.2±2.90 21.15±2.57 <0.001
Leg lean mass (g) 6.84±1.14 6.41±1.01 <0.001
Appendicular/total lean ratio 0.501±0.026 0.500±0.024 NS
BMI, body mass index; BMC, bone mineral content; BMD, bone mineral density.
Table 1. Characteristics of subjects at baseline and after 12 weeks hexokinase method (Advia 1650, Bayer, USA), and serum
cholesterol and TG were measured by enzymatic methods (Advia 1650, Bayer, USA), while HDL cholesterol was measured by the elimination/catalase method (Advia 1650, Bayer, USA). Metabolic syndrome was diagnosed according to the National Cholesterol Education Program Adult Treatment Guidelines III (NCEP-ATPIII) definition and the Asia-Pacific definition of waist circumference (≥
80 cm).
3. Body composition and bone mineral density Body weight and anthropometrics were measured in light clothing. Whole body composition, as well as bone mineral content (BMC), lean body mass, fat body mass, trunk fat mass and bone mineral density (BMD) were measured using dual-energy X-ray absorptiometry (DXA) with a Hologic QDR-4500A device (software version 11.2.1; Hologic Inc., Bedford, MA, USA). We estimated central obesity as [trunk fat mass/fat body mass]. Appendicular lean mass was obtained from [sum of lean mass of both arms and legs]. The coefficient of variation (CV%) for spine and whole body calibration
phantoms was <1% as calculated from daily and weekly measurements, respectively.
4. Statistical analysis
Results are presented as means±SD. Paired-samples t-tests were used to compare differences between baseline and 12 weeks. Pearson’s correlation analysis was used to determine the correlation between BMD and other body composition parameters. Multiple regression analysis with correlated body composition and anthropometric parameters were used to assess the contribution of these parameters to total mean BMD, leg BMD and spine BMD. To analysis the effect of weight loss on BMD, all baseline to 12 weeks diffe- rences were represented as percentage changes [(12 weeks later-baseline data)/baseline data * 100]. We used Pearson’s correlation analysis to determine the correlation between BMD change and body composi- tional change after 12 weeks. Multiple regression analysis was also used to confine the contributions to BMD change. Differences between groups with respect to BMD change were analyzed by independent t-test.
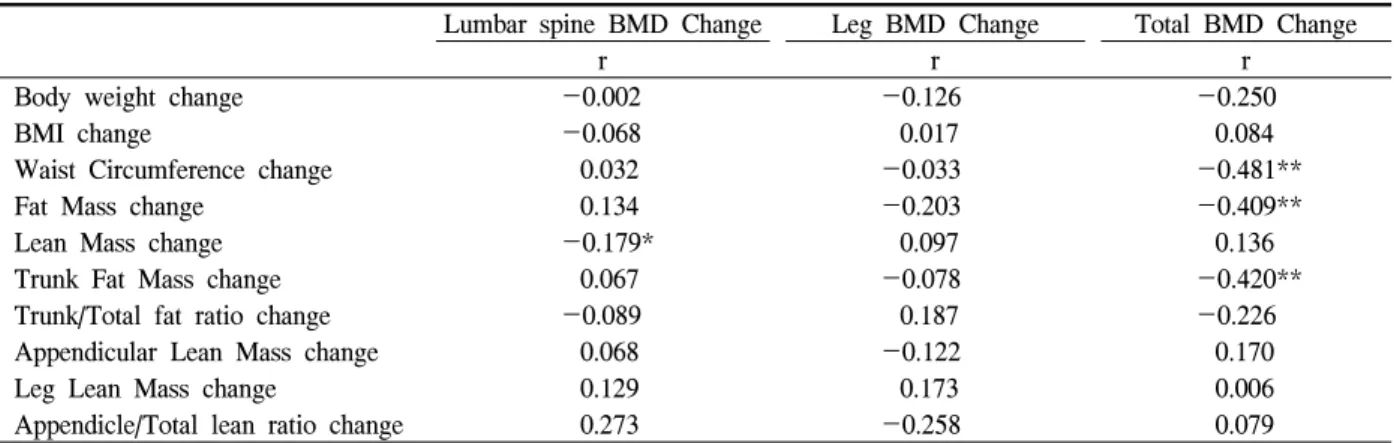
Lumbar spine BMD Change Leg BMD Change Total BMD Change
r r r
Body weight change -0.002 -0.126 -0.250
BMI change -0.068 0.017 0.084
Waist Circumference change 0.032 -0.033 -0.481**
Fat Mass change 0.134 -0.203 -0.409**
Lean Mass change -0.179* 0.097 0.136
Trunk Fat Mass change 0.067 -0.078 -0.420**
Trunk/Total fat ratio change -0.089 0.187 -0.226
Appendicular Lean Mass change 0.068 -0.122 0.170
Leg Lean Mass change 0.129 0.173 0.006
Appendicle/Total lean ratio change 0.273 -0.258 0.079
* Significant at the 0.05 level (2-tailed), ** Significant at the 0.01 level (2-tailed).
BMI, body mass index; BMD, bone mineral density; WC, waist circumference.
Table 3. Correlation Results (r) of BMD change with changes of body composition parameters
Lumbar spine BMD Leg BMD Total BMD
r r r
Age -0.454** -0.378** -0.454**
Body weight 0.292* 0.346* 0.378**
BMI -0.031 -0.043 0.066
Waist Circumference 0.007 0.065 0.146
Fat Mass 0.178 0.171 0.257
Lean Mass 0.305* 0.422** 0.360**
Trunk Fat Mass 0.056 -0.012 0.088
Trunk/Total fat ratio -0.195 -0.356* -0.314*
Appendicular Lean Mass 0.412** 0.485** 0.462**
Leg Lean Mass 0.493** 0.420** 0.452**
Appendicle/Total lean ratio 0.353* 0.242 0.344*
* Significant at the 0.05 level (2-tailed), ** Significant at the 0.01 level (2-tailed).
BMI, body mass index; BMD, bone mineral density.
Table 2. Correlation Results (r) of BMD with body composition parameters The incidences of metabolic syndrome were compared
by chi-square analysis and we used the McNemar test to compare the incidence of metabolic syndrome at baseline and 12 weeks. Analyses were performed with the SPSS statistical package for Windows (version 16.0, SPSS Inc., Chicago, IL). Differences between groups were considered statistically significant at P<0.05.
RESULTS
The mean age of the forty-eight subjects was 38.29
±10.89 years. Mean follow-up time was 85 days. Mean BMI was 31.50±5.19 kg/m2. Baseline body compo-
sitions are given in Table 1. We compared baseline and 12 week data by paired-sample t-tests and obtained significant differences in body weight, fat mass, lean mass, trunk fat mass, leg lean mass and waist circum- ference. However bone mineral content, lumbar spine BMD, leg BMD, total BMD and BMI were not significantly different. The patterns of total BMD and total mass (body weight) differed after 12 weeks, and L-spine & Leg BMD displayed a pattern similar to total BMD.
1. Bone mineral density & body composition Age was negatively correlated with L-spine, leg and
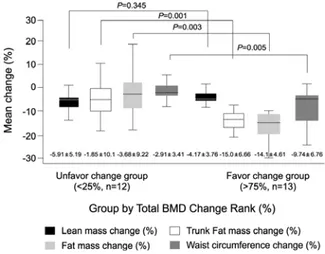
Fig. 1. The body composition changes between the two groups.
total BMD. Appendicular lean mass, lean mass & leg lean mass showed strong positive correlations with BMD, and the appendicular/total lean ratio was correla- ted with L-spine and total BMD. However, fat mass and obesity parameters (BMI and waist circumference) were not correlated with BMD (Table 2), although the trunk/total fat ratio was negatively correlated with leg and total BMD. In a backward multiple regression analysis involving age, lean body mass, appendicular lean mass and trunk/total fat mass, only appendicular lean mass displayed a positive correlation with leg BMD (R2=0.235, B=0.015 P<0.001). Age (B=-0.002, P=0.046) and appendicular lean mass (B=0.019, P=
0.049) were the main determinants of total BMD (R2= 0.272).
2. Body composition change and BMD change after weight loss
We compared the BMD change ratio with the body composition change ratio [(Poststates-Prostates)/Pro- states * 100]. L spine BMD and leg BMD changes were not correlated with body composition change (Table 3), but the total body BMD change ratio was negatively associated with change of fat mass, trunk fat mass and waist circumference. In linear regression analysis, total body BMD was negatively correlated with the fat mass change ratio (R2=0.167, B=-0.087, P=0.004), trunk fat mass change ratio (R2=0.176, B=
-0.071, P=0.003), and waist circumference change ratio (R2=0.232, B=-0.142, P=0.001). Backward multi- ple regression analysis revealed that waist circum- ference change (B=-0.108, P=0.014) and trunk fat mass change ratio (B=-0.042, P=0.087) were the main inverse determinants of total body BMD change (R2= 0.281).
3. Favorable change group vs. unfavo- rable change group
We divided the subjects into two groups according to total body BMD change rank [<25% (n=12) vs. ≥75%
(n=13)], and compared the two groups using the independent t-test. Of the baseline parameters, there were no mean differences between the groups in age, fat mass, lean mass, total mass, all BMD measure- ments, t score, BMI, and waist circumference. Among the weight reduction parameters (body composition change ratios), body weight change ratio (-4.66±
3.06%; unfavorable change group vs. -7.79±3.33%;
favorable change group, P=0.022), fat mass change ratio (-3.69±9.23%; unfavorable change group vs. -14.1±
4.62%; favorable change group, P=0.003), trunk fat change ratio (-1.85±10.1%; unfavorable change group vs. -15.1±6.66%; favorable change group, P=0.001) and waist circumference change (-2.91±3.41%; un- favorable change group vs. -9.74±6.76%; favorable change group, P=0.005) differed between two groups (Fig. 1). However we noted that lean mass change ratio did not differ between two groups (P=0.353, Fig. 1).
4. Incidence of metabolic syndrome in the groups with increased and reduced BMD The incidence of baseline metabolic syndrome as assessed by the chi-square test did not differ between the groups. The incidence of metabolic syndrome after 12 weeks also did not differ (McNemar test).
DISCUSSION
Our study has shown that the BMD of leg and total body are mainly determined by appendicular lean mass in obese subjects. However, after weight loss, change of total body BMD was negatively correlated with change of waist circumference and trunk/total fat. The relationship between bone and the components of body composition is not clear. Furthermore, distinguishing the effects of lean and fat mass on bone is difficult, because the two measurements are correlated and are also related to body weight and age, which in turn are highly correlated with BMD. Nevertheless bone has been shown to be positively correlated with lean mass in many studies,16-18 and regional muscle strength is known to be related to regional BMD. In a previous study, quadriceps muscle strength was found to be related to the BMD of the proximal tibia in young women,19 and spine extensor muscle strength was related to spine BMD in postmenopausal women.20 Stikkelbroeck et al. obtained similar results comparing young adult patients suffering from congenital adrenal hyperplasia to healthy young adults. The two groups of workers found differences in fat mass and BMI but did not analyze BMD, lean mass and fat distribution.21 Also a previous Korean population study showed that lean body mass was positively correlated with L-spine BMD, but fat mass was not.22 Like the previous studies, we observed that only appendicular lean mass was related to BMD in multiple regression analysis with age, body weight, and trunk/total fat mass.
On the other hand, fat mass was not related to BMD in our study. The relation of bone to fat mass is controversial. Many different results have been obtained using different populations and study designs.13,14,23,24
In studies of general populations, fat had a positive effect on bone.12,25 On the other hand, in subjects with similar BMI values, the effect was negative.26 If subjects’ BMI values were highly variable, fat mass increased with increasing body weight and lean body mass.26,27
However, in subjects with only a narrow range of BMIs or weights, fat mass was negatively correlated with BMD.26,27 If this difference is not taken into account one may draw incorrect conclusion regarding the effect of fat mass on BMD. Therefore, under- standing the subjects’ characteristics is essential. The present subjects were middle-aged (38.8±10.8) obese (BMI, 31.2±5.45) women with central obesity (WC, 99.9±8.29). The relatively narrow BMI distribution of these subjects could have weakened the positive effect of fat mass on BMD. In a recent report, visceral fat in particular had a negative effect on bone.24 We also observed that the trunk/total fat ratio was negatively correlated with leg and total BMD in simple correlation analysis, but showed no correlation with BMD in multiple regression analysis. However, we should not neglect the role of central obesity. Comparison with a control group without central obesity would be needed to define the effect of central obesity on bone, and we had no such control group.
There have been a number of studies of changes of BMD and body composition after weight reduction17,
28,29
but the effects of these changes on BMD were not analyzed. In the present study, mean weight loss was 5.04±3.21 kg and mean observational period was 85.5
±5.56 days. Owing to the relatively short observational period, BMD changes due to aging could be ignored, but many parameters failed to show a relationship to BMD. Previous studies have shown that change of lean mass due to resistance exercises is correlated with BMD.30 However in our data, fat mass, trunk fat mass and waist circumference changes were negatively cor- related with total body mean BMD change; hence, so as to better understand the effect of body composition change on BMD, we divided our subjects into two groups, those in which BMD increased and those in which it decreased. The baseline data for the two groups did not differ. However the increased BMD group showed more trunk fat reduction and waist circumference reduction during weight loss than the
decreased BMD group. One might have expected that the former would be more physically active than the latter but in fact there was no significant difference in physical activity between the two groups. Visceral fat has different characteristics from subcutaneous fat.
Leptin, a satiety-regulating hormone that is produced by adipocytes, promotes differentiation of osteoblasts and affects bone resorption, and is also supposedly less abundant in visceral tissue31,32; also, visceral fat is associated with increased levels of proinflammatory cytokines such as TNF-α and IL-6, both of which increase bone resorption and promote osteoporosis.32-34 Hence, visceral fat is thought to have an unfavorable effect on bone. We conclude, therefore, that central obesity change during weight reduction may have an independent effect on BMD.
A recent study has revealed that metabolic syndrome may be a risk factor for osteoporosis and related fractures.35 In our study, there was no difference in the improvement of metabolic syndrome between the two groups, although, the incidence of metabolic syndrome was lower in the favorable change group (75% → 62.5%) after 12 weeks than in the unfavorable change group (54.1% → 54.1%).29,36
Our study had some limitations. First, all subjects received sibutramine and we did not include a placebo control group. Therefore the possible effects of sibutra- mine on bone were not evaluated. Second, diet and exercise data were not obtained. We only suggested that subjects have a dietary intake of 20~25 kcal per kg and exercise as they did before the study. Therefore weight reduction might be due to decreased calories.
Third, the duration of the study (12 weeks) might be too short to detect changes in DXA. However, three months is sufficient to detect changes in bone meta- bolism, and losses in bone mass during weight reduction can be seen in that time.
In conclusion, our findings suggest that BMD is mainly determined by muscle mass. Central obesity was also negatively correlated with BMD, but not in the
regression analysis. However, although the changes of BMD were related to changes of central obesity, lean mass change was unrelated to BMD changes. Therefore a larger prospective study may be needed to clarify the relation between central obesity and bone mass density.
REFERENCES
1. Hannan MT, Felson DT, Anderson JJ. Bone mineral density in elderly men and women: results from the Framingham osteoporosis study. J Bone Miner Res 1992;7(5):547-53.
2. Compston JE, Laskey MA, Croucher PI, Coxon A, Kreitzman S. Effect of diet-induced weight loss on total body bone mass. Clin Sci (Lond) 1992;
82(4):429-32.
3. De Laet C, Kanis JA, Oden A, Johanson H, Johnell O, Delmas P, et al. Body mass index as a predictor of fracture risk: a meta-analysis. Osteo- poros Int 2005;16(11):1330-8.
4. Holbrook TL and Barrett-Connor E. The associa- tion of lifetime weight and weight control patterns with bone mineral density in an adult community.
Bone Miner 1993;20(2):141-9.
5. Beck TJ, Oreskovic TL, Stone KL, Ruff CB, Ensrud K, Nevitt MC, et al. Structural adaptation to changing skeletal load in the progression toward hip fragility: the study of osteoporotic fractures. J Bone Miner Res 2001;16(6):1108-19.
6. Faulkner RA, Bailey DA, Drinkwater DT, Wilkinson AA, Houston CS, McKay HA. Regional and total body bone mineral content, bone mineral density, and total body tissue composition in children 8-16 years of age. Calcif Tissue Int 1993;53(1):7-12.
7. Burr DB. Muscle strength, bone mass, and age- related bone loss. J Bone Miner Res 1997;12(10):
1547-51.
8. Schoenau E. From mechanostat theory to develop- ment of the “Functional Muscle-Bone-Unit”. J Musculoskelet Neuronal Interact 2005;5(3):232-8.
9. Pang MY, Eng JJ, McKay HA, Dawson AS.
Reduced hip bone mineral density is related to physical fitness and leg lean mass in ambulatory individuals with chronic stroke. Osteoporos Int 2005;16(12):1769-79.
10. Marin RV, Pedrosa MA, Moreira-Pfrimer LD, Matsudo SM, and Lazaretti-Castro M. Association between lean mass and handgrip strength with bone mineral density in physically active postmenopausal women. J Clin Densitom 2010;13(1):96-101.
11. Galvard H, Elmstahl S, Elmstahl B, Samuelsson SM, Robertsson E. Differences in body compo- sition between female geriatric hip fracture patients and healthy controls: body fat is more important as explanatory factor for the fracture than body weight and lean body mass. Aging (Milano) 1996;8(4):
282-6.
12. Reid IR, Ames R, Evans MC, Sharpe S, Gamble G, France JT, et al. Determinants of total body and regional bone mineral density in normal postmeno- pausal women--a key role for fat mass. J Clin Endocrinol Metab 1992;75(1):45-51.
13. Taes YE, Lapauw B, Vanbillemont G, Bogaert V, De Bacquer D, Zmierczak H, et al. Fat mass is negatively associated with cortical bone size in young healthy male siblings. J Clin Endocrinol Metab 2009;94(7):2325-31.
14. Zhao LJ, Jiang H, Papasian CJ, Maulik D, Drees B, Hamilton J, et al. Correlation of obesity and osteoporosis: effect of fat mass on the determina- tion of osteoporosis. J Bone Miner Res 2008;23(1):
17-29.
15. Hamrick MW, Ferrari SL. Leptin and the sym- pathetic connection of fat to bone. Osteoporos Int 2008;19(7):905-12.
16. Bjorntorp P. Metabolic implications of body fat distribution. Diabetes Care 1991;14(12):1132-43.
17. Douchi T, Matsuo T, Uto H, Kuwahata T, Oki T, and Nagata Y. Lean body mass and bone mineral density in physically exercising postmenopausal
women. Maturitas 2003;45(3):185-90.
18. Crespo NC, Yoo EJ, Hawkins SA. Anthropometric and Lifestyle Associations of Bone Mass in Healthy Pre-Menopausal Mexican and Asian American Women. J Immigr Minor Health 2011;
13(1):74-80.
19. Snow-Harter C, Bouxsein M, Lewis B, Charette S, Weinstein P, Marcus R. Muscle strength as a predictor of bone mineral density in young women.
J Bone Miner Res 1990;5(6):589-95.
20. Sinaki M, McPhee MC, Hodgson SF, Merritt JM, Offord KP. Relationship between bone mineral density of spine and strength of back extensors in healthy postmenopausal women. Mayo Clin Proc 1986;61(2):116-22.
21. Stikkelbroeck NM, Oyen WJ, van der Wilt GJ, Hermus AR, Otten BJ. Normal bone mineral density and lean body mass, but increased fat mass, in young adult patients with congenital adrenal hyperplasia. J Clin Endocrinol Metab 2003;88(3):
1036-42.
22. Kim CJ, Oh KW, Rhee EJ, Kim KH, Jo SK, Jung CH, et al. Relationship between body composition and bone mineral density (BMD) in perimenopausal Korean women. Clin Endocrinol (Oxf) 2009;71(1):
18-26.
23. Yamaguchi T, Kanazawa I, Yamamoto M, Kurioka S, Yamauchi M, Yano S, et al. Associations between components of the metabolic syndrome versus bone mineral density and vertebral fractures in patients with type 2 diabetes. Bone 2009;45(2):
174-9.
24. Gilsanz V, Chalfant J, Mo AO, Lee DC, Dorey FJ, Mittelman SD. Reciprocal relations of subcu- taneous and visceral fat to bone structure and strength. J Clin Endocrinol Metab 2009;94(9):3387- 93.
25. Douchi T, Oki T, Nakamura S, Ijuin H, Yamamoto S, Nagata Y. The effect of body composition on bone density in pre-and postmenopausal women.
Maturitas 1997;27(1):55-60.
26. Hsu YH, Venners SA, Terwedow HA, Feng Y, Niu T, Li Z, et al. Relation of body composition, fat mass, and serum lipids to osteoporotic fractures and bone mineral density in Chinese men and women.
Am J Clin Nutr 2006;83(1):146-54.
27. Zhao LJ, Liu YJ, Liu PY, Hamilton J, Recker RR, and Deng HW. Relationship of obesity with osteo- porosis. J Clin Endocrinol Metab 2007;92(5):1640- 6.
28. Ryan AS, Ivey FM, Hurlbut DE, Martel GF, Lemmer JT, Sorkin JD, et al. Regional bone mineral density after resistive training in young and older men and women. Scand J Med Sci Sports 2004;14(1):16-23.
29. Uusi-Rasi K, Sievanen H, Kannus P, Pasanen M, Kukkonen-Harjula K, Fogelholm M. Influence of weight reduction on muscle performance and bone mass, structure and metabolism in obese pre- menopausal women. J Musculoskelet Neuronal Interact 2009;9(2):72-80.
30. Daly RM, Dunstan DW, Owen N, Jolley D, Shaw JE, Zimmet PZ. Does high-intensity resistance training maintain bone mass during moderate weight loss in older overweight adults with type 2 diabetes? Osteoporos Int 2005;16(12):1703-12.
31. Elefteriou F, Takeda S, Ebihara K, Magre J, Patano N, Kim CA, et al. Serum leptin level is a regulator of bone mass. Proc Natl Acad Sci USA 2004;
101(9):3258-63.
32. Fontana L, Eagon JC, Trujillo ME, Scherer PE, Klein S. Visceral fat adipokine secretion is associa- ted with systemic inflammation in obese humans.
Diabetes 2007;56(4):1010-3.
33. Pou KM, Massaro JM, Hoffmann U, Vasan RS, Maurovich-Horvat P, Larson MG, et al. Visceral and subcutaneous adipose tissue volumes are cross- sectionally related to markers of inflammation and oxidative stress: the Framingham Heart Study.
Circulation 2007;116(11):1234-41.
34. Cartier A, Lemieux I, Almeras N, Tremblay A, Bergeron J, Despres JP. Visceral obesity and plasma glucose-insulin homeostasis: contributions of interleukin-6 and tumor necrosis factor-alpha in men. J Clin Endocrinol Metab 2008;93(5):1931-8.
35. Hwang DK, Choi HJ. The relationship between low bone mass and metabolic syndrome in Korean women. Osteoporos Int 2010;21(3):425-31.
36. Holmberg-Marttila D, Sievanen H, and Tuimala R.
Changes in bone mineral density during pregnancy and postpartum: prospective data on five women.
Osteoporos Int 1999;10(1):41-6.