Introduction
Evaluating and avoiding perioperative risk factors compro- mising myocardial performance is important to enhance post- operative outcomes and reduce perioperative morbidity and mortality in adult non-cardiac surgery.1-3) For preoperative risk evaluation, traditionally the revised cardiac risk index4) and American College of Cardiology and American Heart Associa- tion guidelines5) are applied. Unfortunately, the traditional predictive tools do not integrate purely anesthesia-related fac- tors for routine surgeries, presumably in the belief that the so-
phistication of modern anesthesia practice renders it devoid of relevant risks in such cases.
Anesthesia induction is commonly initiated by an intrave- nous (IV) administration of hypnotics, such as thiopental or propofol, for abruptly bringing wakeful patients into unre- sponsiveness to strong adrenergic stimuli, including tracheal intubation and surgical procedures. However, hemodynamic instability in various degrees is commonly associated during the anesthesia induction phase using these hypnotics: 9% of patients experienced severe hypotension during and after anes- ORIGINAL ARTICLE J Cardiovasc Ultrasound 2014;22(2):58-64
Comparison of the Impact of the Anesthesia Induction Using Thiopental and
Propofol on Cardiac Function for Non-Cardiac Surgery
Hyun Suk Yang, MD, PhD1, Tae-Yop Kim, MD, PhD2, Seungho Bang, MD3, Ga-Yon Yu, MD2, Chungsik Oh, MD2, Soo-Nyung Kim, MD, PhD4, and Jung-Hyun Yang, MD, PhD5
Departments of 1Cardiovascular Medicine, 2Anesthesiology, 3Cardiovascular Surgery, 4Obstetrics and Gynecology,
5General Surgery, Konkuk University Medical Center, Konkuk University School of Medicine, Seoul, Korea
Background: Thiopental and propofol have been widely used for general anesthesia induction, but their impacts on cardiac function have not been well described. A recent study speculated that anesthesia induction using propofol 2 mg/kg transiently reduced left ventricular (LV) contraction by analyzing tissue Doppler-derived imaging (TDI) during induction phase. The purpose of this study was to analyze and to compare the impacts of propofol- and thiopental-induction on LV function.
Methods: Twenty-four female patients with normal LV function undergoing non-cardiac surgery were randomly administered intravenous bolus thiopental (5 mg/kg, Thiopental-group, n = 12) or propofol (2 mg/kg, Propofol-group, n = 12) for anesthesia- induction. TDI of septal mitral annular velocity during systole (S’), early diastole (e’) and atrial contraction (a’) were determined by transthoracic echocardiography before and 1, 3, and 5 minutes after thiopental/propofol administration (T0, T1, T2, and T3, respectively).
Results: The bispectral index and systolic blood pressure declined significantly during anesthesia induction in both groups, however, more depressed in Thiopental-group compared with those in Propofol-group at T2 and T3 (all, p < 0.05). Among TDI two parameters demonstrated a significant inter-group difference: the S’ in propofol was lower than that in Thiopental-group at T3 (p = 0.002), and a’ velocities were persistently lower in Propofol-group, compared with same time values in Thiopental-group (T1, T2, and T3: p = 0.025, 0.007, and 0.009, respectively).
Conclusion: Anesthesia induction using propofol revealed a more persistent and profound decline of LV and atrial contraction than that using thiopental. Further studies are needed to understand the clinical implication.
KEY WORDS: Intraoperative · Echocardiography · Doppler · Thiopental · Propofol.
• Received: December 23, 2013 • Revised: February 4, 2014 • Accepted: May 15, 2014
• Address for Correspondence: Tae-Yop Kim, Department of Anesthesiology, Konkuk University Medical Center, Konkuk University School of Medicine, 120-1 Neungdong-ro, Gwangjin-gu, Seoul 143-729, Korea Tel: +82-2-2030-5445, Fax: +82-2-2030-5449, E-mail: [email protected]
• This is an Open Access article distributed under the terms of the Creative Commons Attribution Non-Commercial License (http://creativecommons.org/licenses/by-nc/3.0) which permits unrestricted non-commercial use, distribution, and reproduction in any medium, provided the original work is properly cited.
thesia induction in clinical practice.6) As hypotension often oc- curs after IV thiopental and propofol, in patients with left ven- tricular (LV) dysfunction, etomidate is sometimes preferred as an alternative.7)
Unfortunately, even though LV systolic function is one risk factor for anesthesia induction events, and it is well known that induction has significant hemodynamic and cardiac ef- fects, the kind and magnitude to the effects on LV myocardi- um function of anesthesia induction, including the particular agents used, have not been thoroughly studied. This may be due to the routineness and apparent harmlessness of the effects as observed casually and also a lack of monitoring tools and procedures.
Doppler tissue imaging (DTI) non-invasively assesses myo- cardial tissue motion to evaluate both systolic and diastolic myocardial function with the advantage of less load-depen- dence than conventional flow pulsed wave (PW) Doppler techniques.8) Intraoperative tissue Doppler monitoring during anesthesia induction can be helpful to provide immediate in- sight into hemodynamic changes, giving an idea of loading conditions as well as myocardial performance during this vul- nerable phase. However, only a few previous studies have used DTI during anesthesia induction and evaluated propofol’s im- pact on cardiac function.9)10)
Considering that thiopental and propofol are the two most popular and widely used IV anesthesia induction agents, we sought to analyze and to compare the impacts of clinical dos- age of thiopental and propofol for anesthesia induction on car- diac function by using intraoperative transthoracic DTI.
Methods
Study population
After Institutional Review Board approval, we prospective- ly enrolled 24 adult patients who were scheduled for elective non-cardiac surgery and had low-risk as indicated by a revised cardiac risk index of 0,4) normal sinus rhythm, normal LV function (LV ejection fraction ≥ 60% and mitral septal annu- lar e’ ≥ 8 cm/s),11) no regional wall motion abnormality, and no structural heart diseases. Patients with any of the following con- ditions were excluded in the operation room: unfavorable air- way or facemask fit, intractable coughing, hiccups, or hypo- tension [mean blood pressure (BP) < 60 mmHg] requiring IV positive inotrope or vasoconstrictors during the study period.
Anesthesia induction
Pre-medication accorded with our routine practice: 10 mL/
kg/hour of Ringer’s lactate solution, a balanced crystalloid so- lution (Plasma Solution-ATM, CJ Bio and Pharmaceutical, Seoul, Korea), 0.2 mg of glycopyrrolate, and 0.03 mg/kg of midazolam. Once in the operation room, we started to moni- tor electrocardiography, non-invasive BP, heart rate (HR), pulse oximeter oxygen saturation, and the bispectral index (BIS). To
begin anesthesia induction, patients spontaneously inhaled ox- ygen (8 L/min) through a transparent facemask and a breathing circuit with a reservoir bag. Either bolus thiopental (5.0 mg/
kg) (PentotalTM sodium, JW Pharmaceutical, Seoul, Korea;
Thiopental group) or propofol (2.0 mg/kg) (PofolTM, Dongkuk Pharmaceutical, Seoul, Korea; Propofol group) was adminis- tered intravenously for 10 seconds, after which assisted and con- trolled ventilation followed. After 5 minutes, complete induc- tion was confirmed via a lack of train-of-four response and followed by tracheal intubation for maintenance anesthesia.
Intraoperative transthoracic echocardiography
After positioning the patient supine on the operation table, serial transthoracic echocardiography (TTE), two-dimensional imaging of the apical 4-chamber view and PW Doppler im- aging of mitral inflow, was performed with a portable GE Vivid Q platform (General Electric, Milwaukee, WI, USA), before (T0) and 1, 3, and 5 minutes after the thiopental bolus injection (T1, T2, and T3, respectively) along with hemody- namic recordings at the same times (BP, HR, and BIS). DTI was recorded at the septal mitral annulus from the apical 4-chamber view to determine longitudinal annular velocities with a sweep of 66.7 mm/s. Each set of images required less than 30 seconds.
The LV ejection fraction was determined from the 2-dimen- sional apical 4-chamber imaging by the modified Simpson’s method. The early diastolic velocity (E), late atrial filling ve- locity (A), and a deceleration time of E were assessed from the mitral inflow PW Doppler imaging. Tissue Doppler-derived indices of systolic (S’), early diastolic (e’), and late diastolic (a’) velocities were measured from mitral septal annular DTI from an average 3 beats.
Statistical analysis
Sample size estimation was based on the previous prospec- tive studies: Gauss et al.12) (n = 10 for propofol; n = 10 for etomidate; n = 10 for thiopental), Mulier et al.13) (n = 10 for each group), and Wodey et al.14) (n = 10 for thiopental; n = 10 for propofol), taking potential drop-outs during the measure- ment (20%) due to insufficient echocardiographic window into account.
Demographic data were presented as median values (inter- quartile range) or number of patients. Continuous variables were expressed as mean (standard deviation) or median (inter- quartile range). For comparison of demographic data between groups, the Mann-Whitney test was used. For statistical com- parisons of serial changes within a group, the Friedman test with multiple comparisons was applied. For comparison of car- diovascular data between thiopental and propofol group, the Wilcoxon-Mann-Whitney test was used. Statistical analysis was performed using dBSTAT 5.0 for Windows (dBSTAT, Seoul, Korea). A p-value < 0.05 (two-sided) was considered as statisti-
cally significant.
Results
A total of 24 consecutive patients were enrolled (12 for thiopental-, and 12 for propofol-based anesthesia induction).
The induction phase was uneventful and without exclusion.
The clinical characteristics are compared in Table 1. No sig- nificant difference was noted between the two groups.
The serial hemodynamic and echocardiographic changes in thiopental and propofol group are compared in Table 2.
Within the thiopental group, the BIS declined significantly after thiopental injection (T1, T2 vs. T0, p < 0.0001 and p = 0.0006, respectively); and then it recovered at T3 (T0, T1 vs.
T3, p = 0.106 and 0.004, respectively). Similar pattern was observed in mean BP (T1, T2, T3 vs. T0: 78.0, 85.5, 85.5 vs.
97.0 mmHg, p = 0.0006, 1.000, and 0.239, respectively; T1 vs. T3, p = 0.026). The LV ejection fraction decreased signifi- cantly from baseline, at T1 and T2 (p = 0.005 and 0.026, re- spectively), and recovered at T3 (p = 0.928). Even though the LV ejection fraction reduced temporarily, the quartile range was within normal systolic function [T1: 62.0% (56.1--65.2), T2: 63.3% (58.3--66.4)]. The median value of mitral inflow E, and deceleration time of E decreased from the baseline (T1, T2, T3 vs. T0: 69.5, 66.7, 68.2 vs. 84.5 cm/s, p = 0.056, 0.001, and 0.004; 180, 179, 183 vs. 160 ms, p = 0.034, 0.003, and 0.011, respectively), but no significant changes on late diastolic atrial contraction velocity (p = 0.332). Tissue Doppler-derived S’ velocity declined significantly at T1 and T2 compared with T0 (p = 0.003 and 0.001), however, it also slightly recovered at T3 (p = 0.072). Early diastolic annular e’ reduced signifi- cantly compared with T0 (all, p < 0.05), but no changes in the late diastolic a’ velocities which were corresponding to the atrial contraction (p = 0.140).
Within the propofol group, the BIS and systolic BP, declined from the baseline persistently throughout the induction phase (all, p < 0.05). The mitral inflow E decreased significantly at T1, T2, and T3 compared with T0 (p = 0.002, 0.001, and 0.001, respectively), combined with the reduced correspond- ing A velocities (p = 0.191, 0.008, and < 0.0001, respectively).
Tissue Doppler-derived S’ velocity declined persistently at T1, T2, and T3 compared with T0 (p = 0.001, 0.004, and 0.001, respectively). The mitral septal annular early diastolic e’ veloci- ties also decreased at T1, T2, and T3 compared with T0 (p = 0.010, 0.079, and 0.006, respectively), with the reduced corre- sponding a’ velocities (p = 0.079, 0.004, and < 0.0001, respec- tively).
Comparison between thiopental- and propofol- based anesthesia inductions
Comparison of the impact on cardiac function between thio- pental and propofol group is presented in Table 2. The hemo- dynamic comparison between groups is illustrated in Fig. 1.
Both groups showed declines of BIS and systolic BP after IV anesthesia injection (T0 vs. T1, all, p < 0.05); however, the de- cline and recovery pattern of BIS and systolic BP showed sig- nificant inter-group difference. In BIS, the baseline value was similar between the two (p = 0.553), so as the first drop at T1 (p = 0.069), however, after that thiopental group showed more recovered and higher level of BIS compared with those of pro- pofol [T2: 57.5 (52.0--64.8) vs. 44.0 (37.5--50.8), p = 0.009;
T3: 63.5 (62.0--66.5) vs. 45.0 (41.3--52.0), p < 0.001] (Fig.
1A). A related pattern was observed in systolic BP: the baseline and initial decline were similar between the two groups (p = 0.193 and 0.214); however, after that thiopental group tended to recover and significantly higher level of systolic BP com- pared with those of propofol [T2: 121.0 (111.3--136.8) vs.
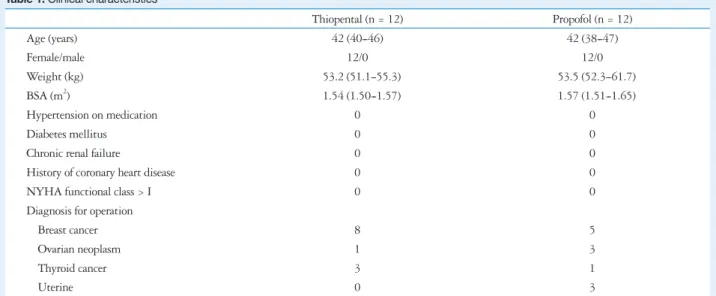
Table 1. Clinical characteristics
Thiopental (n = 12) Propofol (n = 12)
Age (years) 42 (40--46) 42 (38--47)
Female/male 12/0 12/0
Weight (kg) 53.2 (51.1--55.3) 53.5 (52.3--61.7)
BSA (m2) 1.54 (1.50--1.57) 1.57 (1.51--1.65)
Hypertension on medication 0 0
Diabetes mellitus 0 0
Chronic renal failure 0 0
History of coronary heart disease 0 0
NYHA functional class > I 0 0
Diagnosis for operation
Breast cancer 8 5
Ovarian neoplasm 1 3
Thyroid cancer 3 1
Uterine 0 3
Data are expressed as median (interquartile range) or n. Thiopental: patients administered bolus thiopental 5.0 mg/kg, Propofol: patients administered bolus propofol 2.0 mg/kg. BSA: body surface area by Mosteller equation, NYHA: New York Heart Association
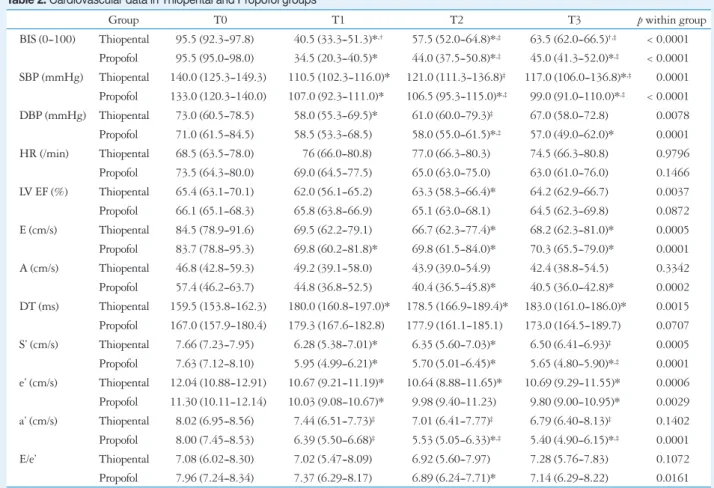
Table 2. Cardiovascular data in Thiopental and Propofol groups
Group T0 T1 T2 T3 p within group
BIS (0--100) Thiopental 95.5 (92.3--97.8) 40.5 (33.3--51.3)*,† 57.5 (52.0--64.8)*,‡ 63.5 (62.0--66.5)†,‡ < 0.0001 Propofol 95.5 (95.0--98.0) 34.5 (20.3--40.5)* 44.0 (37.5--50.8)*,‡ 45.0 (41.3--52.0)*,‡ < 0.0001 SBP (mmHg) Thiopental 140.0 (125.3--149.3) 110.5 (102.3--116.0)* 121.0 (111.3--136.8)‡ 117.0 (106.0--136.8)*,‡ 0.0001 Propofol 133.0 (120.3--140.0) 107.0 (92.3--111.0)* 106.5 (95.3--115.0)*,‡ 99.0 (91.0--110.0)*,‡ < 0.0001 DBP (mmHg) Thiopental 73.0 (60.5--78.5) 58.0 (55.3--69.5)* 61.0 (60.0--79.3)‡ 67.0 (58.0--72.8) 0.0078 Propofol 71.0 (61.5--84.5) 58.5 (53.3--68.5) 58.0 (55.0--61.5)*,‡ 57.0 (49.0--62.0)* 0.0001 HR (/min) Thiopental 68.5 (63.5--78.0) 76 (66.0--80.8) 77.0 (66.3--80.3) 74.5 (66.3--80.8) 0.9796 Propofol 73.5 (64.3--80.0) 69.0 (64.5--77.5) 65.0 (63.0--75.0) 63.0 (61.0--76.0) 0.1466 LV EF (%) Thiopental 65.4 (63.1--70.1) 62.0 (56.1--65.2) 63.3 (58.3--66.4)* 64.2 (62.9--66.7) 0.0037 Propofol 66.1 (65.1--68.3) 65.8 (63.8--66.9) 65.1 (63.0--68.1) 64.5 (62.3--69.8) 0.0872 E (cm/s) Thiopental 84.5 (78.9--91.6) 69.5 (62.2--79.1) 66.7 (62.3--77.4)* 68.2 (62.3--81.0)* 0.0005 Propofol 83.7 (78.8--95.3) 69.8 (60.2--81.8)* 69.8 (61.5--84.0)* 70.3 (65.5--79.0)* 0.0001 A (cm/s) Thiopental 46.8 (42.8--59.3) 49.2 (39.1--58.0) 43.9 (39.0--54.9) 42.4 (38.8--54.5) 0.3342 Propofol 57.4 (46.2--63.7) 44.8 (36.8--52.5) 40.4 (36.5--45.8)* 40.5 (36.0--42.8)* 0.0002 DT (ms) Thiopental 159.5 (153.8--162.3) 180.0 (160.8--197.0)* 178.5 (166.9--189.4)* 183.0 (161.0--186.0)* 0.0015 Propofol 167.0 (157.9--180.4) 179.3 (167.6--182.8) 177.9 (161.1--185.1) 173.0 (164.5--189.7) 0.0707 S’ (cm/s) Thiopental 7.66 (7.23--7.95) 6.28 (5.38--7.01)* 6.35 (5.60--7.03)* 6.50 (6.41--6.93)‡ 0.0005 Propofol 7.63 (7.12--8.10) 5.95 (4.99--6.21)* 5.70 (5.01--6.45)* 5.65 (4.80--5.90)*,‡ 0.0001 e’ (cm/s) Thiopental 12.04 (10.88--12.91) 10.67 (9.21--11.19)* 10.64 (8.88--11.65)* 10.69 (9.29--11.55)* 0.0006 Propofol 11.30 (10.11--12.14) 10.03 (9.08--10.67)* 9.98 (9.40--11.23) 9.80 (9.00--10.95)* 0.0029 a’ (cm/s) Thiopental 8.02 (6.95--8.56) 7.44 (6.51--7.73)‡ 7.01 (6.41--7.77)‡ 6.79 (6.40--8.13)‡ 0.1402 Propofol 8.00 (7.45--8.53) 6.39 (5.50--6.68)‡ 5.53 (5.05--6.33)*,‡ 5.40 (4.90--6.15)*,‡ 0.0001 E/e’ Thiopental 7.08 (6.02--8.30) 7.02 (5.47--8.09) 6.92 (5.60--7.97) 7.28 (5.76--7.83) 0.1072 Propofol 7.96 (7.24--8.34) 7.37 (6.29--8.17) 6.89 (6.24--7.71)* 7.14 (6.29--8.22) 0.0161 Baseline and follow-up data are expressed as median (interquartile range). Serial parameters before and 1, 3, and 5 minutes after intravenous bolus thiopental or propofol (T0, T1, T2, and T3, respectively). Thiopental: patients administered bolus thiopental 5.0 mg/kg, Propofol: patients administered bolus propofol 2.0 mg/kg. *p < 0.05: vs. T0 within the group, †p < 0.05: T1 vs. T3 within the group by Friedman’s test with multiple comparisons, ‡p < 0.05: compared with same-time value in the other group by the Wilcoxon-Mann-Whitney test. BIS: bispectral index, SBP: systolic blood pressure, DBP: diastolic blood pressure, HR: heart rate, LV: left ventricular, EF: ejection fraction, E: mitral inflow peak early filling velocity, A: mitral inflow peak late filling velocity, DT: deceleration time of E velocity, S’: mitral septal annular systolic myocardial velocity, e’: mitral septal annular early diastolic myocardial relaxation velocity, a’: mitral septal annular velocity associated with atrial contraction
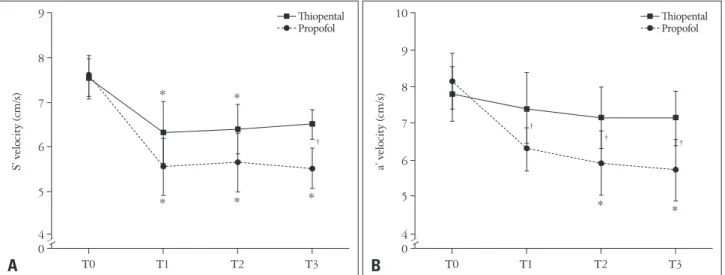
Fig. 1. Comparison of serial hemodynamic changes between Thiopental and Propofol group. Serial bispectral index (BIS) (A), and systolic blood pressure (B) in the thiopental and propofol group, before and 1, 3, and 5 minutes after injection of anesthesia (T0, T1, T2, and T3, respectively).
Thiopental: patients administered bolus thiopental 5.0 mg/kg, Propofol: patients administered bolus propofol 2.0 mg/kg. Values were median (interquartile). *p < 0.05 vs. T0 within the group by Friedman’s test with multiple comparisons, †p < 0.05, between the group by the Wilcoxon-Mann- Whitney test. A significant group difference is noted 3 to 5 minutes after anesthesia injection.
0 20 40 60 80 100
T0 T1 T2 T3
BIS
A
Thiopental Propofol
*
*
*
†
†
*
*
0 80 60 100 120 140 160
T0 T1 T2 T3
Systolic blood pressure (mmHg)
B
Thiopental Propofol
*
* *
†
†
*
*
106.5 (95.3--115.0) mmHg, p = 0.014; T3: 117.0 (106.0-- 136.8) vs. 99.0 (91.0--110.0) mmHg, p = 0.016] (Fig. 1B).
Among the tissue Doppler-derived indices, significant inter- group difference was found in S’ and a’ velocities (Fig. 2). In S’
velocity, the baseline median value was the almost identical, and initial decline at T1, and T2 did not show revealed significant inter-group differences; however, at T3, propofol group revealed significantly lower S’ velocity than the thiopental group [6.50 (6.14--6.93) vs. 5.65 (4.80--5.90) cm/s, p = 0.002] (Fig. 2A).
In a’ velocity, the baseline median was similar; however, there were persistent inter-group differences at T1, T2, and T3 (p = 0.025, 0.007, and 0.009, respectively), the propofol group showed significantly depressed atrial contraction after anesthe- sia, which was not observed in the thiopental group (Fig. 2B).
Discussion
The present study showed a clinical dosage of thiopental or propofol for anesthesia induction commonly revealed a signifi- cant and immediate decline of S’ and e’. Considering its result with the significant decline of a’, these results corresponded well to those of the previous studies showing propofol-in- duced declines of S’, e’, and a’ in TTE during anesthesia in- duction.9)10) The present study found a significant difference in drug-specific depressive impacts on cardiac function--propo- fol-group revealed a more profound decline of S’ at T3 (p = 0.002), and a’ velocities at T1, T2, and T3, than thiopental- based one (p = 0.025, 0.007, and 0.009, respectively).
During this short and dynamic anesthesia induction period, Doppler monitoring was successful in 22 of 24 patients (92%).
In 2 cases (8%), the velocity measurement was limited by pre- mature beats or tachycardia after thiopental injection. There-
fore, the feasibility of DTI monitoring during the induction anesthesia was 100% in propofol and 83% in the thiopental group.
Hemodynamic effects of anesthesia induction using thio- pental or propofol have been reported in several clinical stud- ies6)12-15) for various ages or American Society of Anesthesiolo- gists’ (ASA) statuses.16) Reich et al.6) reported from retrospective anesthesia records that a clinically significant hypotension [mean arterial pressure (MAP) < 60 mmHg; or MAP decrease
> 40% and < 70 mmHg] within 5 minutes after thiopental injection was 0% in ASA I--II, and 2.3% in ASA III--IV; after propofol injection was 3.0% in ASA I--II, and 4.8% in ASA III--IV. In the present study, all the subjects were carefully se- lected as ASA I, therefore, either group has any clinical conse- quential hypotensive event during the study period.
Sørensen et al.15) reported that at a clinical dosage of thiopen- tal and propofol, there was a shorter onset time with thiopental, and deeper BIS and mean arterial BP declines with propofol.
That pattern was similar to our clinical observation of more per- sistent declines in BP and BIS with propofol compared with thiopental. On the other hand, changes of HR after thiopental or propofol injections have been reported inconsistently. With thiopental, it has been reported mostly as increases12)13) but with no change at lower doses or in infants13)14) and decreases in the elderly population.15) With propofol no changes have been re- ported.17) In this study, neither thiopental nor propofol revealed significant changes during the induction period, although two cases of abrupt tachyarrhythmia occurred only in the thiopen- tal group.
Cardiovascular depressive effects of thiopental or propofol have been explained from direct myocardial effects18)19) as well
Fig. 2. Comparison of tissue Doppler-derived indices of septal mitral annular velocity during systole (S’) and late diastole atrial contraction (a’). Serial S’ velocities (A), and a’ velocities (B) in Thiopental and Propofol group, before and 1, 3, and 5 minutes after injection of anesthesia (T0, T1, T2, and T3, respectively). Thiopental: patients administered bolus thiopental 5.0 mg/kg, Propofol: patients administered bolus propofol 2.0 mg/kg. Values were median (interquartile). *p < 0.05, vs. T0 within the group by Friedman’s test with multiple comparisons, †p < 0.05, between the group. Persistent decline of S’ (compared with T0) is noted at T3 in the propofol group, which is recovered in the thiopental. At T3, the S’ is lower in propofol than in thiopental (p = 0.002). Declining of a’ velocities from T0 is significant throughout the study period in the propofol group; however, those changes are not observed in the thiopental group (p < 0.05).
0 5 4 6 7 8 9 10
T0 T1 T2 T3
a’ velocity (cm/s)
B
Thiopental Propofol
*
†
† †
* 0
5 4 6 7 8 9
T0 T1 T2 T3
S’ velocity (cm/s)
A
Thiopental Propofol
*
* *
†
*
*
as indirect effects on the neuronal system.20) Dose-dependent myocardial depression has been reported by many experimen- tal studies.18)19)21) However, only a few clinical studies could be found regarding comparison of the myocardial depressive ef- fect of thiopental versus propofol anesthesia induction.12-14) Gauss et al.12) reported that fractional shortening dropped about 14% after thiopental induction, versus no change after propofol. Mulier et al.13) concluded that the cardio-depressant effects of propofol are more pronounced and more prolonged than those of equipotent doses of thiopental when given as a single bolus, by measuring LV volume using intraoperative transesophageal echocardiography. Wodey et al.14) demonstrat- ed that myocardial contractility decreased significantly 5 min- utes after induction with both thiopental and propofol in in- fants, measuring LV diameters using TTE. These previous clinical studies12-14) provided reasonable concepts of myocardi- al depressive effects of induction anesthesia. However, their evaluation tool of M-mode dimension or volume, and frac- tional shortening would not sufficiently monitor (give an idea from beat to beat) live in this short induction period. In this study, we adopted live monitoring of intraoperative transtho- racic DTI to evaluate the impact of IV anesthesia induction on myocardial performance. Intraoperative transthoracic DTI eval- uation seems promising to provide immediate insight into he- modynamic changes as well as myocardial performance.
Regarding systolic function, in this study, the LV ejection fraction was temporarily decreased at T1 and T2 compared with T0, in thiopental; there were no significant changes in propofol. These results are similar to the aforementioned study by Gauss et al.12) on fractional shortening.12) However, even though there was a statistically significant decrease of LV ejec- tion in the thiopental group, the clinical significance of the roughly 5% decrease may in itself be low. The present study is somewhat unique in directly monitoring S’ by DTI to com- pare systolic function between two commonly used induction anesthesia. In both anesthesia inductions, S’ significantly de- creased from T0 within a group; however, at T3, the thiopen- tal group tended to recover. Therefore, the between group dif- ference was significant [6.50 (6.14--6.93) vs. 5.65 (4.80--5.90) cm/s, p = 0.002]. It may support the previous findings15) that with a clinical dosage of thiopental and propofol, thiopental has a shorter onset time and shorter depressive effect on myo- cardium during the induction period. The clinical impact of such a degree of decline of S’ has not been tested.
A more interesting finding was between-group differences on diastolic function. The early relaxation velocities (e’) de- clined consistently in both groups; the impact on atrial con- traction (a’) was significantly different between groups. There was a significant decrease of a’ with propofol but not with thiopental (p < 0.05). Therefore, we can speculate that thio- pental may compromise atrial contraction less. Further studies are needed to discern the precise clinical impact.
This study has several limitations. First, it reflects only a
single center with a relatively small and strictly female popu- lation. Non-parametric analysis would overcome the small sample size. Performing studies in gynecologic surgery is lim- ited to the female population, further study could include ei- ther gender or higher-risk patients. Second, for reasons of practicality, it did not measure sophisticated indices of preload or afterload. To include all the desired parameters may require more time, and turn to non-continuous monitoring as a point of single parameter-likely therefore, missing closely-timed variations. Therefore, in this study we focused on clinically ap- plicable DTI parameters, which seem relatively less load-de- pendent and easy to perform. Third, even though we limited parameters to those with DTI, the measuring was not com- pletely continuous manner since that would require multiple simultaneous Doppler scanners.
Furthermore, this study was an observational, non-interven- tional design, to see changes of tissue Doppler-derived indices during routine clinical practice using either IV anesthesia in- duction agent. Considering that BIS decreased more profoundly and persistently with propofol than thiopental (p < 0.001); fur- ther studies may be warranted controlling for BIS level to deter- mine BIS-independent effects of the induction agents on car- diac function. Future studies would also usefully expand to include other clinical populations.
In conclusion, using intraoperative transthoracic DTI imag- ing, we examined impacts on cardiac function from the two most commonly applied IV anesthesia induction agents, thio- pental and propofol--the propofol-based anesthesia group re- vealed a more persistent and profound decline of S’ and a’ ve- locities than the thiopental-based group. This suggests a specific drug-dependent impact on myocardial performance during the anesthesia induction. Further studies are warranted to un- derstand the clinical implications--these may affect the choice of induction anesthesia agent during pre-operative patient evaluation.
• Acknowledgements
This study was supported by an Industry-Academy grant of the Korean Society of Echocardiography (2012, Yang HS).
References
1. Singh A, Antognini JF. Perioperative hypotension and myocardial isch- emia: diagnostic and therapeutic approaches. Ann Card Anaesth 2011;
14:127-32.
2. American College of Cardiology Foundation/American Heart Asso- ciation Task Force on Practice Guidelines; American Society of Echocardiography; American Society of Nuclear Cardiology; Heart Rhythm Society; Society of Cardiovascular Anesthesiologists; Soci- ety for Cardiovascular Angiography and Interventions; Society for Vascular Medicine; Society for Vascular Surgery, Fleisher LA, Beck- man JA, Brown KA, Calkins H, Chaikof EL, Fleischmann KE, Freeman WK, Froehlich JB, Kasper EK, Kersten JR, Riegel B, Robb JF. 2009 ACCF/AHA focused update on perioperative beta blockade incorporated into the ACC/AHA 2007 guidelines on perioperative cardio- vascular evaluation and care for noncardiac surgery. J Am Coll Cardiol 2009;54:e13-118.
3. Task Force for Preoperative Cardiac Risk Assessment and Periopera- tive Cardiac Management in Non-cardiac Surgery; European Soci- ety of Cardiology (ESC), Poldermans D, Bax JJ, Boersma E, De Hert S, Eeckhout E, Fowkes G, Gorenek B, Hennerici MG, Iung B, Kelm M, Kjeldsen KP, Kristensen SD, Lopez-Sendon J, Pelosi P, Philippe F, Pierard L, Ponikowski P, Schmid JP, Sellevold OF, Sicari R, Van den Berghe G, Vermassen F. Guidelines for pre-operative cardiac risk assessment and perioperative cardiac management in non-cardiac sur- gery. Eur Heart J 2009;30:2769-812.
4. Lee TH, Marcantonio ER, Mangione CM, Thomas EJ, Polanczyk CA, Cook EF, Sugarbaker DJ, Donaldson MC, Poss R, Ho KK, Ludwig LE, Pedan A, Goldman L. Derivation and prospective valida- tion of a simple index for prediction of cardiac risk of major noncardiac sur- gery. Circulation 1999;100:1043-9.
5. Fleisher LA, Beckman JA, Brown KA, Calkins H, Chaikof EL, Fleischmann KE, Freeman WK, Froehlich JB, Kasper EK, Kersten JR, Riegel B, Robb JF, Smith SC Jr, Jacobs AK, Adams CD, An- derson JL, Antman EM, Buller CE, Creager MA, Ettinger SM, Fax- on DP, Fuster V, Halperin JL, Hiratzka LF, Hunt SA, Lytle BW, Nishimura R, Ornato JP, Page RL, Riegel B, Tarkington LG, Yancy CW. ACC/AHA 2007 Guidelines on Perioperative Cardiovascular Eval- uation and Care for Noncardiac Surgery: Executive Summary: A Report of the American College of Cardiology/American Heart Association Task Force on Practice Guidelines (Writing Committee to Revise the 2002 Guidelines on Perioperative Cardiovascular Evaluation for Noncardiac Surgery) De- veloped in Collaboration With the American Society of Echocardiography, American Society of Nuclear Cardiology, Heart Rhythm Society, Society of Cardiovascular Anesthesiologists, Society for Cardiovascular Angiography and Interventions, Society for Vascular Medicine and Biology, and Society for Vascular Surgery. J Am Coll Cardiol 2007;50:1707-32.
6. Reich DL, Hossain S, Krol M, Baez B, Patel P, Bernstein A, Bodian CA. Predictors of hypotension after induction of general anesthesia. Anesth Analg 2005;101:622-8, table of contents.
7. Bovill JG. Intravenous anesthesia for the patient with left ventricular dys- function. Semin Cardiothorac Vasc Anesth 2006;10:43-8.
8. Isaaz K. Tissue Doppler imaging for the assessment of left ventricular systol- ic and diastolic functions. Curr Opin Cardiol 2002;17:431-42.
9. Yang HS, Song BG, Kim JY, Kim SN, Kim TY. Impact of propofol anesthesia induction on cardiac function in low-risk patients as measured by
intraoperative Doppler tissue imaging. J Am Soc Echocardiogr 2013;26:
727-35.
10. Larsen JR, Torp P, Norrild K, Sloth E. Propofol reduces tissue-Doppler markers of left ventricle function: a transthoracic echocardiographic study.
Br J Anaesth 2007;98:183-8.
11. Nagueh SF, Appleton CP, Gillebert TC, Marino PN, Oh JK, Smis- eth OA, Waggoner AD, Flachskampf FA, Pellikka PA, Evangelista A. Recommendations for the evaluation of left ventricular diastolic function by echocardiography. J Am Soc Echocardiogr 2009;22:107-33.
12. Gauss A, Heinrich H, Wilder-Smith OH. Echocardiographic assess- ment of the haemodynamic effects of propofol: a comparison with etomidate and thiopentone. Anaesthesia 1991;46:99-105.
13. Mulier JP, Wouters PF, Van Aken H, Vermaut G, Vandermeersch E. Cardiodynamic effects of propofol in comparison with thiopental: assess- ment with a transesophageal echocardiographic approach. Anesth Analg 1991;72:28-35.
14. Wodey E, Chonow L, Beneux X, Azzis O, Bansard JY, Ecoffey C.
Haemodynamic effects of propofol vs thiopental in infants: an echocardio- graphic study. Br J Anaesth 1999;82:516-20.
15. Sørensen MK, Dolven TL, Rasmussen LS. Onset time and haemody- namic response after thiopental vs. propofol in the elderly: a randomized tri- al. Acta Anaesthesiol Scand 2011;55:429-34.
16. Aronson WL, McAuliffe MS, Miller K. Variability in the American Society of Anesthesiologists Physical Status Classification Scale. AANA J 2003;71:265-74.
17. Tramèr MR, Moore RA, McQuay HJ. Propofol and bradycardia: cau- sation, frequency and severity. Br J Anaesth 1997;78:642-51.
18. Park WK, Lynch C 3rd. Propofol and thiopental depression of myocardial contractility. A comparative study of mechanical and electrophysiologic effects in isolated guinea pig ventricular muscle. Anesth Analg 1992;74:395- 405.
19. Chen WH, Lee CY, Hung KC, Yeh FC, Tseng CC, Shiau JM. The direct cardiac effect of propofol on intact isolated rabbit heart. Acta Anaes- thesiol Taiwan 2006;44:19-23.
20. Russo H, Bressolle F. Pharmacodynamics and pharmacokinetics of thio- pental. Clin Pharmacokinet 1998;35:95-134.
21. Komai H, Rusy BF. Differences in the myocardial depressant action of thiopental and halothane. Anesth Analg 1984;63:313-8.